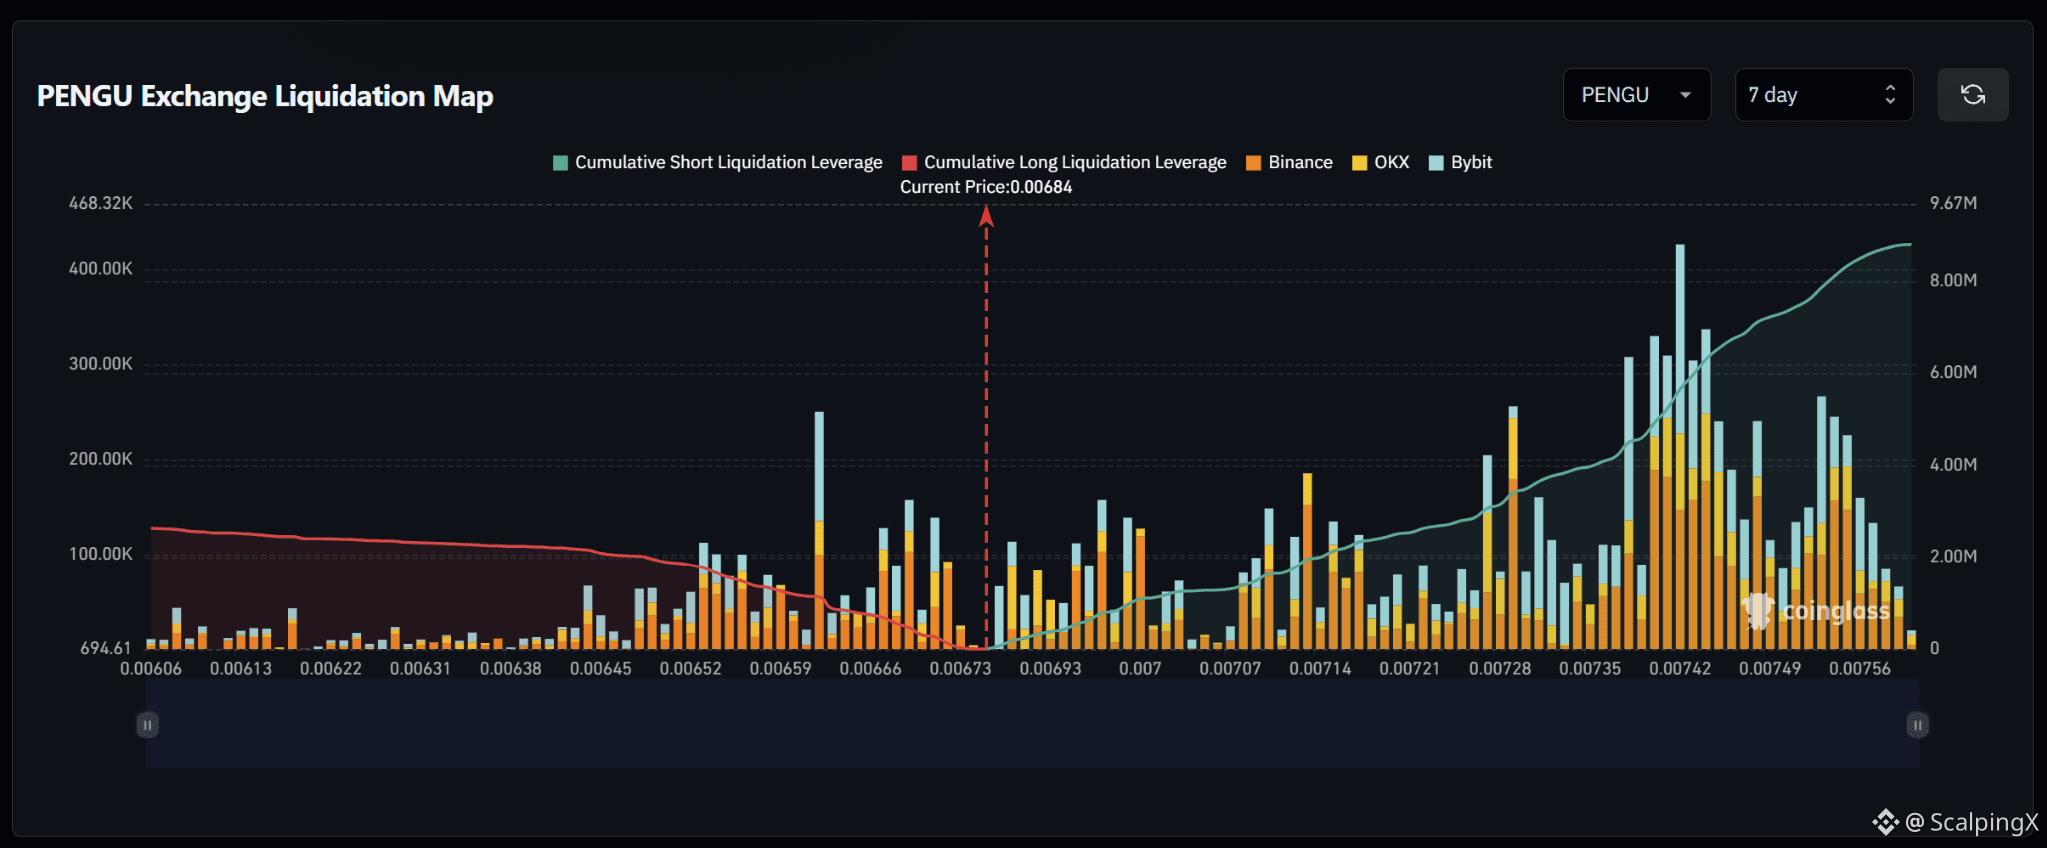
$PENGU – Liquidation Map (7 Days) – Current Price 0.00684
🔎 The 7-day liquidation map shows roughly $8.5–8.8 million in short liquidations above the current price, far exceeding approximately $2.3–2.5 million in long liquidations below. The liquidity structure therefore strongly favors the upside, with around 3.5 times more cumulative liquidity above the market.
📉 Below the market, long-liquidation liquidity is concentrated mainly across 0.00645–0.00673. The strongest cluster sits near 0.00659 with a bar around $250,000, while 0.00652–0.00657 and 0.00666–0.00670 also contain several bars around $100,000–160,000. Losing 0.00673 would shift attention toward 0.00666–0.00659.
📈 Above the market, short-liquidation liquidity begins building clearly from 0.00693 and becomes much denser across 0.00728–0.00756. The strongest cluster sits around 0.00739–0.00744, with the largest bar above $400,000. Additional notable clusters appear near 0.00728 and 0.00753–0.00756 with bars around $240,000–270,000.
🧭 The broader setup strongly favors the upside because short-liquidation exposure above is roughly 3.5 times larger. Breaking above 0.00693 would increase the probability of a sweep toward 0.00714–0.00728; if momentum continues, 0.00739–0.00756 becomes the next major liquidity zone. Losing 0.00673 would instead shift attention toward 0.00666–0.00659.
🔎 The 7-day liquidation map shows roughly $8.5–8.8 million in short liquidations above the current price, far exceeding approximately $2.3–2.5 million in long liquidations below. The liquidity structure therefore strongly favors the upside, with around 3.5 times more cumulative liquidity above the market.
📉 Below the market, long-liquidation liquidity is concentrated mainly across 0.00645–0.00673. The strongest cluster sits near 0.00659 with a bar around $250,000, while 0.00652–0.00657 and 0.00666–0.00670 also contain several bars around $100,000–160,000. Losing 0.00673 would shift attention toward 0.00666–0.00659.
📈 Above the market, short-liquidation liquidity begins building clearly from 0.00693 and becomes much denser across 0.00728–0.00756. The strongest cluster sits around 0.00739–0.00744, with the largest bar above $400,000. Additional notable clusters appear near 0.00728 and 0.00753–0.00756 with bars around $240,000–270,000.
🧭 The broader setup strongly favors the upside because short-liquidation exposure above is roughly 3.5 times larger. Breaking above 0.00693 would increase the probability of a sweep toward 0.00714–0.00728; if momentum continues, 0.00739–0.00756 becomes the next major liquidity zone. Losing 0.00673 would instead shift attention toward 0.00666–0.00659.