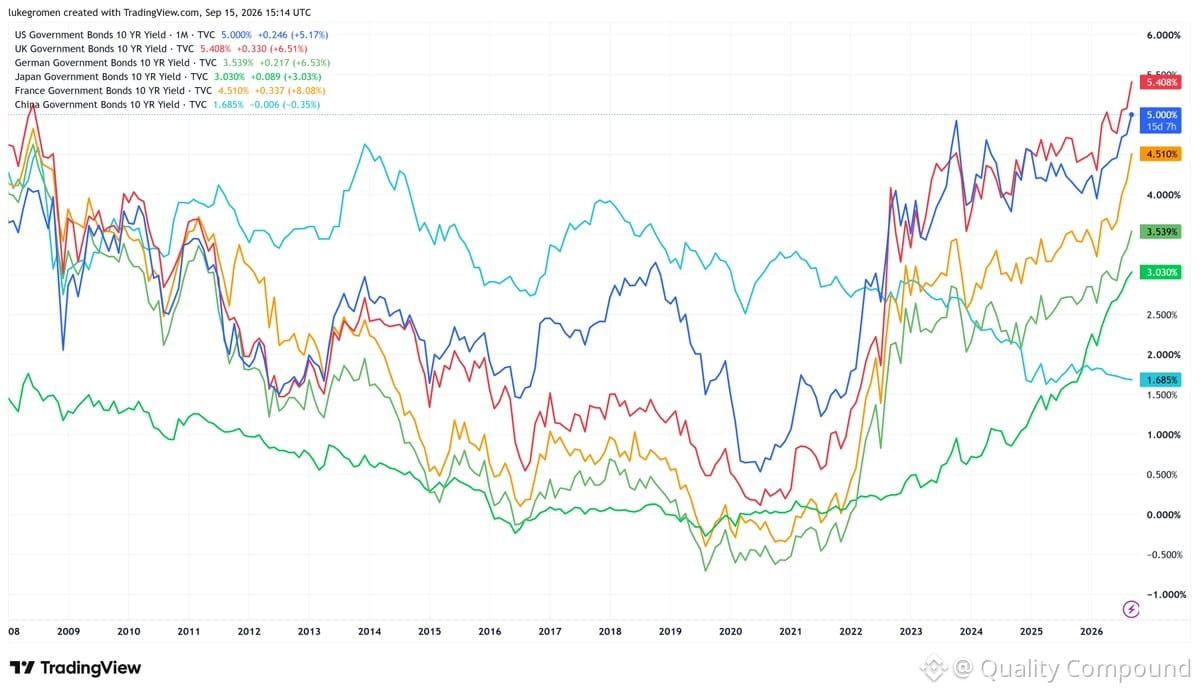
Interesting chart on global 10-year yields. $US10Y (blue) vs UK (red), Germany (dark green), Japan (light green), France (orange), China (aqua).
The irony: China hawks argued China was weak 2013-22 when its yields were highest. Now they're saying China's weak because its yields are lowest.
Lower yields typically signal dovish policy, weaker growth expectations, or capital inflows seeking safety. Higher yields can mean stronger growth or inflation pressure — or funding stress. Context matters more than the absolute level.
China's yield compression reflects slowing domestic demand and PBOC easing. Whether that's "losing" depends on your framework. For now, it's a sign of divergence: China easing while the West stayed tight (until recently). That spread matters for capital flows and currency.
The irony: China hawks argued China was weak 2013-22 when its yields were highest. Now they're saying China's weak because its yields are lowest.
Lower yields typically signal dovish policy, weaker growth expectations, or capital inflows seeking safety. Higher yields can mean stronger growth or inflation pressure — or funding stress. Context matters more than the absolute level.
China's yield compression reflects slowing domestic demand and PBOC easing. Whether that's "losing" depends on your framework. For now, it's a sign of divergence: China easing while the West stayed tight (until recently). That spread matters for capital flows and currency.