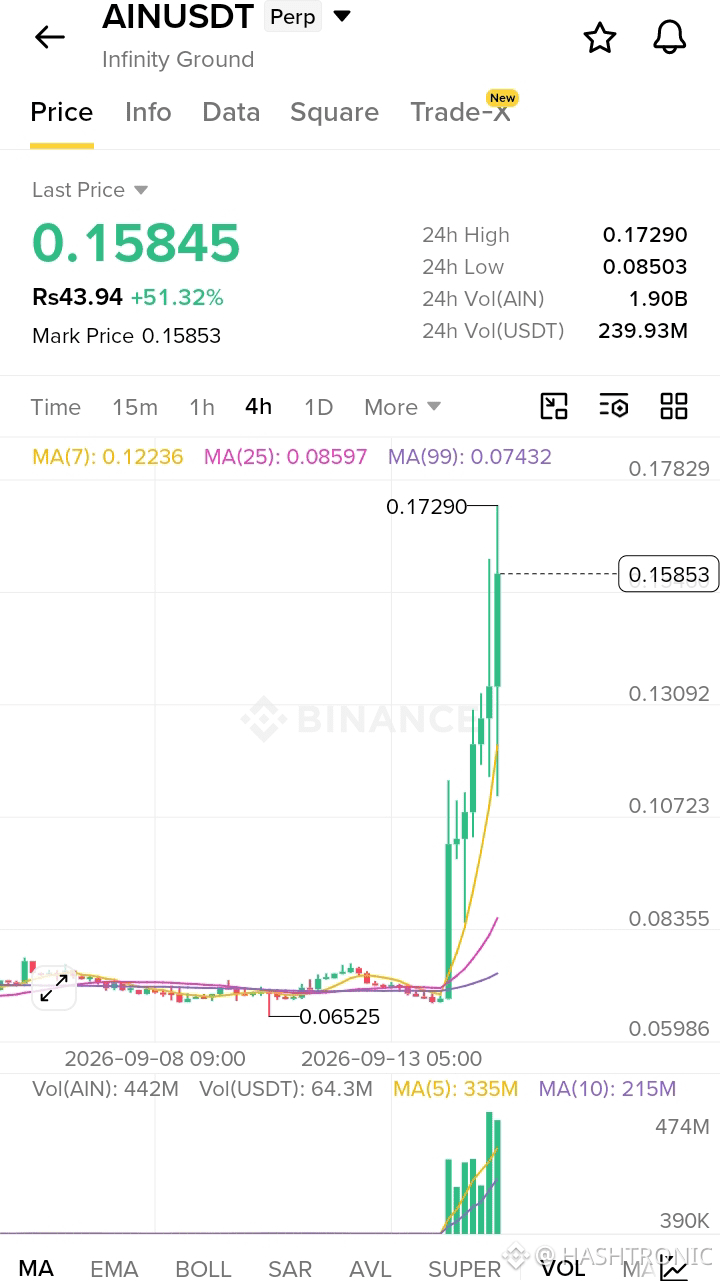
🚨 $AIN JUST EXPLODED +51% — BUT IS THE NEXT MOVE UP OR A PULLBACK? 📊👀
🔥 $AIN — 4H CHART ANALYSIS
📍 Market Bias: BULLISH ⚡
📈 Current Price: 0.15845
🚀 24H Change: +51.32%
🎯 24H High: 0.17290
📌 EDUCATIONAL SETUP
🟢 Possible Entry Zone:
0.14500 – 0.15200
(Example pullback/retest area — not a live trading signal)
🛑 Invalidation / Stop Level:
Below 0.13800
🎯 Target 1:
0.16500
🎯 Target 2:
0.17290
🎯 Target 3:
0.18500
⚖️ Risk/Reward:
Depends on the actual entry and confirmation.
📊 CONFIRMATION TO WATCH:
✅ Price holds the breakout area
✅ Buying volume remains elevated
✅ 4H candle confirms support
❌ A strong rejection followed by loss of support weakens the bullish setup
⚠️ IMPORTANT:
AIN has already made a very aggressive move. Chasing a vertical pump can carry significant risk. Wait for confirmation rather than assuming the price must continue upward.
👀 SAVE THIS CHART & WATCH THE NEXT 4H CANDLE!
#AIN #AINUSDT #SouthKoreaCryptoTaxDelayPetitionTops50000 #SolanaTransactionV1GoesLiveOnMainnet #RussianCentralBankFlagsCryptoAsFinancialRisk