
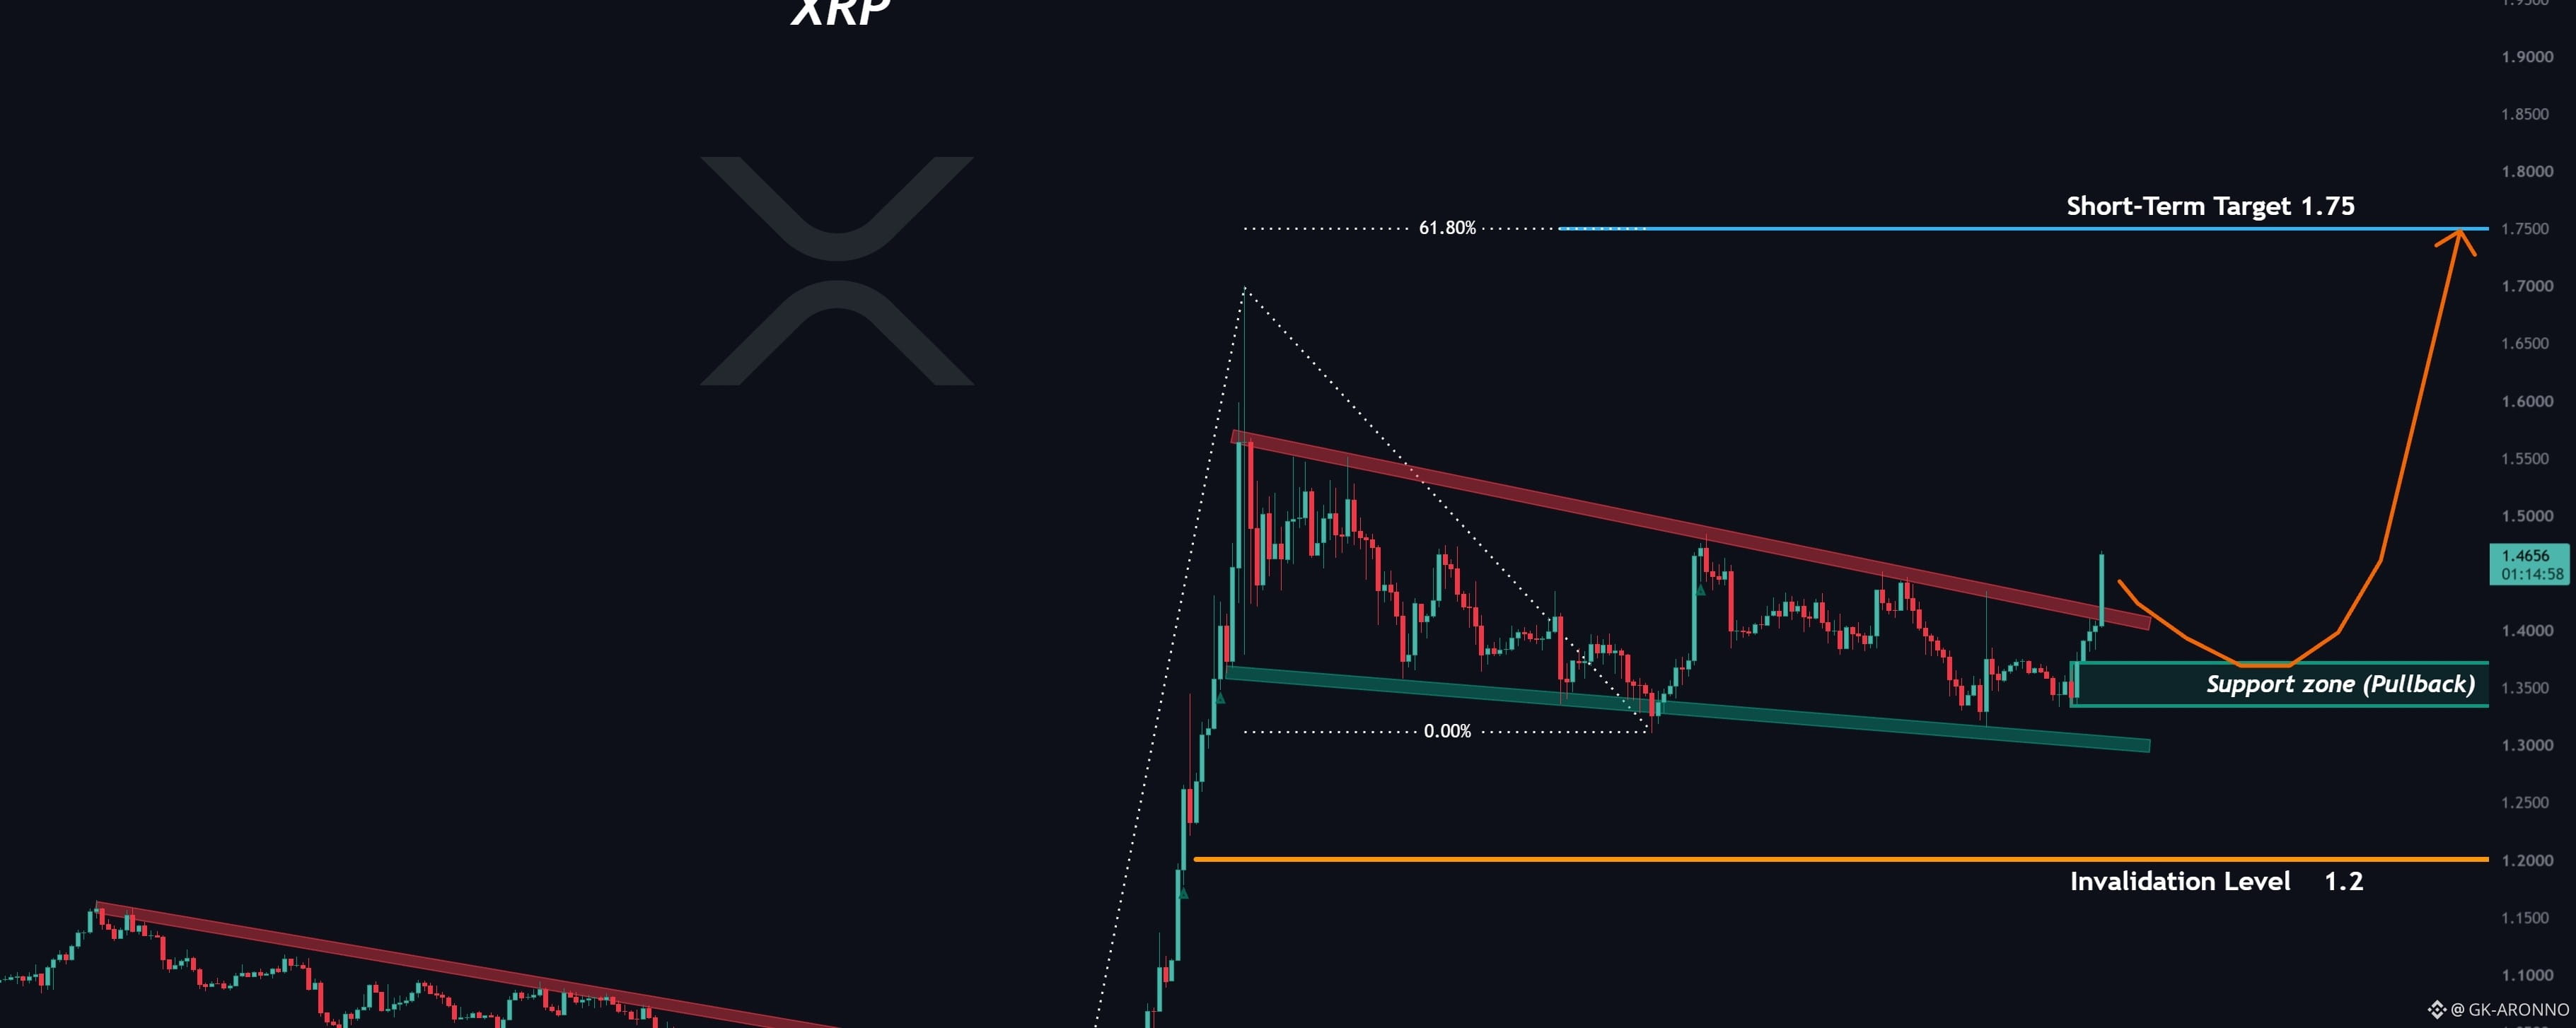

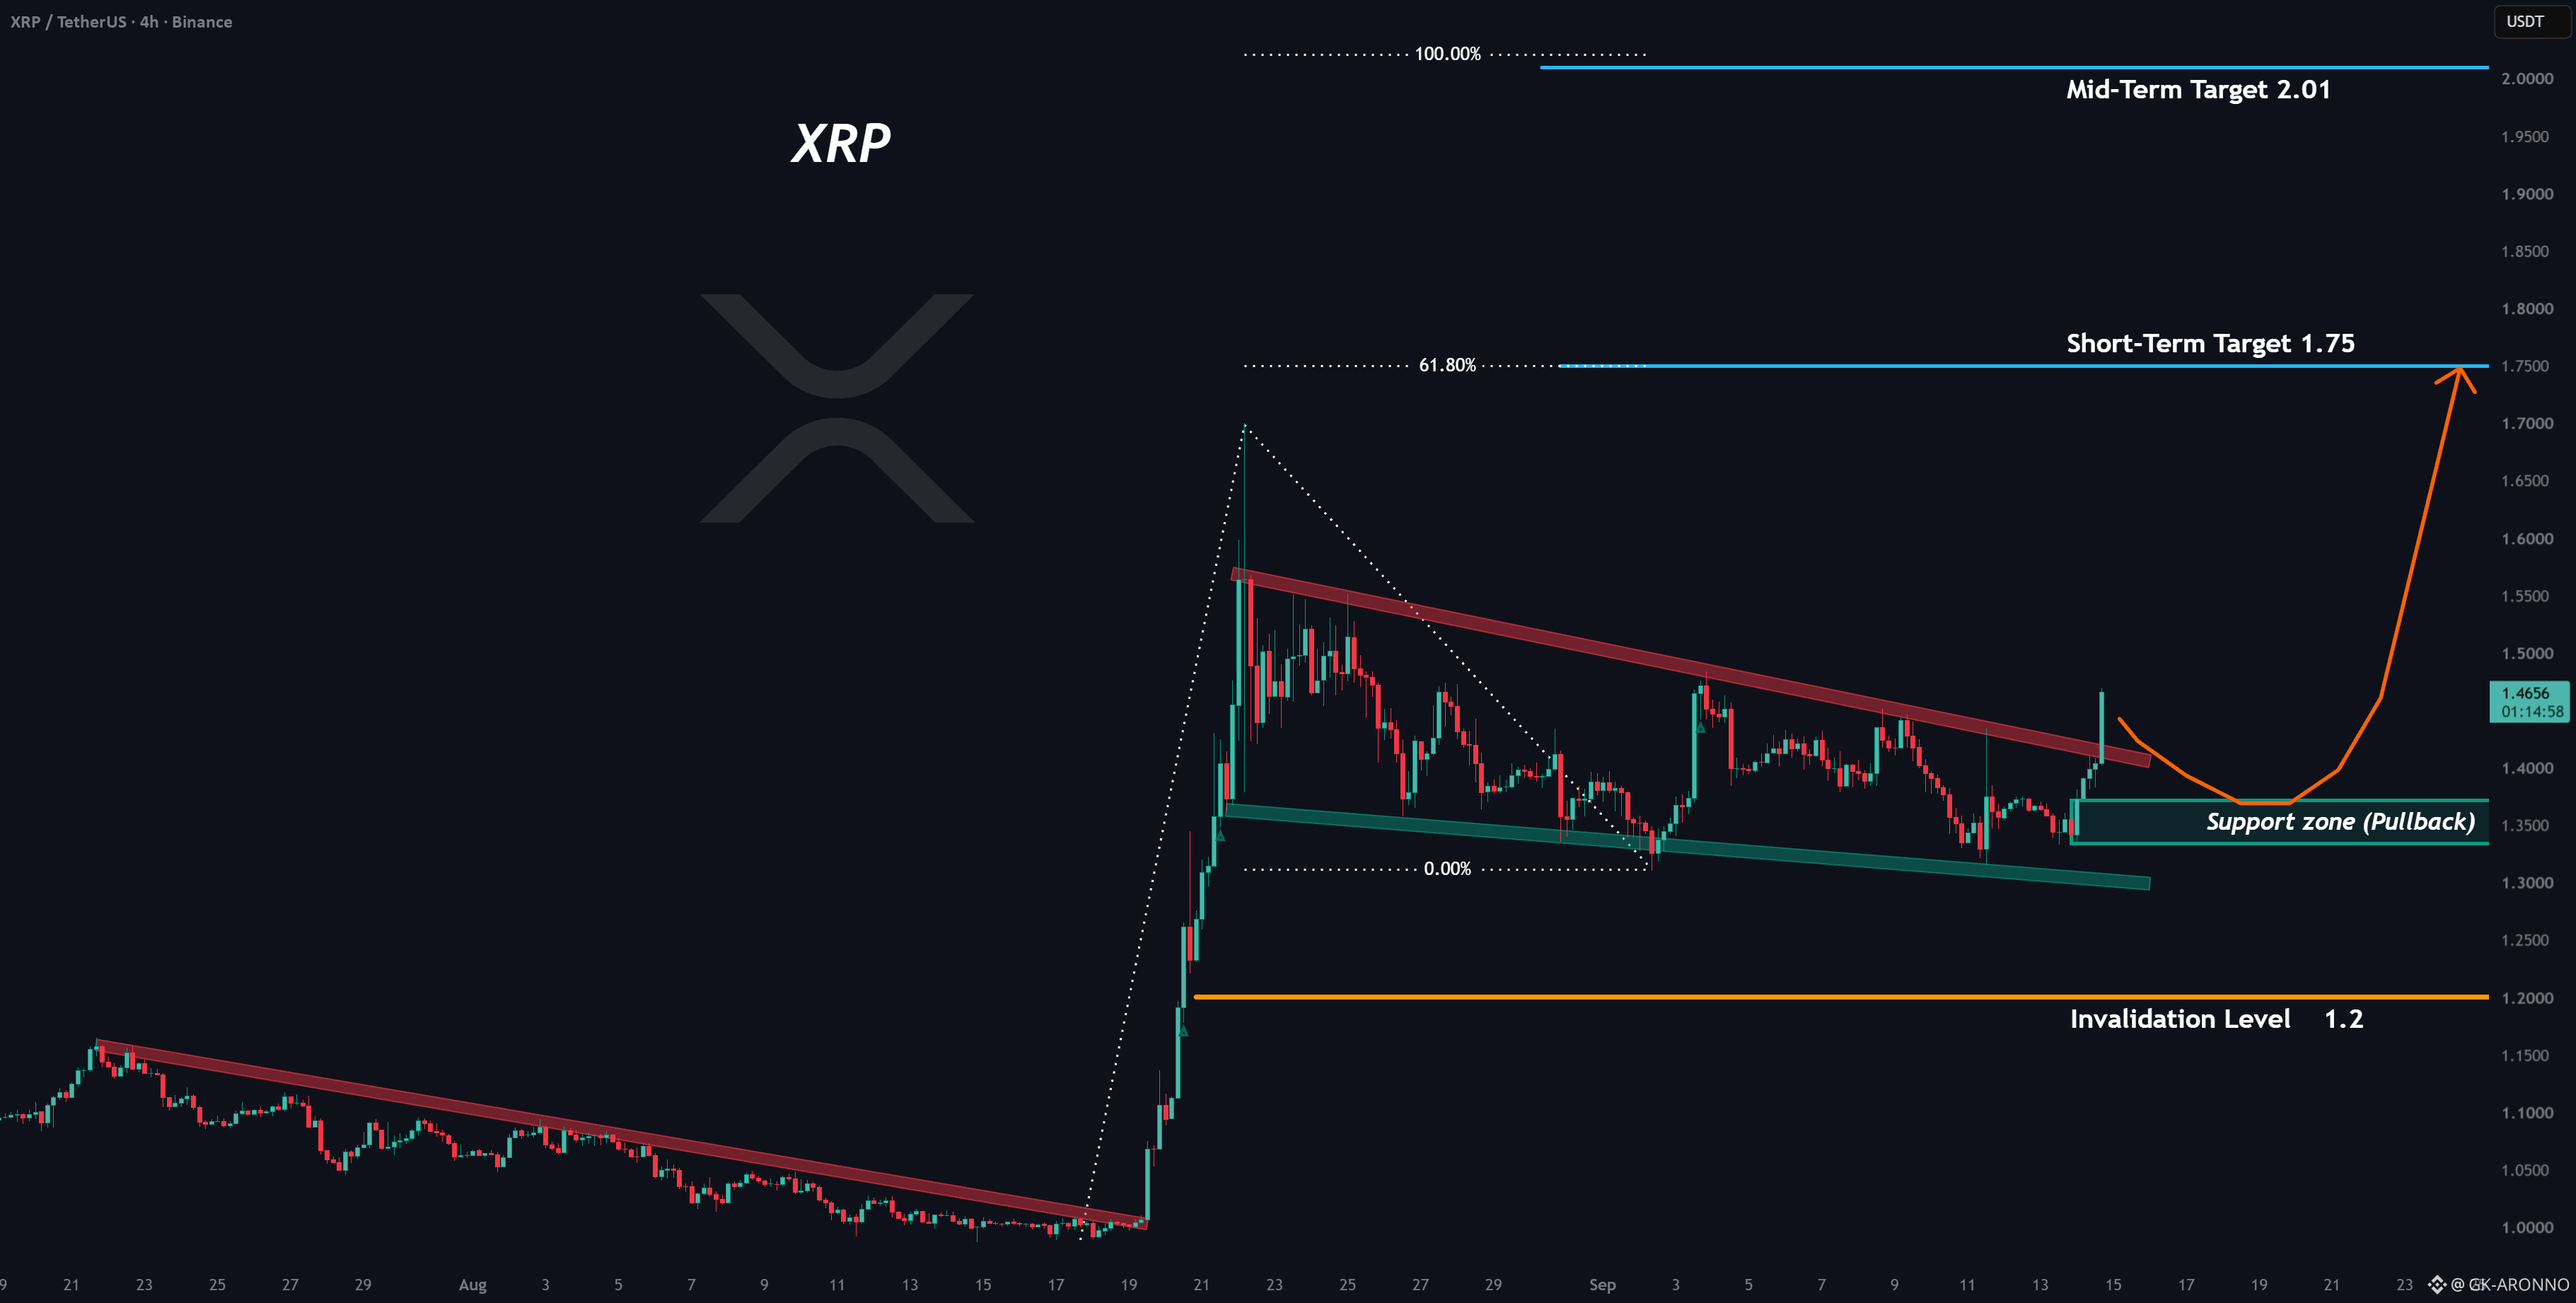
 XRP XRP has spent the recent period consolidating after its strong upside move, with price compressing between a descending resistance line and a rising/less-declining support structure.
The current structure can potentially be interpreted as a falling wedge, but the important point is that XRP has repeatedly pushed toward the upper boundary without yet producing a fully confirmed breakout on the chart.
After the previous impulsive move, this type of consolidation can represent a time-based correction or period of rest rather than an immediate bearish reversal. Price has continued to hold above the broader support structure while sellers have struggled to produce a sustained breakdown.
The latest price action is now pushing through the upper resistance area, making the next reaction particularly important.
Technical Structure
The main structure visible on the chart is a potential falling wedge / contracting consolidation.
Price has:
Established a major upside move before entering consolidation.
Repeatedly tested the descending resistance.
Continued to trade above the major support structure.
Recently pushed above the upper wedge boundary.
Marked a potential pullback/support area around $1.34–$1.40.
The breakout should not automatically be treated as confirmed continuation. A successful retest and hold of the breakout area would provide stronger evidence that resistance has shifted into support.
Setup
Timeframe: Not clearly visible on the provided chart
Current Price: Approximately $1.4577
Bias: Bullish while the marked structure remains valid
Entry / Pullback Zone: $1.34–$1.40
Invalidation: $1.20
Target 1: $1.75
Target 2: $2.01
The chart does not provide a precise entry price. The cleaner approach is:
Wait for a pullback and confirmation in the marked zone.
