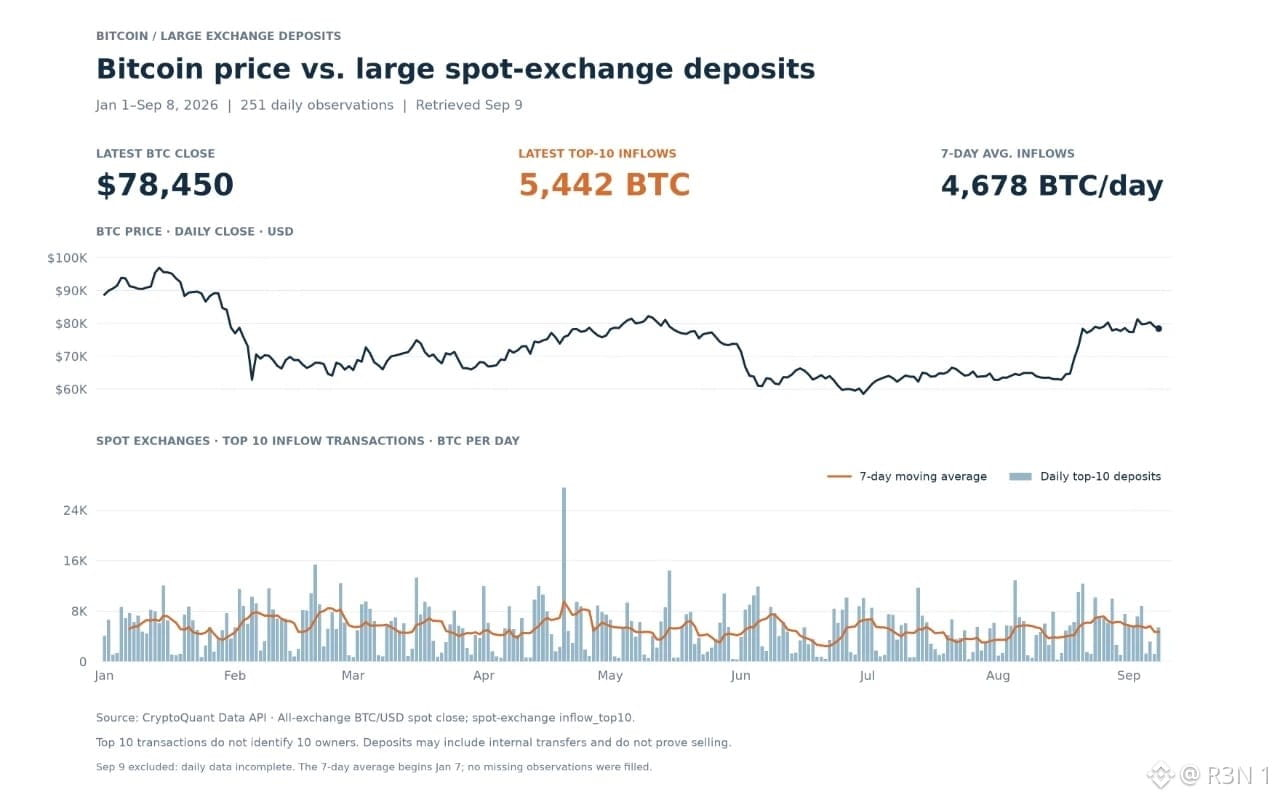
Bitcoin closed at $78,450 on September 8, well off the $60,000 area it was sitting at earlier this summer. The obvious question with any recovery this size is whether large holders are quietly using the strength to sell into exchanges. Right now the data doesn't really support that story.
Top 10 spot exchange inflows hit 5,442 BTC on September 8, a number that looks dramatic on the surface, 4.4 times the previous day's level. But context matters more than the day over day multiple here. That same figure was only 5.1% above the preceding 30 day average, and the seven day average sits at 4,678 BTC, still below several peaks recorded earlier this year. A 4.4x daily jump sounds alarming until you realize the prior day was simply unusually quiet, not that this one was unusually loud.
My honest read: this looks like large deposit activity reverting toward its recent normal range rather than any kind of distribution signal. If big holders were using this rally to offload meaningfully, you'd expect inflows pushing well above trend, not just back in line with the 30 day average. That's a real distinction, not a technicality.
Where I'd push back on getting too comfortable with this: one day's data reverting to the mean doesn't rule out selling pressure building gradually. The actual test isn't a single elevated print, it's whether the seven day average starts climbing persistently, especially if that climb happens alongside price weakness rather than strength. That combination would be the real warning sign, a single bounce back toward recent norms isn't.
If the seven day inflow average holds near current levels or starts trending higher over the next week or two, and whether any rise in that average lines up with price holding or price breaking down.
#BTC Price Analysis# $BTC #Meme Alpha# #Macro Insights#
Top 10 spot exchange inflows hit 5,442 BTC on September 8, a number that looks dramatic on the surface, 4.4 times the previous day's level. But context matters more than the day over day multiple here. That same figure was only 5.1% above the preceding 30 day average, and the seven day average sits at 4,678 BTC, still below several peaks recorded earlier this year. A 4.4x daily jump sounds alarming until you realize the prior day was simply unusually quiet, not that this one was unusually loud.
My honest read: this looks like large deposit activity reverting toward its recent normal range rather than any kind of distribution signal. If big holders were using this rally to offload meaningfully, you'd expect inflows pushing well above trend, not just back in line with the 30 day average. That's a real distinction, not a technicality.
Where I'd push back on getting too comfortable with this: one day's data reverting to the mean doesn't rule out selling pressure building gradually. The actual test isn't a single elevated print, it's whether the seven day average starts climbing persistently, especially if that climb happens alongside price weakness rather than strength. That combination would be the real warning sign, a single bounce back toward recent norms isn't.
If the seven day inflow average holds near current levels or starts trending higher over the next week or two, and whether any rise in that average lines up with price holding or price breaking down.
#BTC Price Analysis# $BTC #Meme Alpha# #Macro Insights#