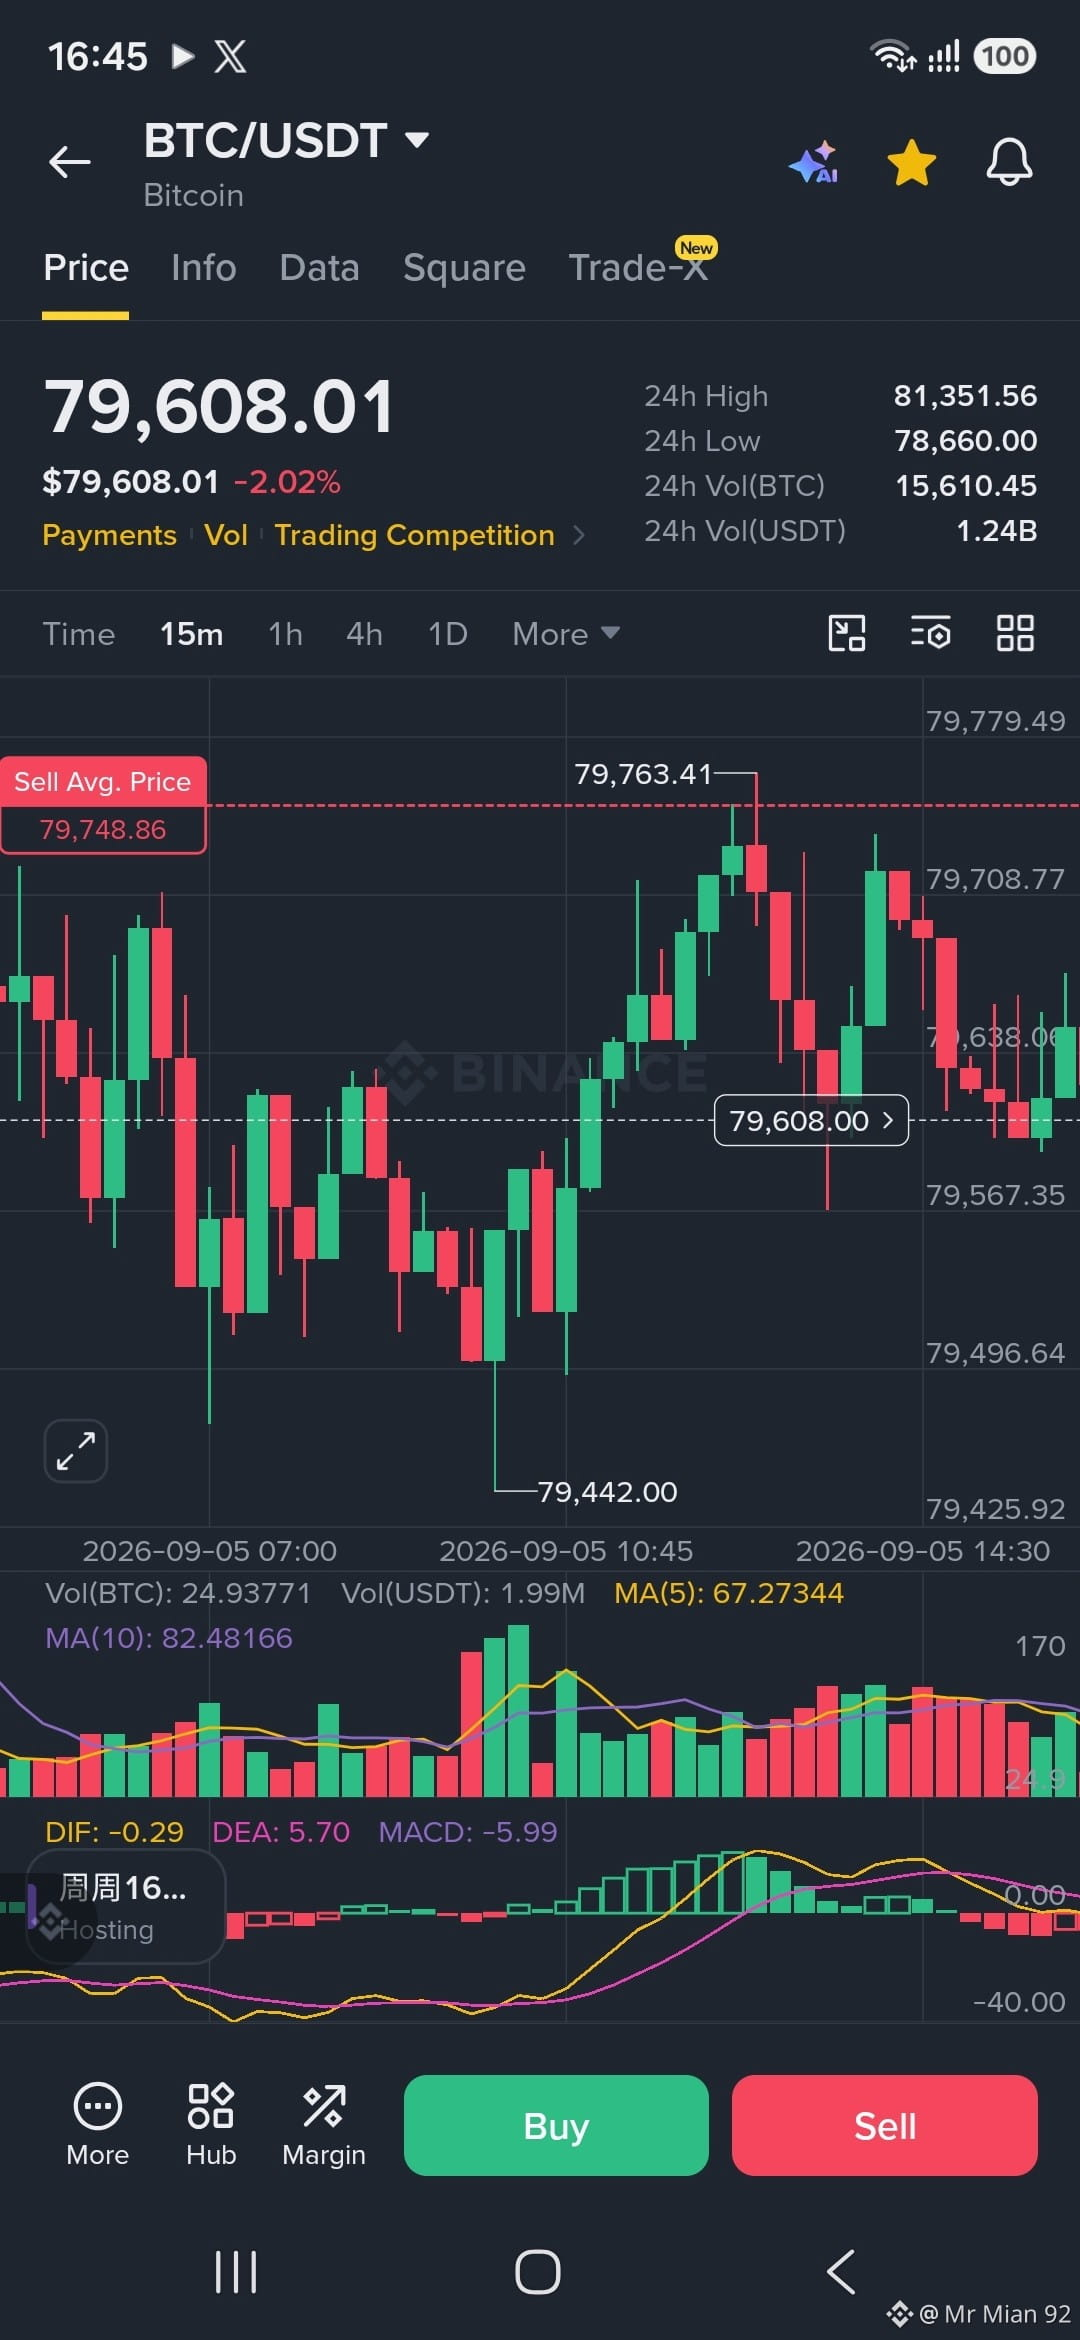
I initially thought the last rebound would stop around 85k-90k then pull back, but after nearly a week if consolidation, this level might shift upwards.
The longer it considering within this range, the more stable it becomes; the faster it rises, the more wary we should be of a sharp drop and pullback.Your observation captures a core principle of market structure: consolidation builds structure, while parabolic rallies build fragile leverage.
When price action absorbs sell pressure without pulling back as initially expected, the fundamental mechanics beneath the chart shift from a routine relief bounce to a structured re-accumulation range.
Key Market Mechanics at Play
1. Range Stability vs. Parabolic Liquidation Risk
Extended Consolidation: The longer the market trades within a high-tier consolidation belt (such as the $80,000–$85,000 range), the more orders change hands. Short positions taken at the lower boundaries get squeezed out or forced to cover, while spot buyers absorb overhead profit-taking. This raises the average cost basis for market participants, turning a historical resistance zone into concrete structural support.
Rapid Expansion Hazard: A rapid vertical surge toward $90,000 creates a void in order book depth. High speed is typically powered by over-leveraged long positions rather than spot accumulation. When liquidations trigger or profit-taking begins at major psychological resistance, the lack of resting buy orders below often results in a steep, violent retracement.
2. The Mechanics of a Level Shift
Initial projections often treat overhead liquidity ($85k–$90k) as a firm cap. However, several signals indicate when a consolidation range is preparing to shift upward:
The longer it considering within this range, the more stable it becomes; the faster it rises, the more wary we should be of a sharp drop and pullback.Your observation captures a core principle of market structure: consolidation builds structure, while parabolic rallies build fragile leverage.
When price action absorbs sell pressure without pulling back as initially expected, the fundamental mechanics beneath the chart shift from a routine relief bounce to a structured re-accumulation range.
Key Market Mechanics at Play
1. Range Stability vs. Parabolic Liquidation Risk
Extended Consolidation: The longer the market trades within a high-tier consolidation belt (such as the $80,000–$85,000 range), the more orders change hands. Short positions taken at the lower boundaries get squeezed out or forced to cover, while spot buyers absorb overhead profit-taking. This raises the average cost basis for market participants, turning a historical resistance zone into concrete structural support.
Rapid Expansion Hazard: A rapid vertical surge toward $90,000 creates a void in order book depth. High speed is typically powered by over-leveraged long positions rather than spot accumulation. When liquidations trigger or profit-taking begins at major psychological resistance, the lack of resting buy orders below often results in a steep, violent retracement.
2. The Mechanics of a Level Shift
Initial projections often treat overhead liquidity ($85k–$90k) as a firm cap. However, several signals indicate when a consolidation range is preparing to shift upward: