Technical Breakdown: The Setup for a Drop
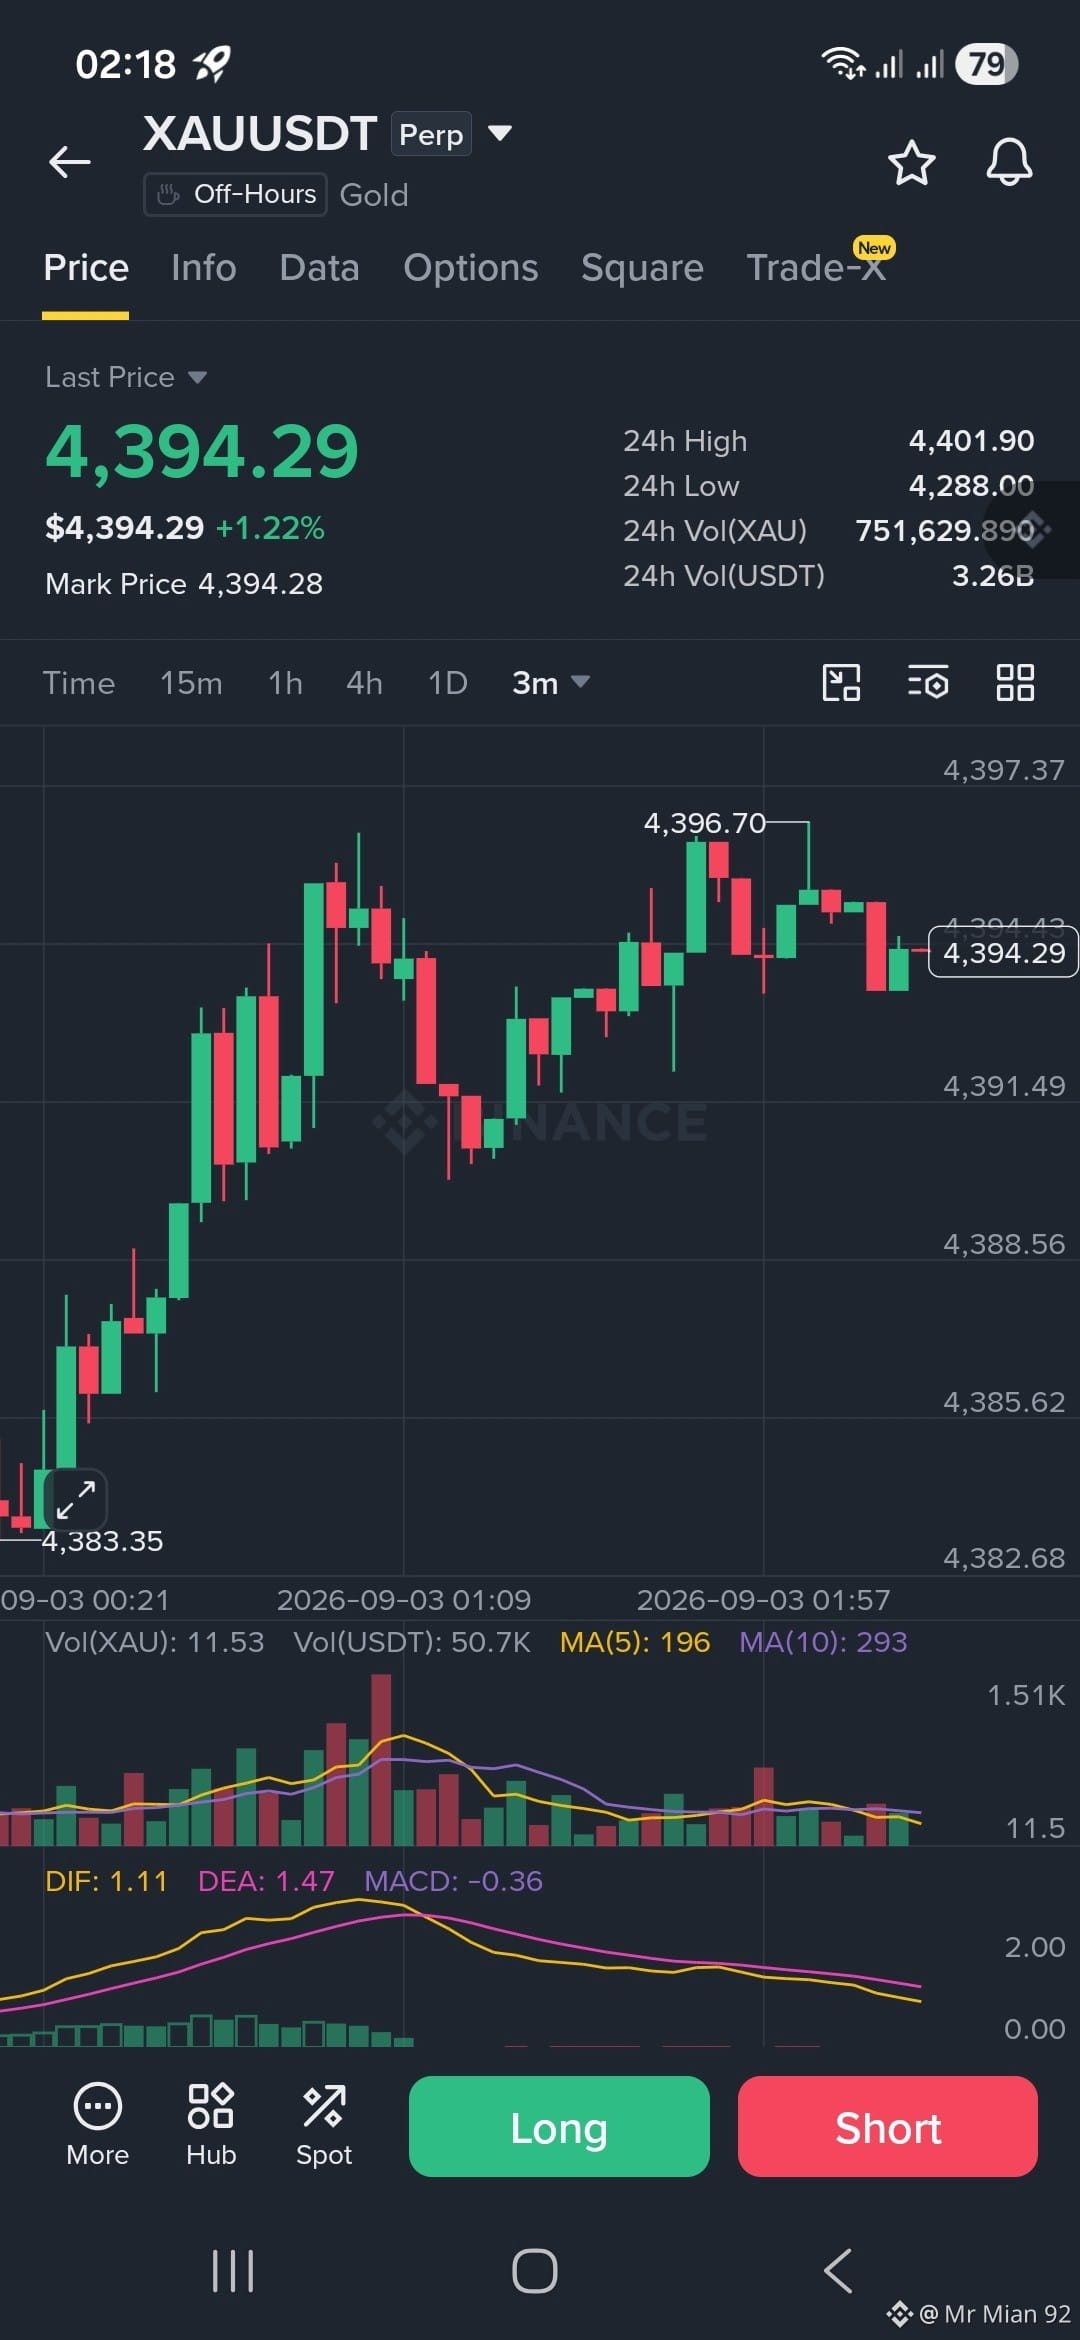
Volume Dry-Up (The "Chick" Volume): The volume histogram at the bottom shows a significant decrease in buying pressure after the push toward $4,396. Green volume bars are shrinking while red volume bars are quietly holding ground, signaling that aggressive buyers are running out of steam.
MACD Bearish Crossover: The MACD indicator (bottom pane) shows the DIF line (1.11) crossing below the DEA line (1.47), generating a negative MACD value (-0.36). This indicates a weakening bullish momentum and signals a potential downward shift.
Top-Heavy Structure: Price made a lower high around 4,394.29 right after the 4,396.70 peak. The quick succession of red candles indicates profit-taking and aggressive short entries walling off higher levels.
Volume Dry-Up (The "Chick" Volume): The volume histogram at the bottom shows a significant decrease in buying pressure after the push toward $4,396. Green volume bars are shrinking while red volume bars are quietly holding ground, signaling that aggressive buyers are running out of steam.
MACD Bearish Crossover: The MACD indicator (bottom pane) shows the DIF line (1.11) crossing below the DEA line (1.47), generating a negative MACD value (-0.36). This indicates a weakening bullish momentum and signals a potential downward shift.
Top-Heavy Structure: Price made a lower high around 4,394.29 right after the 4,396.70 peak. The quick succession of red candles indicates profit-taking and aggressive short entries walling off higher levels.