
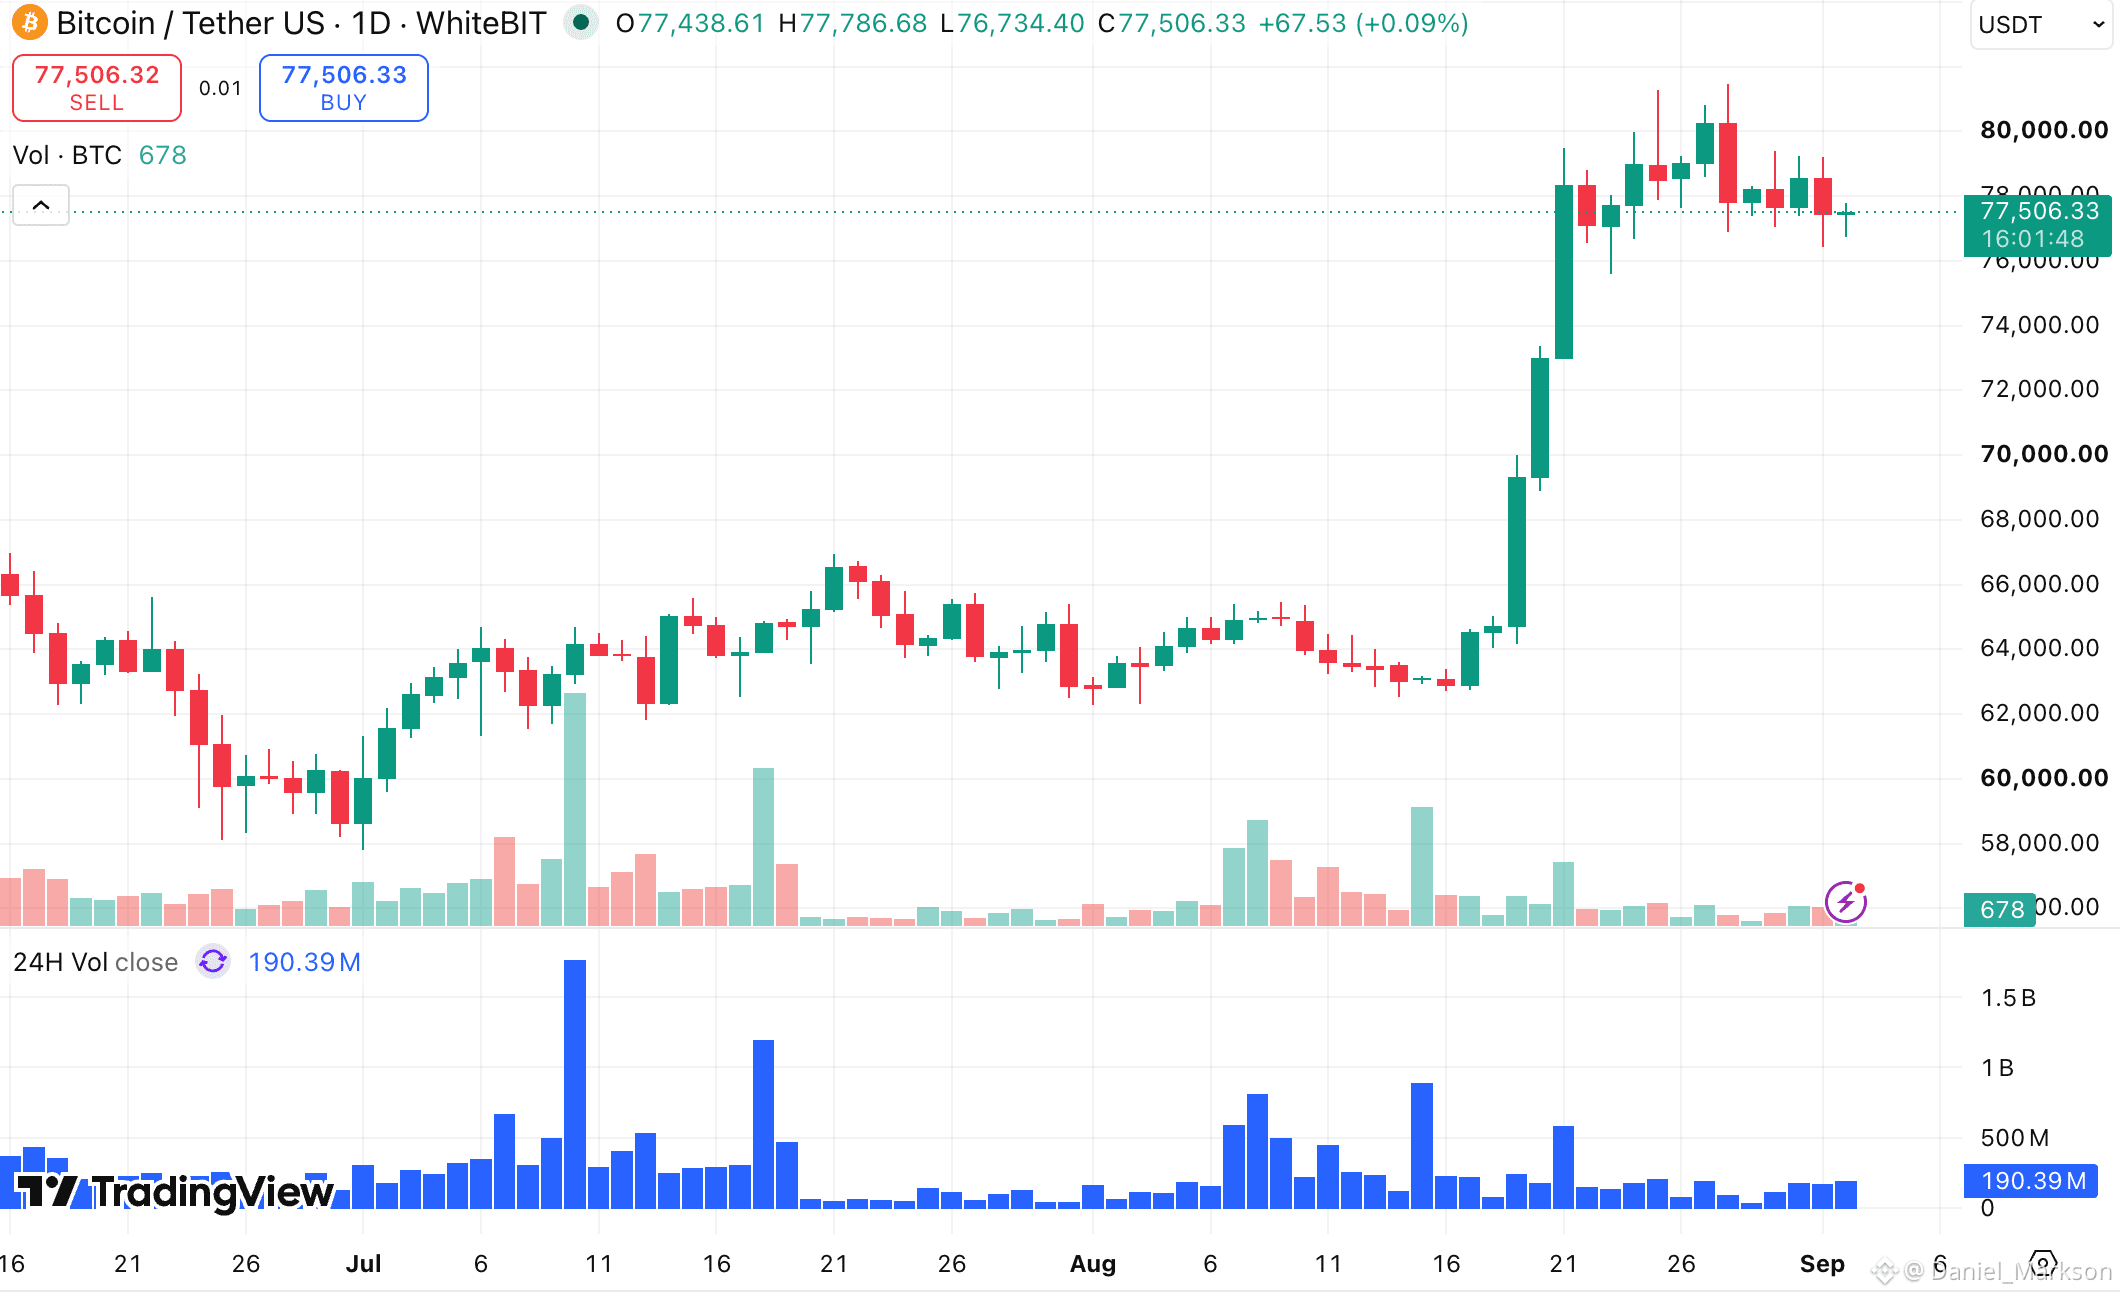
$BTC forming a Bart Simpson pattern? Here’s what the data really says 👇 After an explosive 25% surge in August that pushed BTC past $80,000, Bitcoin is cooling down around $77,200. Traders on the 4-hour chart are flagging a classic "Bart Simpson" formation - a sharp spike, sideways consolidation, and a potential snap-back lower. 📉 Is a deeper correction inevitable? Not so fast. 🛑 The critical line in the sand is $75,800. If buyers hold this level, the bearish pattern invalidates, clearing a path for a retest of $83,000. But if $75,800 breaks, we could see further downside. Behind the chart patterns, fundamental flows tell the real story: • Spot demand turned negative for two straight days, meaning derivative futures are doing all the heavy lifting. As analysts note: no spot demand = no sustained bull rally. • Long-term holders are taking profits - 30-day distribution jumped over 61% in late August to 281,900 BTC, the highest level of 2026! 📊 With key Fed rate signals and macro labor data dropping this week, the big question is whether fresh buyer demand can absorb this long-term supply. #BTC Price Analysis# #Bitcoin Price Prediction: What is Bitcoins next move?#

Veröffentlichen

Haftungsausschluss: Enthält Meinungen von Drittanbietern. Keine Beratung. Binance AI wird ohne Gewähr bereitgestellt. Siehe AGB.