
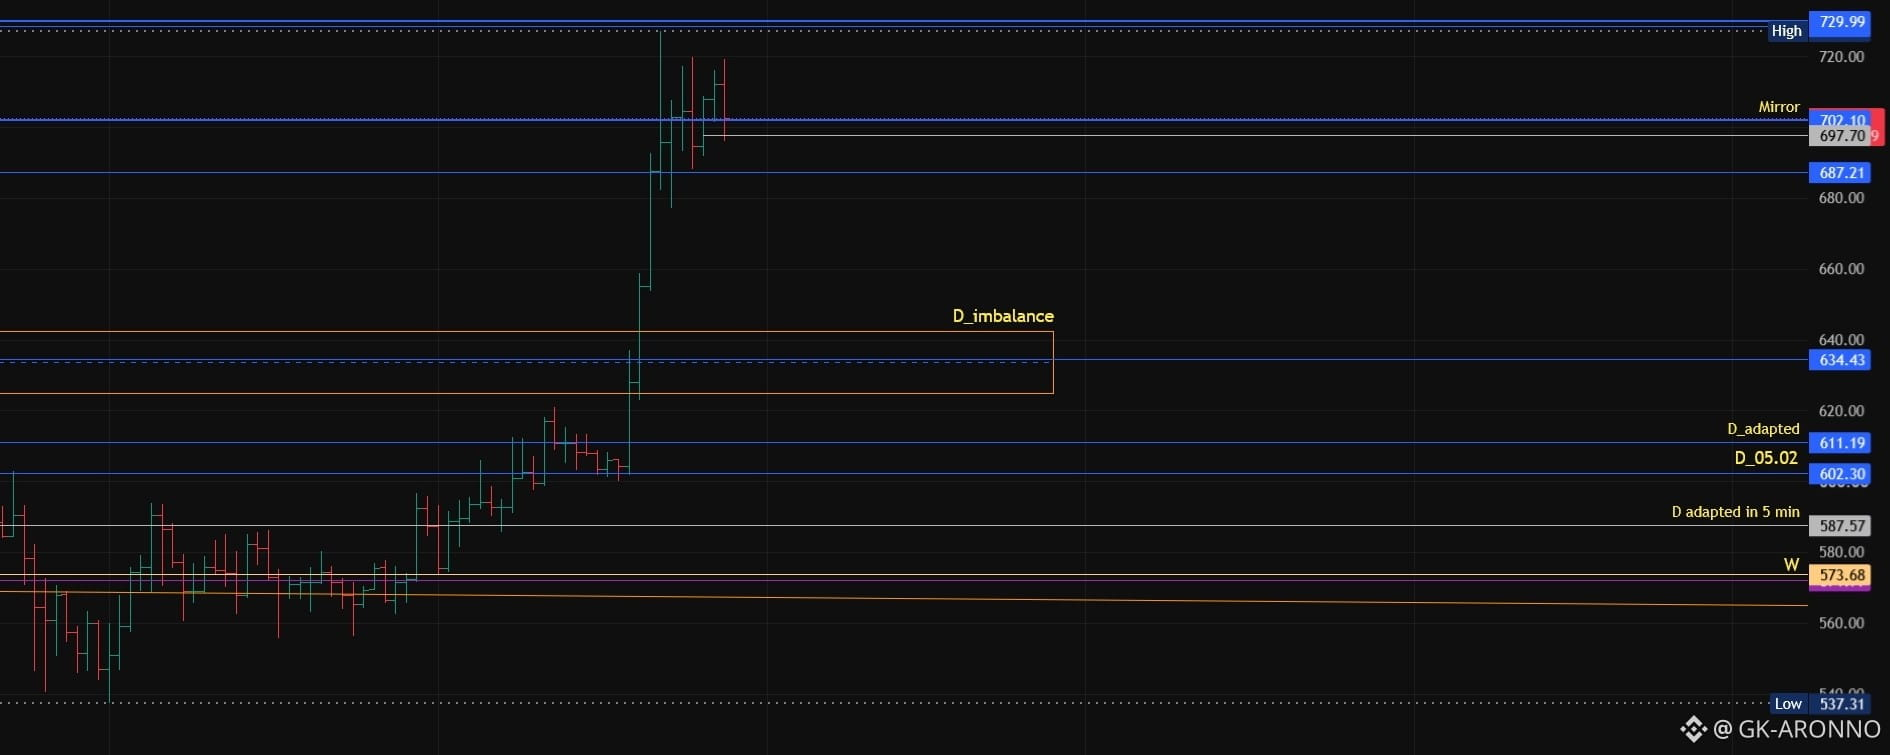


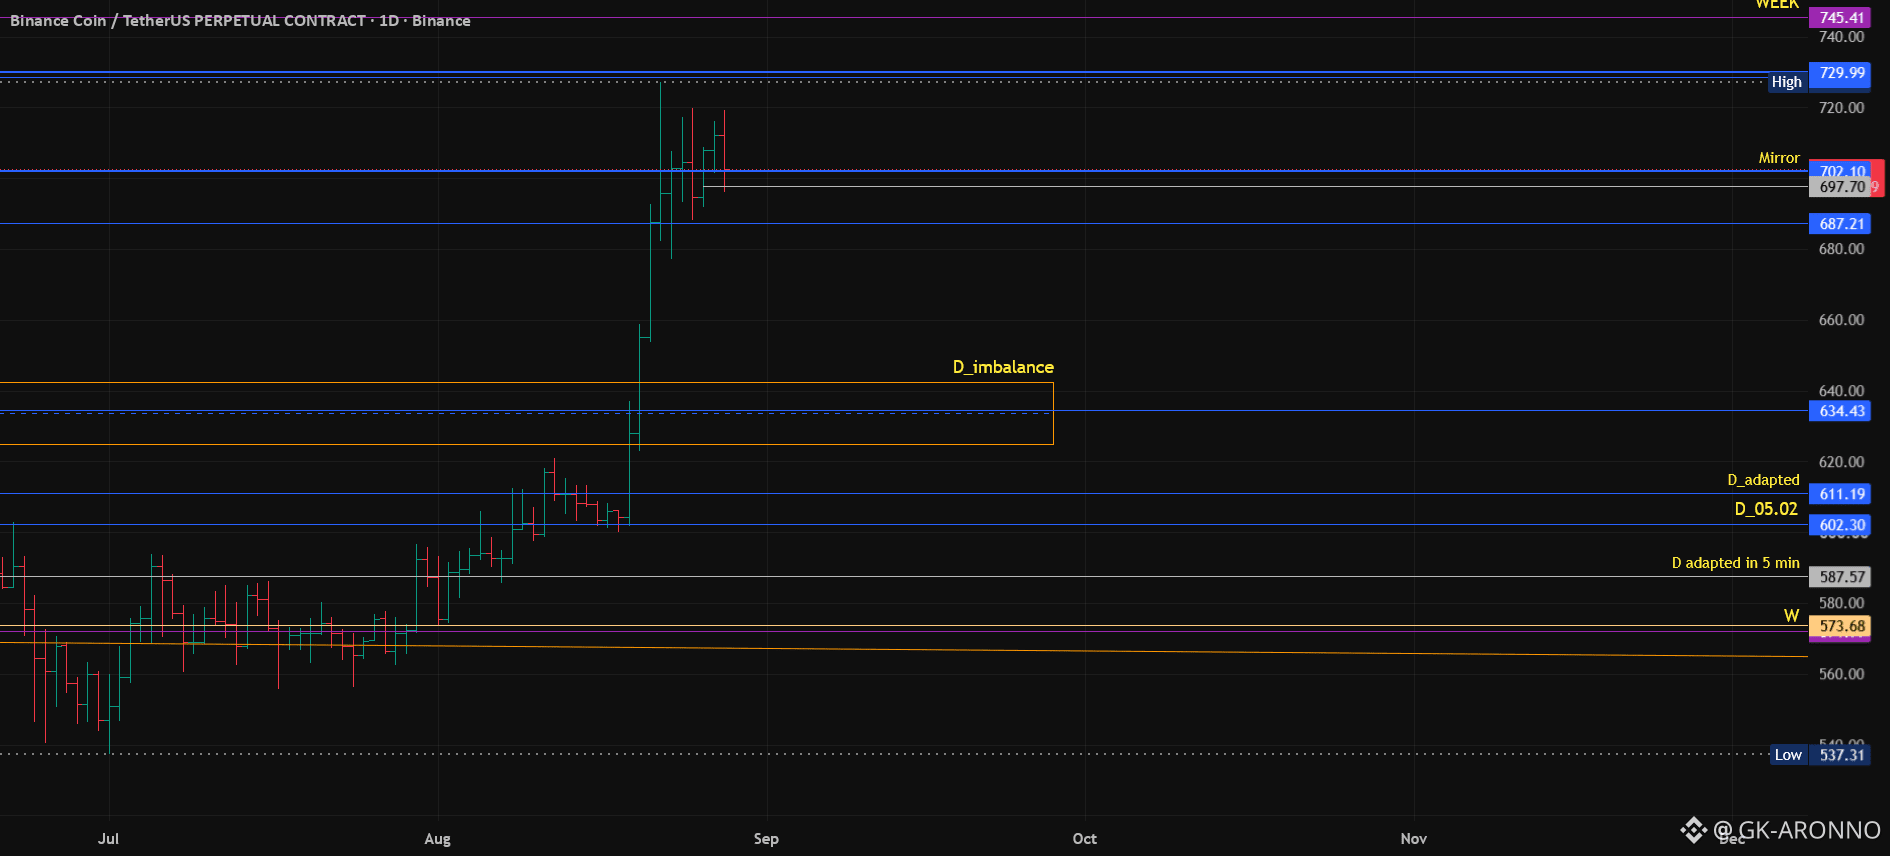
BNB has shown a strong impulsive move from the $600 area to approximately $726 in just a few daily candles. After such an aggressive move, the current price action looks like a pause rather than a clear reversal.
The structure can be read as a potential bullish flag / consolidation after impulse, especially while price holds above the $702–706 mirror zone.
Key levels I am watching:
Support: $702–706
Deeper support: $687
Resistance: $729–730
Next liquidity zone: $745 weekly high
Bullish scenario:
If BNB continues to hold above $702 and breaks through $720–730, the next logical target is the $745 weekly high. A clean daily close above $730 would strengthen the continuation setup.
Bearish scenario:
If price loses $702 on a daily close, the bullish flag idea becomes weaker. In that case, I would expect a pullback toward $687 first, and if that level fails, a deeper correction toward the $634–640 imbalance zone becomes possible.
My current bias:
Moderately bullish while BNB holds above $702, but confirmation is still needed. The best signal would be acceptance above $730.
This is not a place to chase blindly. The setup is interesting, but the market needs to prove continuation.
Not financial advice. Technical analysis only.
