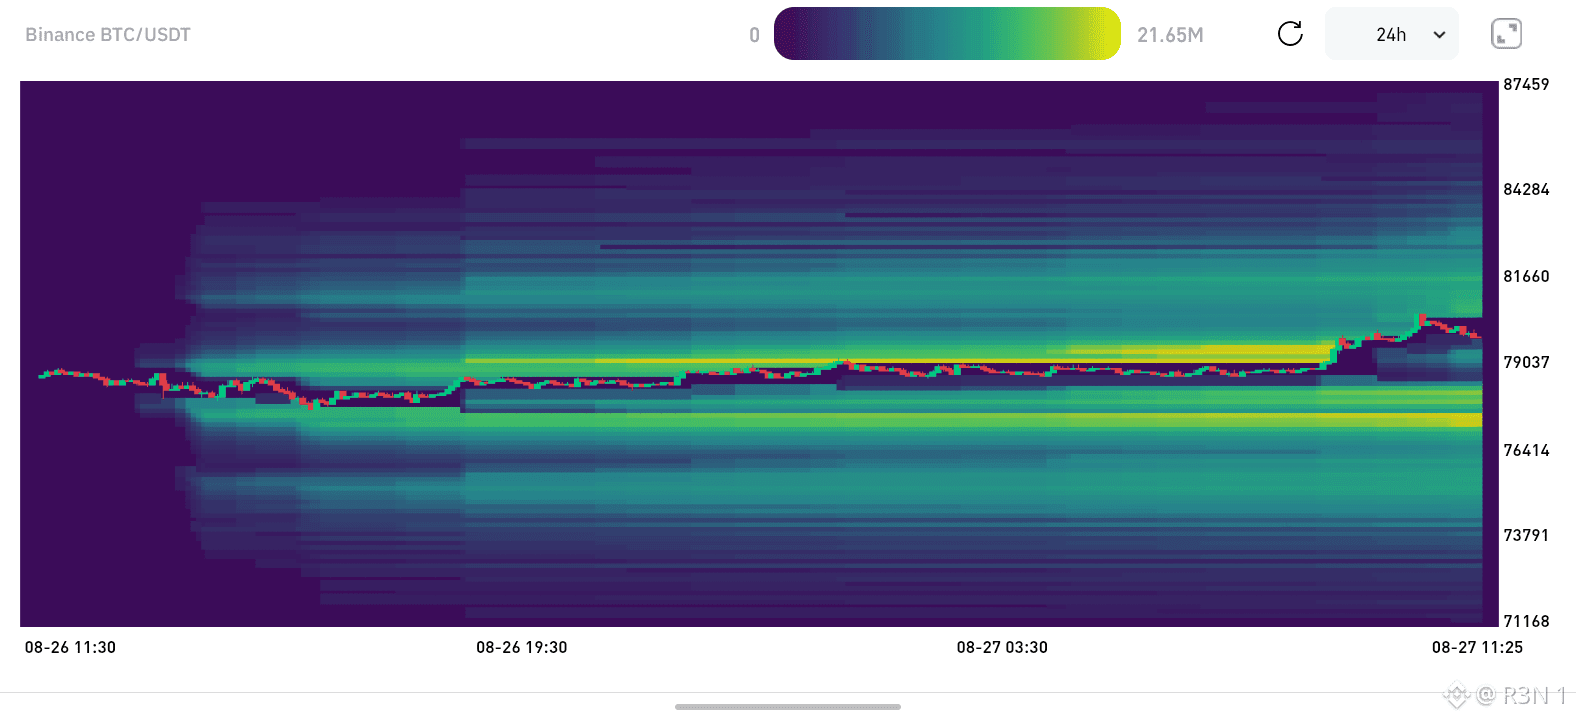
BTC's liquidation heatmap on Binance is showing something worth reading carefully before this next move gets called one thing or the other.
There are two bright bands sitting on this chart, and their position relative to price is the actual signal. One's been sitting just above price, roughly $79,000 to $79,500, glowing consistently since late yesterday while BTC ground sideways underneath it for most of the session. A second, dimmer band sits below current price, around $76,400 to $77,000, still visible but less intense. Yellow on these maps means concentrated leveraged positioning, the model's estimate of where stops and liquidation levels are clustering based on exchange data.
In the last hour of this window, price actually pushed straight through that upper band, running from around $79,000 toward $81,000+, right through the zone that had been sitting there glowing the entire day. That's the pattern you'd expect from a short squeeze. Price grinds under a dense cluster of resistance-side positioning, then breaks through and accelerates as those positions get forced to cover, adding fuel to the move rather than stopping it.
Worth being upfront that this is a probability weighted estimate, not an actual order book. It's the model's read on where stops are likely clustering based on leverage assumptions across the market, not a confirmed ledger of real positions, and actual liquidation levels can land lower than what the heatmap implies.
The band worth watching next is the lower one, $76,400 to $77,000. If this move pulls back at all, that's where the model's flagging remaining leveraged interest still sitting below current price, and how price behaves around that zone on any retrace is a better tell than anything happening at new highs right now.
$BTC #BTC Price Analysis# #Altcoin Season# #Meme Alpha#
There are two bright bands sitting on this chart, and their position relative to price is the actual signal. One's been sitting just above price, roughly $79,000 to $79,500, glowing consistently since late yesterday while BTC ground sideways underneath it for most of the session. A second, dimmer band sits below current price, around $76,400 to $77,000, still visible but less intense. Yellow on these maps means concentrated leveraged positioning, the model's estimate of where stops and liquidation levels are clustering based on exchange data.
In the last hour of this window, price actually pushed straight through that upper band, running from around $79,000 toward $81,000+, right through the zone that had been sitting there glowing the entire day. That's the pattern you'd expect from a short squeeze. Price grinds under a dense cluster of resistance-side positioning, then breaks through and accelerates as those positions get forced to cover, adding fuel to the move rather than stopping it.
Worth being upfront that this is a probability weighted estimate, not an actual order book. It's the model's read on where stops are likely clustering based on leverage assumptions across the market, not a confirmed ledger of real positions, and actual liquidation levels can land lower than what the heatmap implies.
The band worth watching next is the lower one, $76,400 to $77,000. If this move pulls back at all, that's where the model's flagging remaining leveraged interest still sitting below current price, and how price behaves around that zone on any retrace is a better tell than anything happening at new highs right now.
$BTC #BTC Price Analysis# #Altcoin Season# #Meme Alpha#