
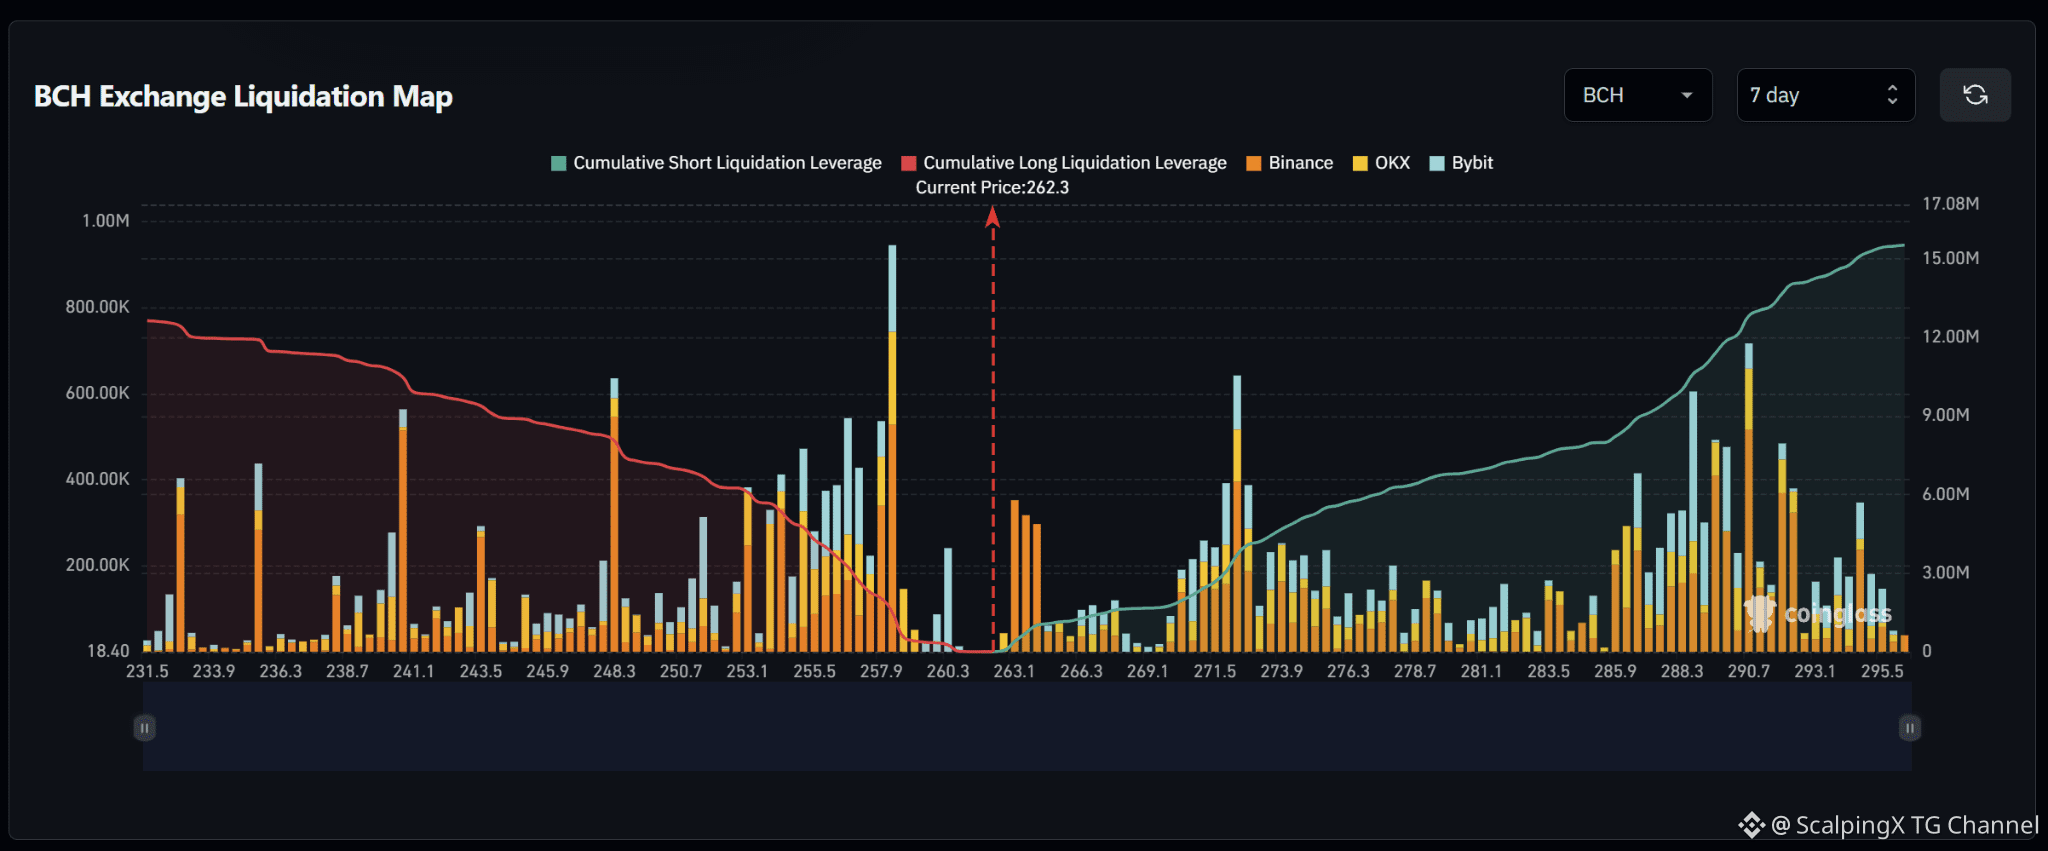
$BCH – Liquidation Map (7 Days) – Current Price 262.3 🔎 The 7-day liquidation map shows roughly $15–16 million in short liquidations above the current price, exceeding approximately $12–13 million in long liquidations below. The overall structure therefore modestly favors the upside, with sizable short-liquidation liquidity concentrated both near and well above the market. 📉 Below the market, nearby long-liquidation liquidity is concentrated around 260.3–257.9, with 257.9 standing out as the strongest nearby cluster. Additional liquidity remains dense across 255.5–253.1. Losing 260.3 would increase the probability of a sweep toward 257.9–255.5. 📈 Above the market, short-liquidation liquidity begins building from 263.1 and increases through 266.3–271.5. A notable nearby cluster sits around 271.5–273.9, while the strongest concentration further out appears across 285.9–293.1, particularly near 290.7. A break above 263.1 would bring 266.3–271.5 into focus. 🧭 The broader setup modestly favors the upside because short-liquidation exposure above is roughly 1.2 times larger. Breaking 263.1 would increase the probability of a sweep toward 266.3–271.5, while losing 260.3 would shift attention toward 257.9–255.5. #LiquidationMap

Veröffentlichen
Haftungsausschluss: Enthält Meinungen von Drittanbietern. Keine Beratung. Binance AI wird ohne Gewähr bereitgestellt. Siehe AGB.