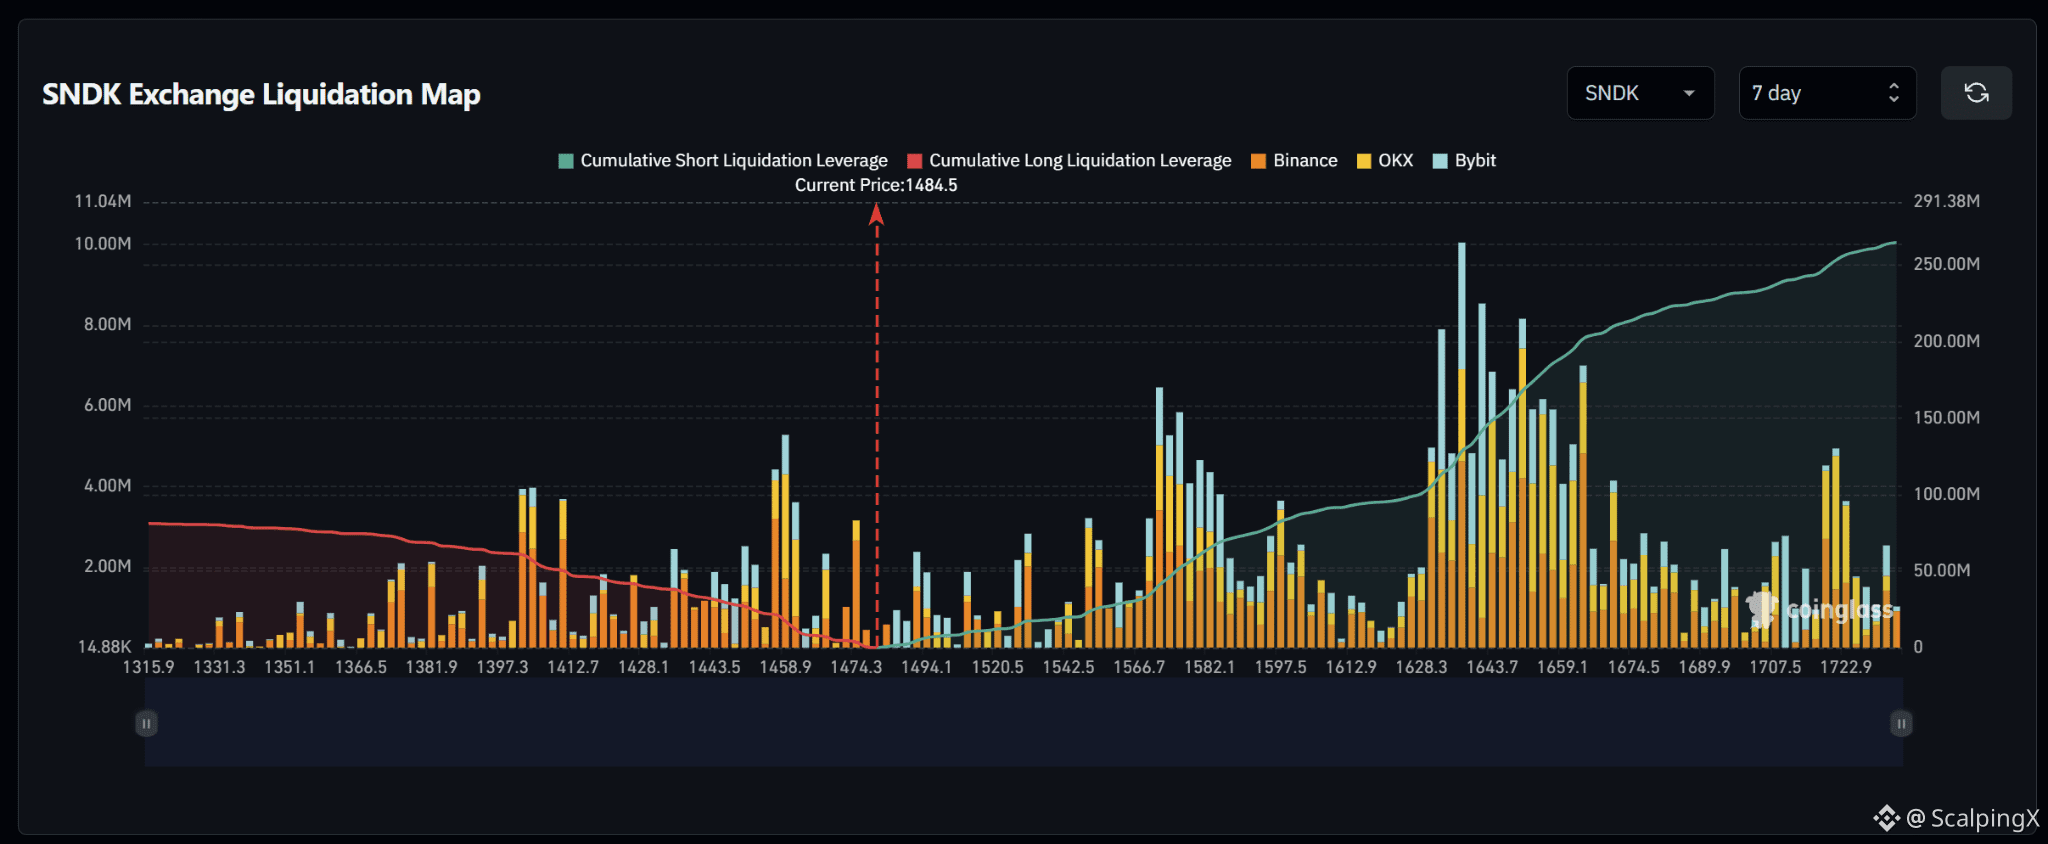
$SNDKB – Liquidation Map (7 Days) – Current Price 1,484.5
🔎 The 7-day liquidation map shows roughly $250 million in short liquidations above the current price, far exceeding approximately $75–80 million in long liquidations below. The liquidity structure therefore leans strongly to the upside, with most major liquidity concentrated at higher price levels.
📉 Below the market, nearby long-liquidation liquidity is concentrated around 1,474–1,459 before becoming denser across 1,444–1,413. The strongest nearby cluster sits around 1,459, while meaningful liquidity also remains deeper around 1,397–1,413. Losing 1,474 would increase the probability of a sweep toward 1,459–1,444.
📈 Above the market, short-liquidation liquidity begins building around 1,494–1,521 and strengthens across 1,543–1,598. The largest concentration sits further out around 1,628–1,660, particularly near 1,635–1,645 where the biggest liquidation bars on the map appear. A break above 1,494 would bring 1,521–1,543 into focus.
🧭 The broader setup strongly favors the upside because short-liquidation exposure above is roughly three times larger. Breaking 1,494 would increase the probability of a sweep toward 1,521–1,543, while losing 1,474 would shift attention toward 1,459–1,444.
#LiquidationMap
🔎 The 7-day liquidation map shows roughly $250 million in short liquidations above the current price, far exceeding approximately $75–80 million in long liquidations below. The liquidity structure therefore leans strongly to the upside, with most major liquidity concentrated at higher price levels.
📉 Below the market, nearby long-liquidation liquidity is concentrated around 1,474–1,459 before becoming denser across 1,444–1,413. The strongest nearby cluster sits around 1,459, while meaningful liquidity also remains deeper around 1,397–1,413. Losing 1,474 would increase the probability of a sweep toward 1,459–1,444.
📈 Above the market, short-liquidation liquidity begins building around 1,494–1,521 and strengthens across 1,543–1,598. The largest concentration sits further out around 1,628–1,660, particularly near 1,635–1,645 where the biggest liquidation bars on the map appear. A break above 1,494 would bring 1,521–1,543 into focus.
🧭 The broader setup strongly favors the upside because short-liquidation exposure above is roughly three times larger. Breaking 1,494 would increase the probability of a sweep toward 1,521–1,543, while losing 1,474 would shift attention toward 1,459–1,444.
#LiquidationMap