

15-Minute Chart Analysis | LA (Lagrange) Perpetual Contract (Binance) | August 23, 2026
Cross-check note: live price sources for Lagrange (LA) — CoinGecko, CoinMarketCap, MEXC, TradingView, and Binance's own regional listing pages — currently show wildly inconsistent figures spanning from roughly $0.05 to well over $0.30, clearly pulled from different dates rather than a single real-time snapshot. None could be reliably confirmed as matching this exact chart (0.05821 as of Aug 23, 13:32 UTC). Please verify the live price and current structure directly on your Binance terminal before acting — this is a name where stale data could badly mislead a trade decision.
The Setup
LA/USDT has been through a familiar pattern for this market lately: a strong, structured rally followed by a sharp reversal, and now a patient rebuild.
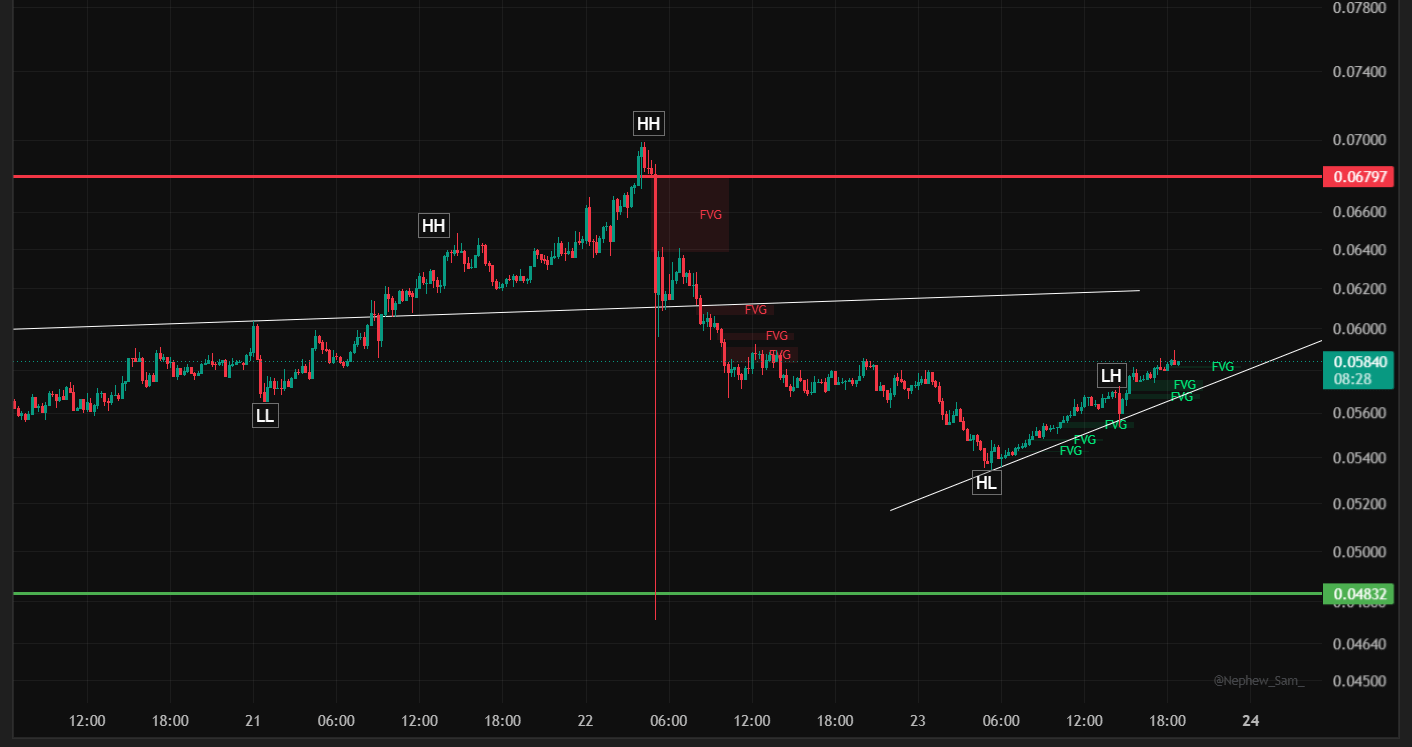
The rally: Price advanced along a clean rising trendline, printing two consecutive Higher Highs — the first near 0.0640, the second, larger one reaching 0.06797 — the current key resistance on this chart.
The reversal: From that high, LA reversed hard, breaking down through a stack of Fair Value Gaps (FVGs) and giving back a large portion of the rally in a short window, eventually bottoming at a Higher Low around 0.0535 — well above the original base of the move, which is the one clearly bullish detail in an otherwise sharp correction.
The rebuild: Since that low, LA has climbed back through a fresh stack of FVGs along a new, shorter rising trendline, printing a Lower High around 0.0585 — essentially where price is sitting right now. Current price is 0.05821, down a slight -0.09% intraday, right at this LH resistance and testing whether the recovery can extend further.
Is LA the Next Gainer?
The ingredients for a continuation move are present but not yet confirmed: a Higher Low that held meaningfully above the original base, a new rising trendline guiding the recovery, and a series of reclaimed FVGs acting as support along the way. What's missing so far is a clean break of the LH resistance around 0.0585 — until that happens, this remains a recovery attempt rather than a confirmed new leg higher. A break there, especially on rising volume, would be the signal that LA is genuinely rebuilding toward the 0.06797 high rather than just bouncing inside a larger correction.
Key Levels on the Chart
Resistance above:
0.0585 – 0.0595 — the current Lower High and dotted-line resistance, the level to watch right now
0.0620 — the original long-term rising trendline, still overhead
0.06797 — the major high, the ultimate level that would confirm the uptrend has fully reasserted itself
Support below:
0.0570 – 0.0580 — the most recent FVG stack, first support on a shallow pullback
The newer rising trendline — currently tracking just under current price, adding confluence to the FVG zone
0.0535 — the Higher Low, the key structural level for the entire recovery
0.04832 — a much deeper support level, well below current structure
Trade Plan (Educational Framework Only)
🟢 Preferred Long Setup — Buy the FVG/Trendline Zone
Rather than chasing the current LH resistance test, the higher-probability entry is on a shallow pullback into the reclaimed FVG stack.
Entry zone: 0.0570 – 0.0580 (FVG + rising trendline confluence)
Stop loss: Below 0.0535 (a close back below the Higher Low)
Target 1: 0.0595 (LH resistance)
Target 2: 0.0620 (original trendline)
Target 3 (extended): 0.06797 (the major high, only if momentum sustains through the prior targets)
🟡 Breakout Momentum Entry
For traders wanting confirmation before committing:
Entry: A 15-minute close above 0.0595 with continuation
Stop loss: Below 0.0570
Target 1: 0.0620
Target 2: 0.06797
🔴 Invalidation
A decisive close below 0.0535 would break the current Higher Low and call the recovery into question, opening room for a retest of deeper levels with no clearly defined support until 0.04832 on this chart.
Bottom Line
LA/USDT is in the middle of rebuilding after a sharp reversal from its recent high — the Higher Low has held, a new rising trendline is guiding the recovery, but the market still needs to clear the 0.0585 – 0.0595 resistance to confirm this is a genuine continuation rather than just a bounce. Buying the FVG/trendline zone on a pullback offers a cleaner setup than chasing the current test of resistance.
⚠️ Disclaimer: This article is for educational and informational purposes only and does not constitute financial advice. Cryptocurrency trading carries significant risk, and LA/USDT — as this chart and the wildly inconsistent live pricing data both demonstrate — can be highly volatile and difficult to track in real time. Always do your own research (DYOR), verify current live pricing directly on the exchange, and manage risk according to your own financial situation before entering any trade. Past structure and technical patterns do not guarantee future price behavior.
@Binance Square Official #BitcoinStrongestWeekSinceMarch2023 #BPIUrgesFinCENExpandStablecoinIDRulesToSecondaryMarkets #AnthropicIPOCouldTopSpaceXRecordReportsSay #Binance #ChartSniper