
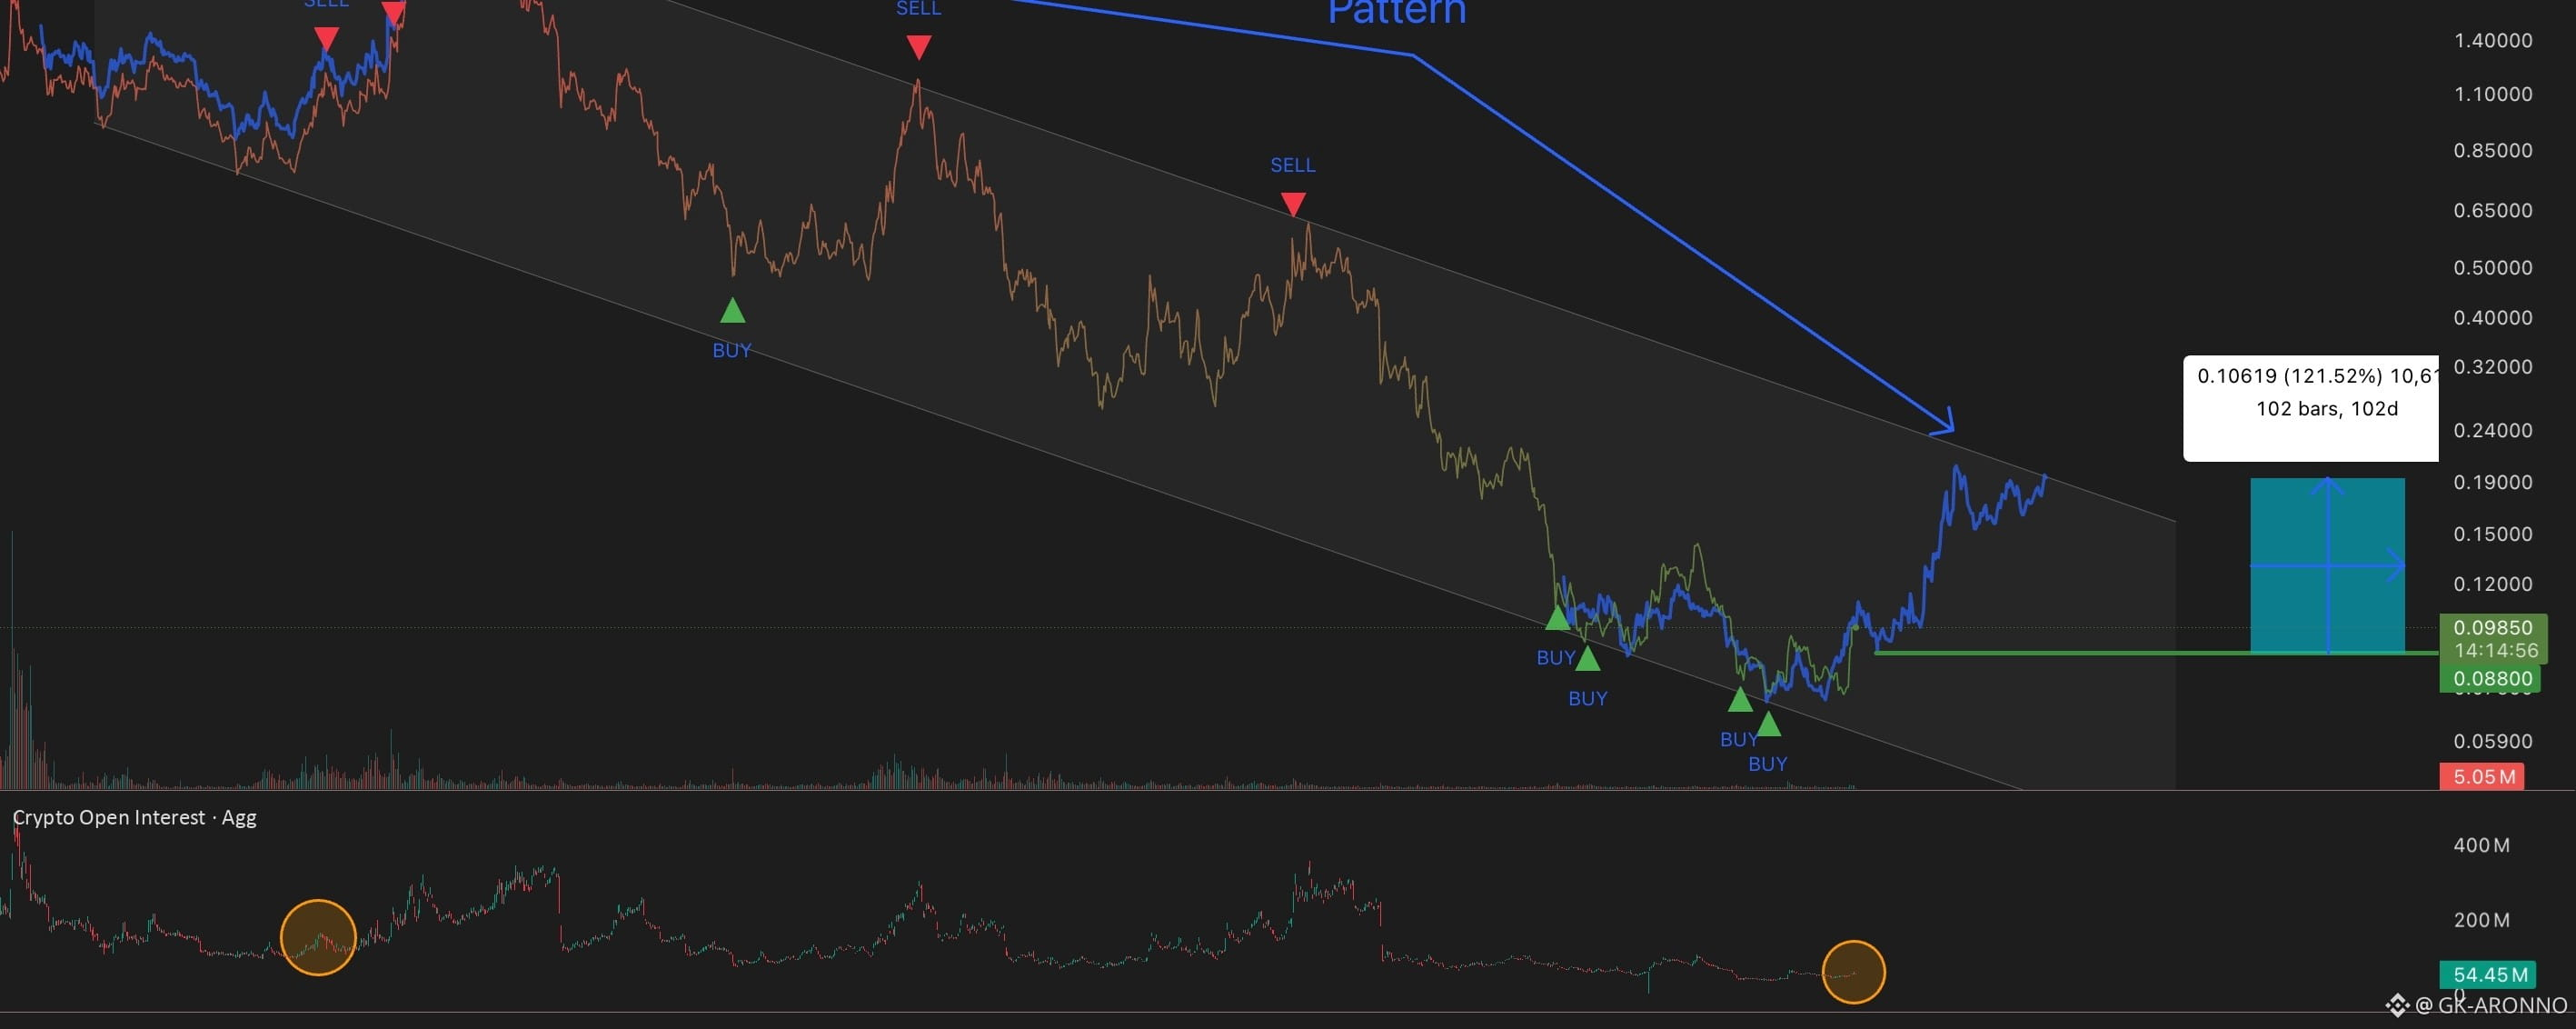


ARB | Daily
I’ve been looking at ARB and the current structure is getting very interesting.
1. Descending channel
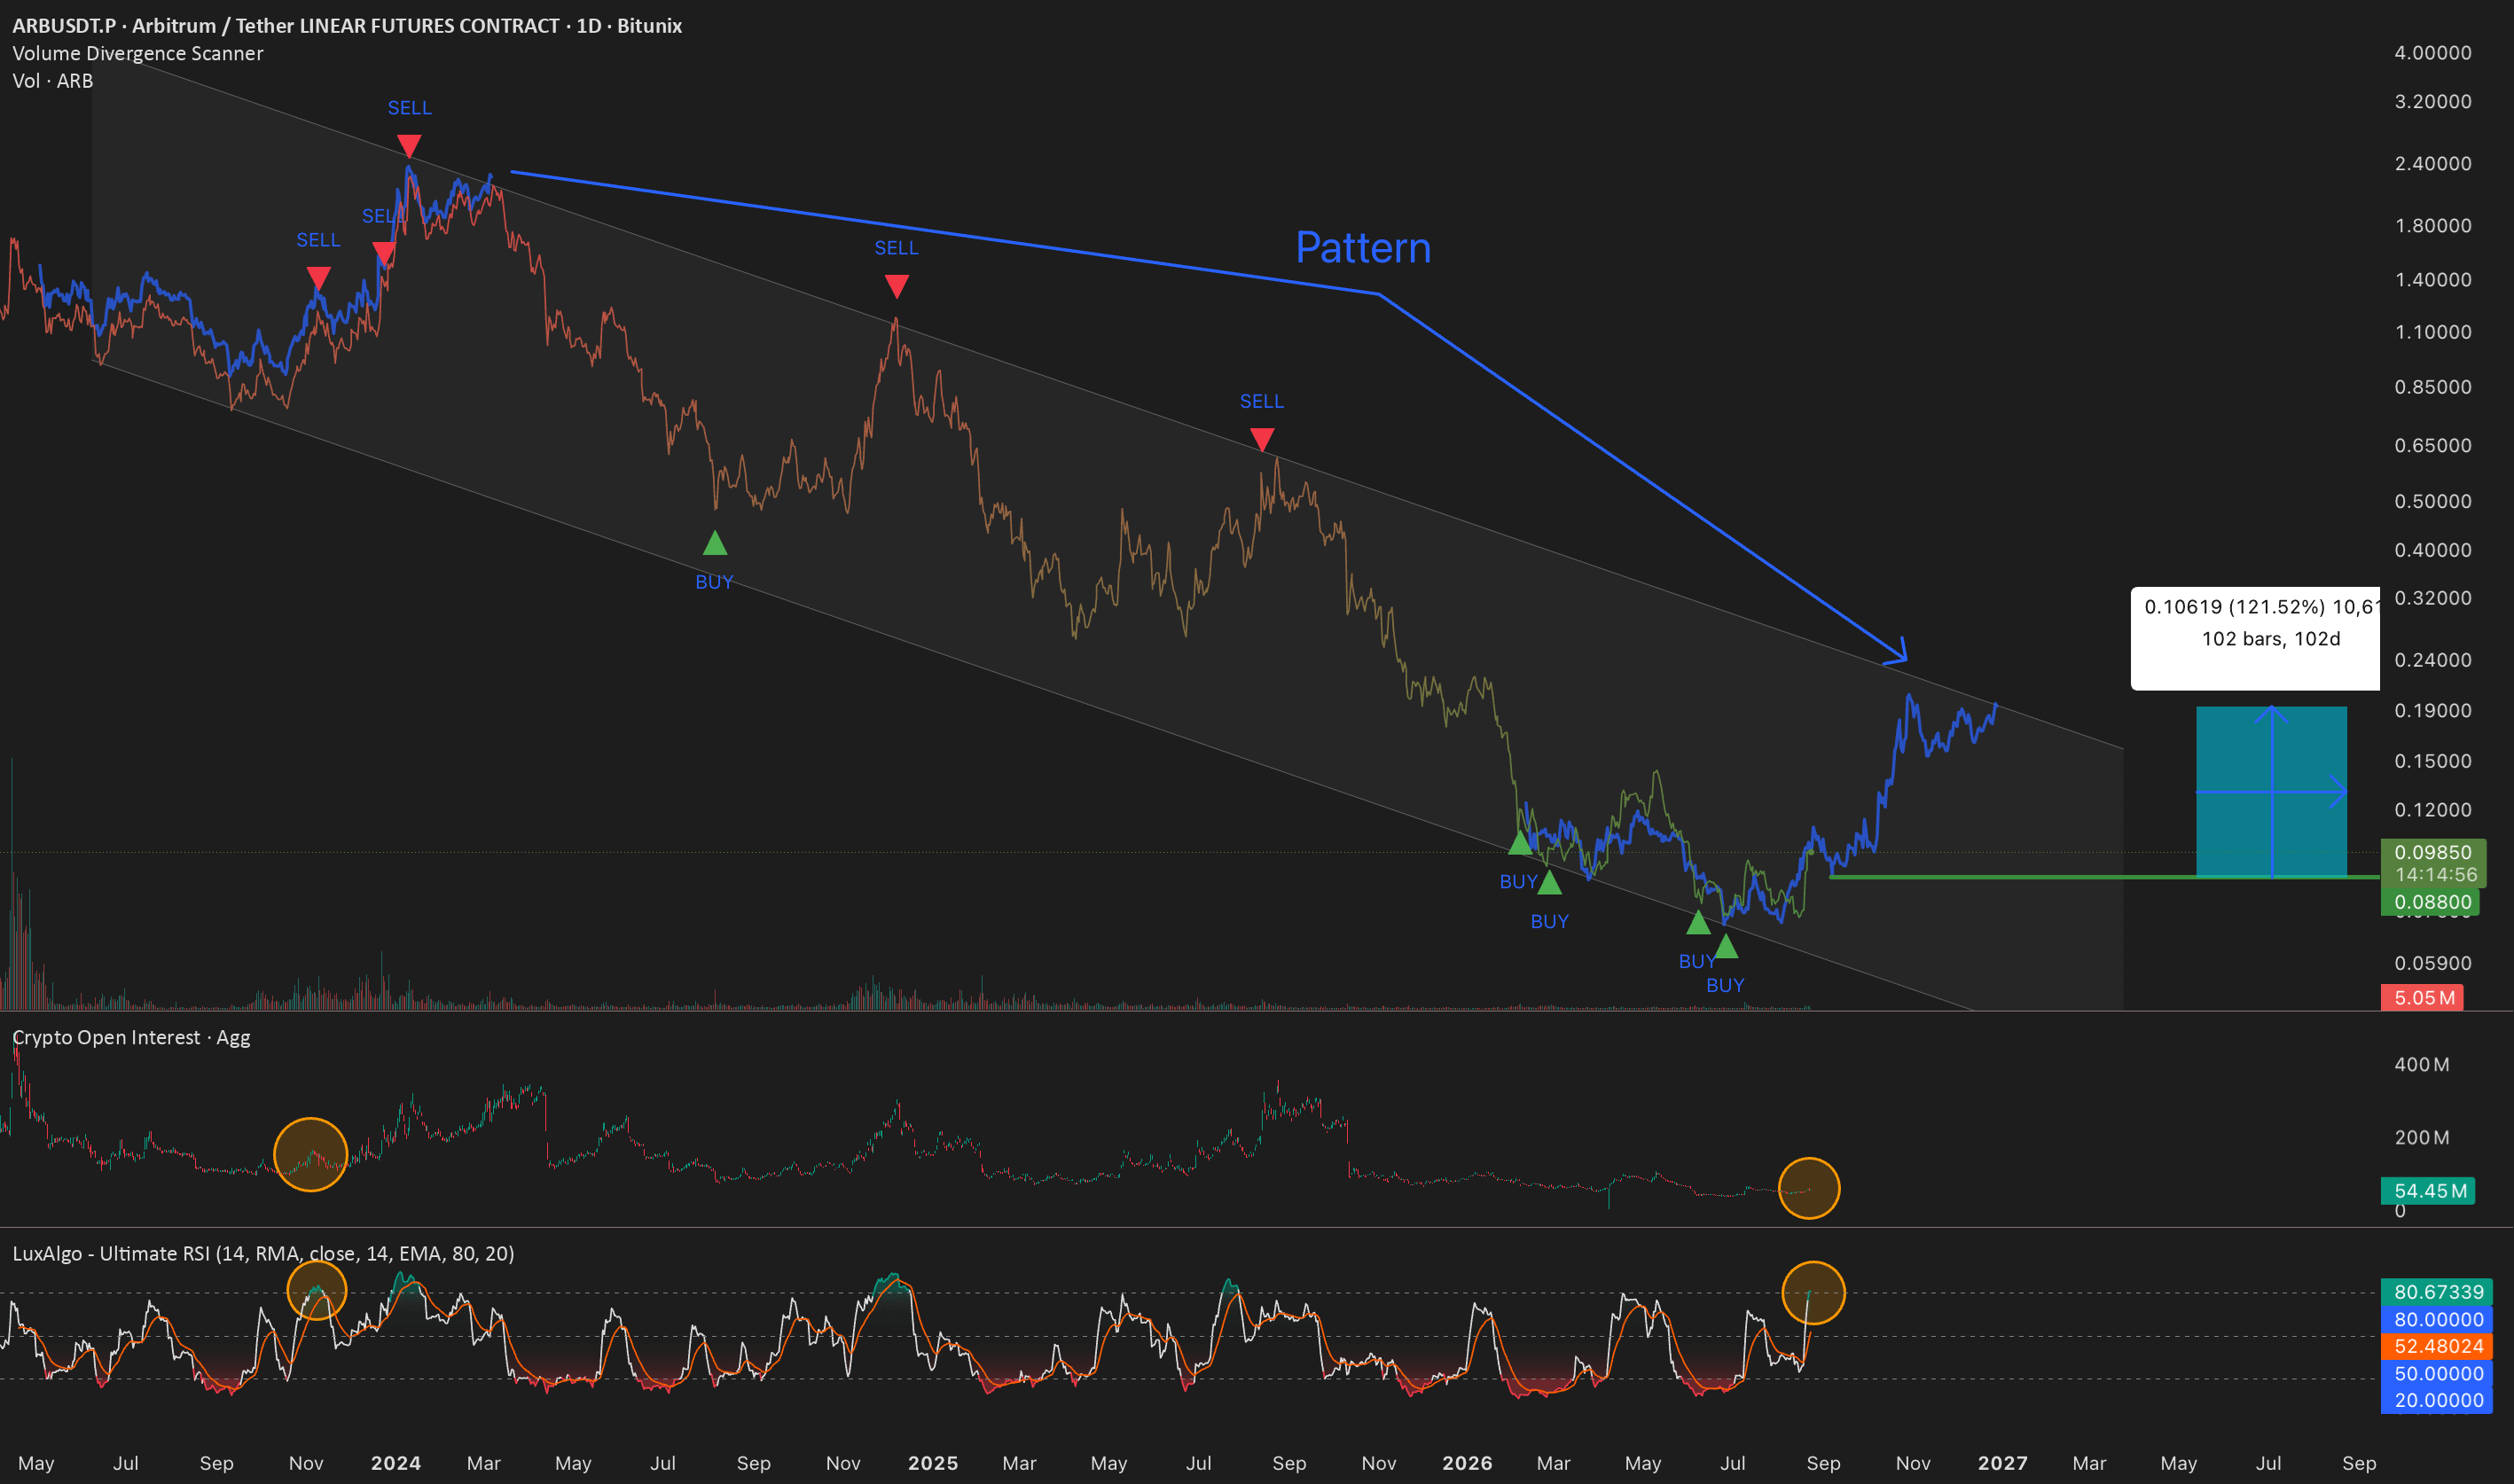
ARB has been moving inside a very clear descending channel, which has been remarkably consistent.
2. 2023 price pattern
I took the price action pattern from 2023 and projected it onto the current structure. The match with the previous movement is surprisingly close.
3. RSI
RSI is now sitting at almost exactly the same levels as it was back in 2023.
4. Open Interest
OI is slightly lower, but that’s not surprising after such a long bearish period. More importantly, we’re starting to see OI increase, just like in 2023.
5. VDS
I pushed VDS to its maximum sensitivity to find the strongest historical entries. Over the last few months, it has now triggered its 4th BUY.
Price bounced after each signal, then moved lower again. But the declines are becoming relatively minor.
That tells me something important:
ARB doesn’t seem particularly interested in falling further.
### The setup
A pullback toward $0.088, followed by a move toward the upper boundary of the channel around $0.19.
That would be roughly +120%.
Of course, there are major risks.
The broader bearish market structure is still intact, and ARB has essentially been trading in a downtrend throughout its history.
So for now, the trend still gives shorts the priority.
But when the price pattern, RSI, OI and VDS start telling a very similar story…
What if the next move is simply history repeating itself?
