
15-Minute Chart Analysis | RE Perpetual Contract (Binance) | August 21, 2026
The Setup
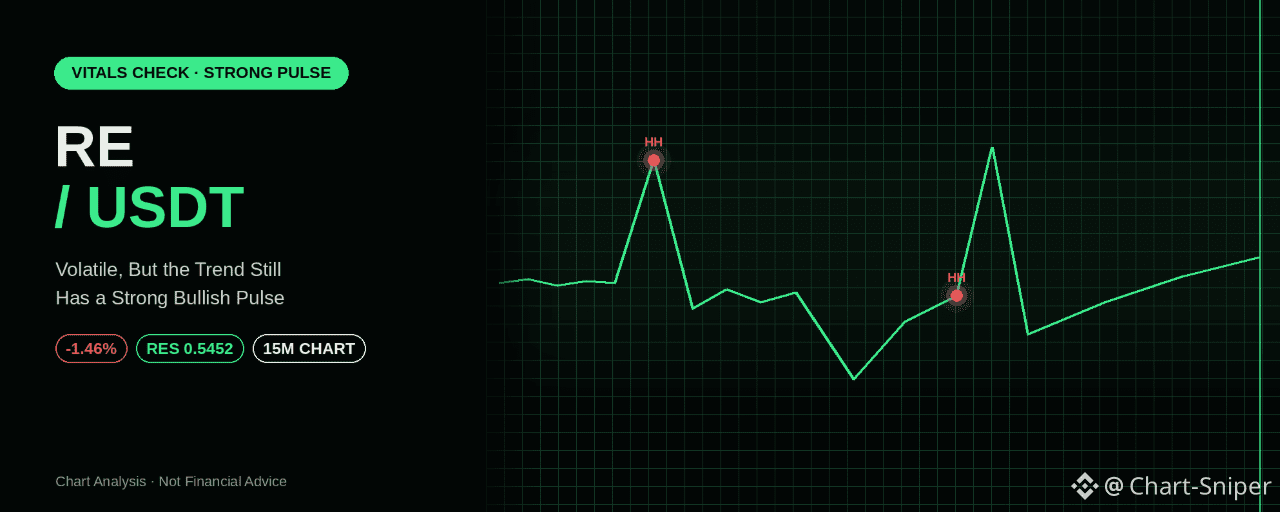
RE/USDT has been on an explosive multi-day run, and while the ride has been anything but smooth, the underlying structure remains constructive.
The sequence on the chart:
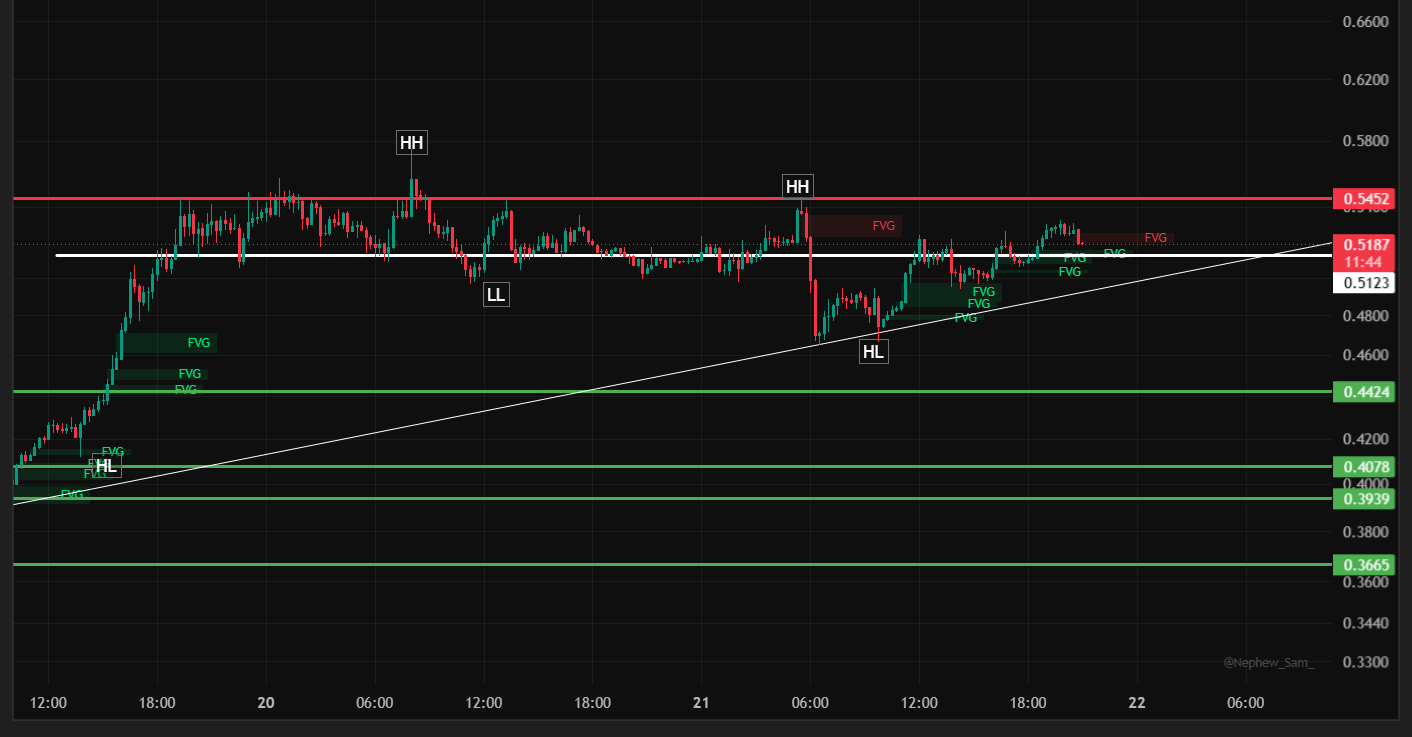
An early Higher Low (HL) near 0.4078 kicked off a powerful rally, carrying price all the way to a first Higher High (HH) near 0.5452 — the level that has since become the market's primary resistance.
Price pulled back into a Lower Low (LL) around 0.5123, then spent time consolidating in a range between that LL and the HH resistance.
A sharp, aggressive sell-off then broke through that range, flushing price down to a fresh Higher Low around 0.478 – 0.480 — a deep but still higher-than-the-original-base retracement.
From there, RE rallied hard back through a stack of Fair Value Gaps (FVGs), attempting a second test of the 0.5452 resistance — that attempt was rejected sharply, producing another steep drop.
RE has since based out again near the same HL zone (~0.478 – 0.480) and climbed back through the FVG stack to the current price of 0.5190, down -1.46% intraday as it digests the recent volatility.
This is a market with real momentum but also real volatility — two attempts at the same resistance level have both been rejected, yet each pullback has continued to find support at a level equal to or higher than the last. That combination (rising structure + repeated resistance rejection) is exactly why patience on entries matters here more than usual.
Why the Bigger Picture Still Looks Bullish
The rising trendline connecting the original HL through to the most recent HL is still intact, and current price is trading right around that trendline's projected path.
Each flush lower has found buyers at a higher structural level than the base of the move, which is the core requirement for a bullish trend even amid sharp swings.
The FVG stack below current price represents genuine, tested demand — RE has already used this zone once to fuel a strong recovery leg.
A third test of 0.5452, especially if it comes after a proper base rather than a sharp spike, would have a better chance of finally breaking through.
Key Levels on the Chart
Resistance above:
0.5452 — the major level, rejected twice, the single most important line on this chart
Above that: open air, meaning a confirmed breakout could move quickly given the lack of recent overhead supply
Support below:
0.500 – 0.512 — FVG stack + rising trendline confluence, first real demand zone on a pullback
0.478 – 0.480 — the most recent Higher Low, key structural support
0.4424 / 0.4078 — deeper support tiers from earlier in the move
0.3939 / 0.3665 — the original base structure, well below current price
Trade Plan (Educational Framework Only)
🟢 Preferred Long Setup — Buy the Trendline/FVG Zone
Given the volatility already seen at the resistance level, the safer approach is buying the tested support zone rather than chasing strength toward 0.5452 directly.
Entry zone: 0.500 – 0.512 (FVG + rising trendline confluence)
Stop loss: Below 0.478 (a close back below the most recent HL)
Target 1: 0.5452 (the resistance level, on its third test)
Target 2: New highs above 0.5452 only on a confirmed breakout (see below)
🟡 Breakout Momentum Entry
Given this level has already rejected price twice, wait for real confirmation rather than the first wick:
Entry: A 15-minute close above 0.5452 with continuation, ideally following a period of consolidation rather than a sharp vertical spike
Stop loss: Below 0.520 (back inside the recent range)
Target 1: 0.58 – 0.60
Target 2: Trail stops higher if momentum sustains
🔴 Invalidation
A decisive close below 0.478 would break the current Higher Low and put the broader bullish structure at meaningful risk, opening room toward the 0.4424 support tier.
Bottom Line
RE/USDT remains structurally bullish despite two sharp rejections at 0.5452 — each pullback has continued to find support at progressively higher levels, and the rising trendline is still intact. Given the volatility already shown at resistance, buying the tested FVG/trendline zone offers a cleaner risk/reward than chasing strength into a level that has already said "no" twice.
⚠️ Disclaimer: This article is for educational and informational purposes only and does not constitute financial advice. Cryptocurrency trading carries significant risk, and RE/USDT — like most low-cap perpetual contracts — can be highly volatile, as this chart itself demonstrates. Always do your own research (DYOR) and manage risk according to your own financial situation before entering any trade. Past structure and technical patterns do not guarantee future price behavior.
@Binance Square Official #GoldReboundsNearly5% #USRefinersFaceLoomingCrudeSupplyDrop #BitcoinBestWeekSinceMarch2023 #Binance #ChartSniper