
1H Chart Analysis | MUBARAK Perpetual Contract (Binance) | August 19, 2026
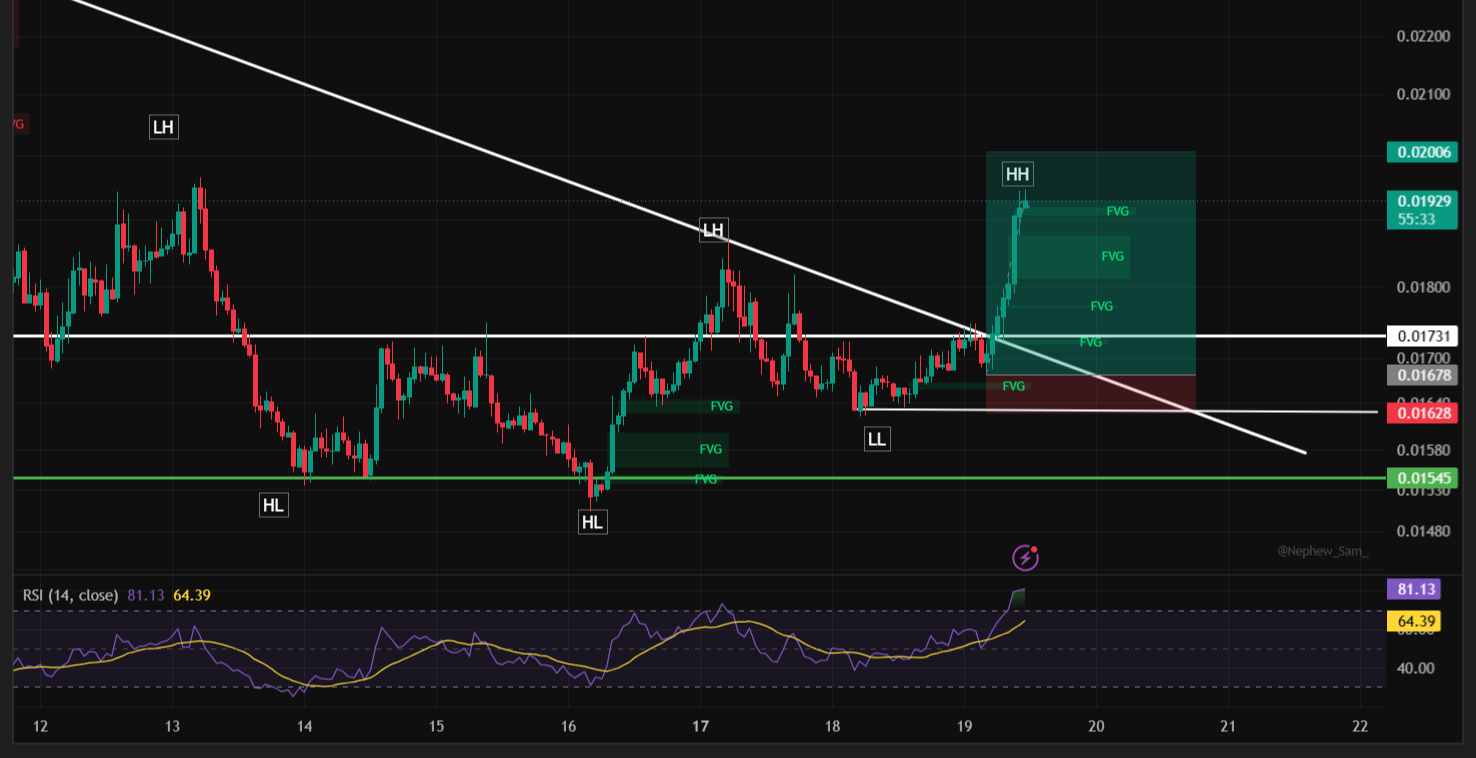
📌 Called in advance: This exact breakout was flagged well before it happened. The descending trendline connecting the lower-high sequence, the higher-low structure building underneath it, and the demand zones (FVGs) that price would need to reclaim were all mapped out ahead of the move — and MUBARAK has now played out precisely as anticipated, breaking structure and printing a fresh Higher High. This is a live confirmation of that earlier call, not hindsight.
The Setup
MUBARAK/USDT has spent the past several days grinding through a textbook descending channel, marked by a clean sequence of Lower Highs (LH) and Higher Lows (HL). That's the classic footprint of a market coiling for a decision — sellers losing momentum on every push down, buyers stepping in a little higher each time.
The structure on the chart tells the story in four acts:
LH → HL → LH → HL → LL — a slow bleed lower, but with each swing low holding above the prior support band (~0.01545), signaling absorption rather than capitulation.
A long-standing descending trendline capped every rally attempt from above, right up until the most recent candle.
Price finally broke and closed above the trendline near the 0.01731 level — the same zone that had acted as horizontal resistance/support multiple times.
That break triggered an aggressive impulse candle straight into a stack of Fair Value Gaps (FVGs), printing a Higher High (HH) at 0.01923, the first HH this pair has made in this entire sequence.
That shift — from LH/HL to a confirmed HH — is the first real signal of a potential change in trend character, from bearish-to-neutral structure toward early bullish structure.
Momentum Check: RSI Is Running Hot
The 1H RSI (14) is sitting at 80.72, deep in overbought territory, with the RSI moving average at 62.31 confirming the strength of the recent thrust. This is a double-edged signal:
Bullish: Overbought readings during a genuine breakout are common and often precede continuation, not reversal — strong trends can stay overbought for extended periods.
Caution: A pullback or consolidation to "reset" RSI before the next leg up is statistically likely. Chasing the candle that's already up here carries poor risk/reward.
Key Levels on the Chart
Resistance above:
0.01923 — most recent swing high (HH)
0.02006 — first major resistance / prior structure level
0.02341 — major resistance, origin of the descending trendline
Support / demand below (the FVG stack):
0.01731 — broken trendline resistance, now first line of support (also a Fair Value Gap)
0.01700 — mid FVG
0.01678 — lower FVG
0.01628 — red (bearish) FVG / breaker zone — the line in the sand for the bullish structure
0.01545 — prior Higher Low, the last major structural support before the setup invalidates
Trade Plan (Educational Framework Only)
🟢 Preferred Long Setup — Retest Entry
Rather than chasing strength into overbought RSI, the higher-probability play is to wait for price to retrace into the reclaimed FVG zone that now sits below as support.
Entry zone: 0.01700 – 0.01731 (retest of the broken trendline / FVG confluence)
Stop loss: Below 0.01628 (below the red FVG / breaker block — a close below here voids the bullish structure)
Target 1: 0.01923 (retest of the recent HH)
Target 2: 0.02006
Target 3 (extended): 0.02341
🟡 Aggressive/Momentum Entry
For traders comfortable with overbought conditions and tighter risk:
Entry: Current market price on confirmation candles holding above 0.01900
Stop loss: Below 0.01820 (intraday structure)
Target 1: 0.02006
Target 2: 0.02341
🔴 Invalidation
A decisive close back below 0.01545 (the last Higher Low) would break the bullish market structure entirely and open the door back toward the prior downtrend.
Bottom Line
MUBARAK/USDT has done what it needed to do: break the descending trendline, reclaim a key horizontal level, and print a Higher High. Structurally, this flips the short-term bias from bearish to cautiously bullish. But with RSI stretched at 80+, patience on entries — favoring the retest zone over the chase — offers a cleaner risk/reward than jumping in at the highs.
As emphasized above, this move is unfolding exactly along the lines flagged ahead of time: the trendline break, the FVG reaction, and the shift to a Higher High were all anticipated before price confirmed them.
⚠️ Disclaimer: This article is for educational and informational purposes only and does not constitute financial advice. Cryptocurrency trading carries significant risk, and MUBARAK/USDT — like most low-cap perpetual contracts — can be highly volatile. Always do your own research (DYOR) and manage risk according to your own financial situation before entering any trade. Past structure and technical patterns do not guarantee future price behavior.
@Binance Square Official #UAESaysItDetectedTwoIranianBallisticMissiles #USDieselMarginsTopRecord$100ABarrel #MetaplanetToInvest2100BTCInSuperLeague #Binance #ChartSniper