
1H Technical Outlook | August 19, 2026
Cross-check: live sources (TradingEconomics, Oilprice.com, Investing.com) show WTI trading in the $84.25–$85.18 range as of today, closely matching this chart's $84.95 — the price data here checks out. Current reporting also points to real geopolitical drivers behind the recent strength: elevated tension around the Strait of Hormuz and the expiration of the US-Iran interim agreement this week. That's useful context for why volatility may stay elevated, though it isn't a factor a technical read can price in with precision.
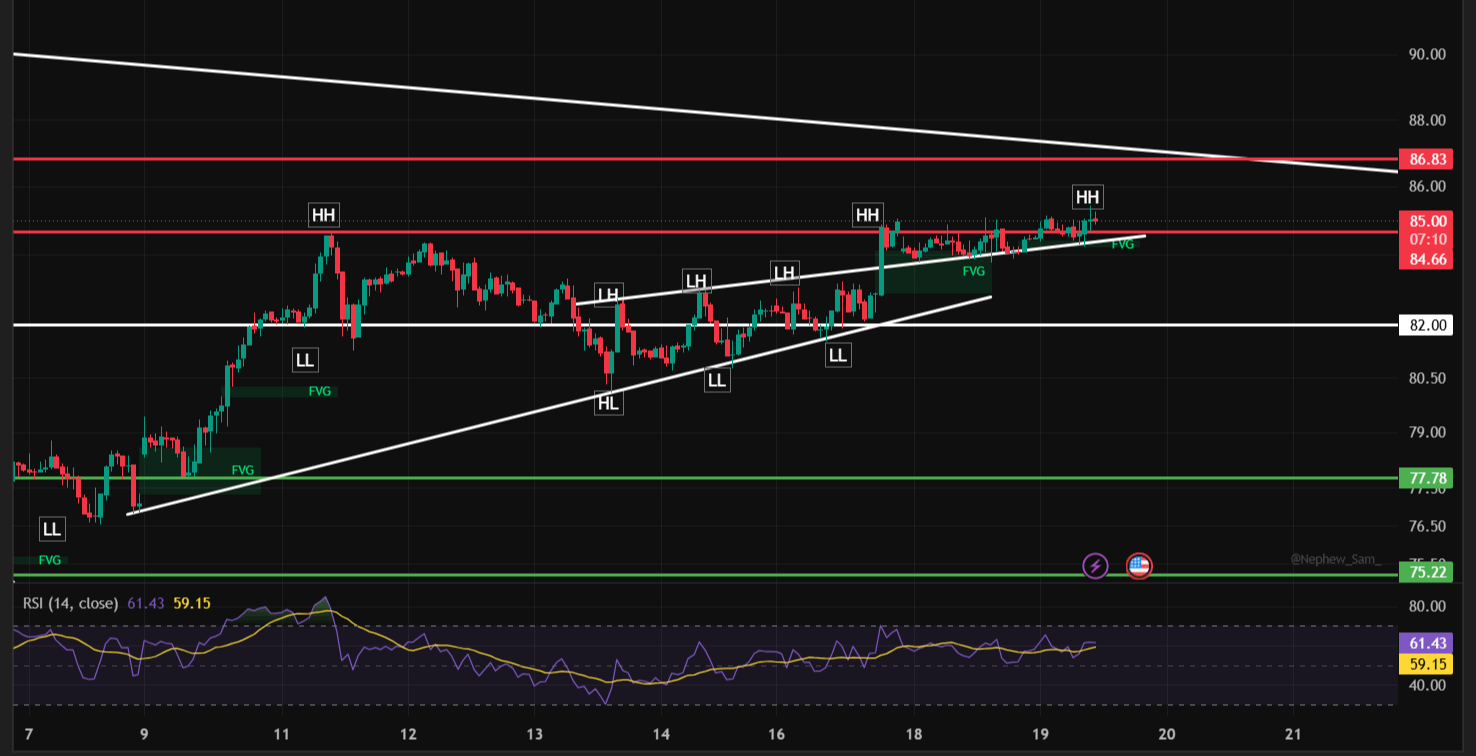
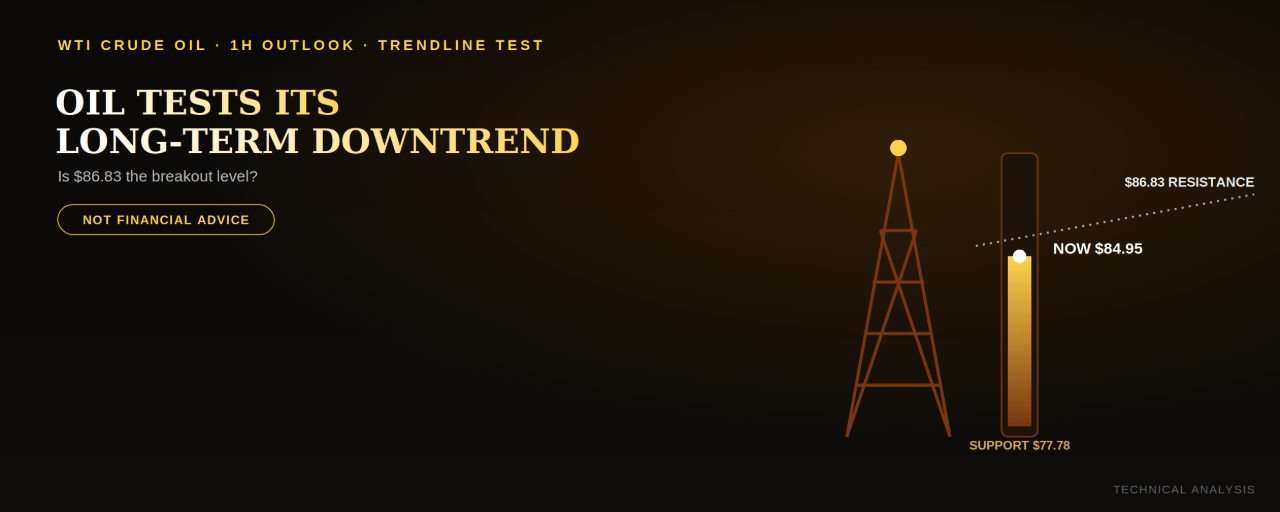
WTI crude has been grinding higher inside a rising channel for over a week, and that climb has now brought price right up against a longer-term descending trendline — the same one that's capped rallies since early August. At $84.95 (-0.07% today), oil is sitting at a genuine decision point.
This article is for educational and informational purposes only. It is not financial advice. Oil is especially sensitive to geopolitical headlines right now. Confirm a real breakout before assuming continuation, and expect wider, faster moves than usual given the current backdrop.
Market Structure: A Rising Channel Meeting a Falling Trendline
Since the Lower Low near $77.78 on August 11, WTI has climbed steadily through a series of Higher Lows and Higher Highs, tracing a clean rising channel. At the same time, a longer descending trendline connecting the highs from earlier in August is still sloping down — and the two lines are now converging right around current price.
Momentum Is Mildly Supportive
The RSI (14) is at 60.19, above both the neutral 50 line and its moving average of 59.06. That's a constructive reading, consistent with the rising channel rather than a fading push into resistance.
The Zone That Matters: $84.66 – $86.83
This is where the descending trendline and the nearest resistance levels converge. A rejection here would fit the pattern that's held since early August. A confirmed close above $86.83 — especially one that also breaks the longer trendline — would be the strongest signal yet that the broader downtrend from the highs is over.
Resistance Levels to Watch
$84.66 — the nearer reference level
$86.83 — the descending trendline and key resistance confluence, the level in play right now
$93.54 — the major resistance; distant, relevant only on a genuine trend reversal
Support Levels to Watch
$82.00 — a reference level within the current channel
$77.78 — the more significant support, close to the rising channel's floor
$75.22 — a deeper support level
Potential Trade Setups (Illustrative Only — Not Financial Advice)
🟢 Setup 1 — Buy the channel continuation
Entry zone: $82.00 – $84.95 (on a pullback that holds within the channel)
Invalidation / Stop-loss: Below $77.78
Target 1: $86.83
Target 2: Open-ended if the descending trendline breaks, trailing stops higher
🔴 Setup 2 — Fade a rejection at the trendline
Entry zone: $85.50 – $86.83 (on a push into the confluence zone)
Invalidation / Stop-loss: Above $87.50
Target 1: $82.00
Target 2: $77.78
🟢 Setup 3 — Bullish breakout confirmation
Trigger: A confirmed 1H close above $86.83 and the descending trendline
Entry zone: $87.00 – $88.00 on confirmation
Invalidation / Stop-loss: Below $84.66
Target: $93.54
⚠️ Channel breakdown (bearish invalidation)
A confirmed close below $77.78 would break the rising channel structure and suggest the broader uptrend is losing momentum.
Bottom Line
WTI is pressing directly into the trendline that's defined its resistance since early August, backed by supportive RSI and a genuinely constructive channel structure. Clear $86.83 with a confirmed close and the picture shifts toward a run at $93.54; reject here again, and a pullback toward $82.00–$77.78 fits the pattern that's held so far. Given the active geopolitical backdrop, expect this level to be tested with more volatility than usual.
Disclaimer: This content is for informational and educational purposes only and does not constitute financial, investment, or trading advice. Trading commodities and CFDs involves significant risk, including the potential loss of principal. Past performance and chart patterns are not indicative of future results. Always conduct your own research and consult a licensed financial advisor before making trading decisions.
@Binance Square Official #UAESaysItDetectedTwoIranianBallisticMissiles #USDieselMarginsTopRecord$100ABarrel #MetaplanetToInvest2100BTCInSuperLeague #Binance #ChartSniper