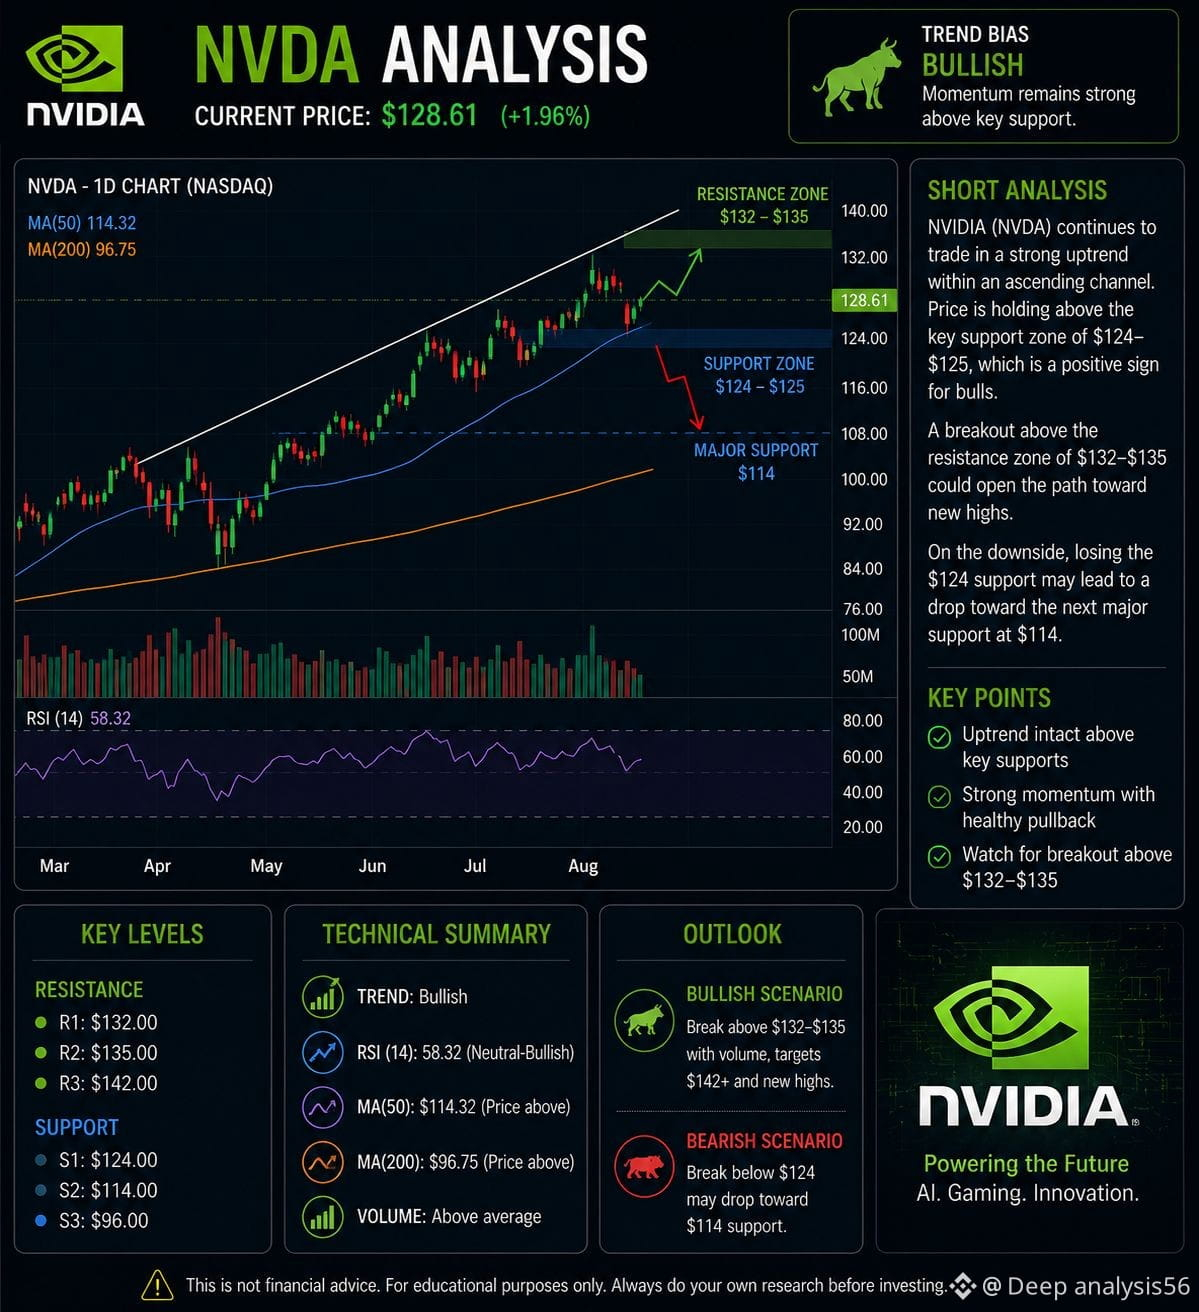
📊 $NVDA Kurze Analyse
NVIDIA (NVDA) zeigt starke Dynamik und bleibt oberhalb wichtiger gleitender Durchschnitte. Der jüngste Handel liegt bei etwa 225 US-Dollar, wobei 221–225 US-Dollar als wichtige Unterstützungszone fungieren. Ein anhaltender Ausbruch über 227–230 US-Dollar könnte die bullische Ausgangslage stärken, während ein Bruch unter der Unterstützung die Dynamik schwächen würde.
Bias: Bullisch 📈
Beobachten: Unterstützung $221–$225 | Widerstand $227–$230
Der nächste Earnings-Report von NVIDIA ist für den 26. August 2026 angesetzt, was zu erhöhter Volatilität führen könnte.
Nur zu Bildungszwecken – keine Finanzberatung.#IsraelStrikesLebanonKillsHezbollahCommander #CardanoSplitsDijkstraUpgradeIntoTwoPhases #SECCancelsCryptoRulemakingMeeting #SECReviewsSix3xLeveragedCommodityETFs #USToPressNationsToPickUSOrChinaAICoalition
NVIDIA (NVDA) zeigt starke Dynamik und bleibt oberhalb wichtiger gleitender Durchschnitte. Der jüngste Handel liegt bei etwa 225 US-Dollar, wobei 221–225 US-Dollar als wichtige Unterstützungszone fungieren. Ein anhaltender Ausbruch über 227–230 US-Dollar könnte die bullische Ausgangslage stärken, während ein Bruch unter der Unterstützung die Dynamik schwächen würde.
Bias: Bullisch 📈
Beobachten: Unterstützung $221–$225 | Widerstand $227–$230
Der nächste Earnings-Report von NVIDIA ist für den 26. August 2026 angesetzt, was zu erhöhter Volatilität führen könnte.
Nur zu Bildungszwecken – keine Finanzberatung.#IsraelStrikesLebanonKillsHezbollahCommander #CardanoSplitsDijkstraUpgradeIntoTwoPhases #SECCancelsCryptoRulemakingMeeting #SECReviewsSix3xLeveragedCommodityETFs #USToPressNationsToPickUSOrChinaAICoalition