
1H Technical Outlook | August 16, 2026
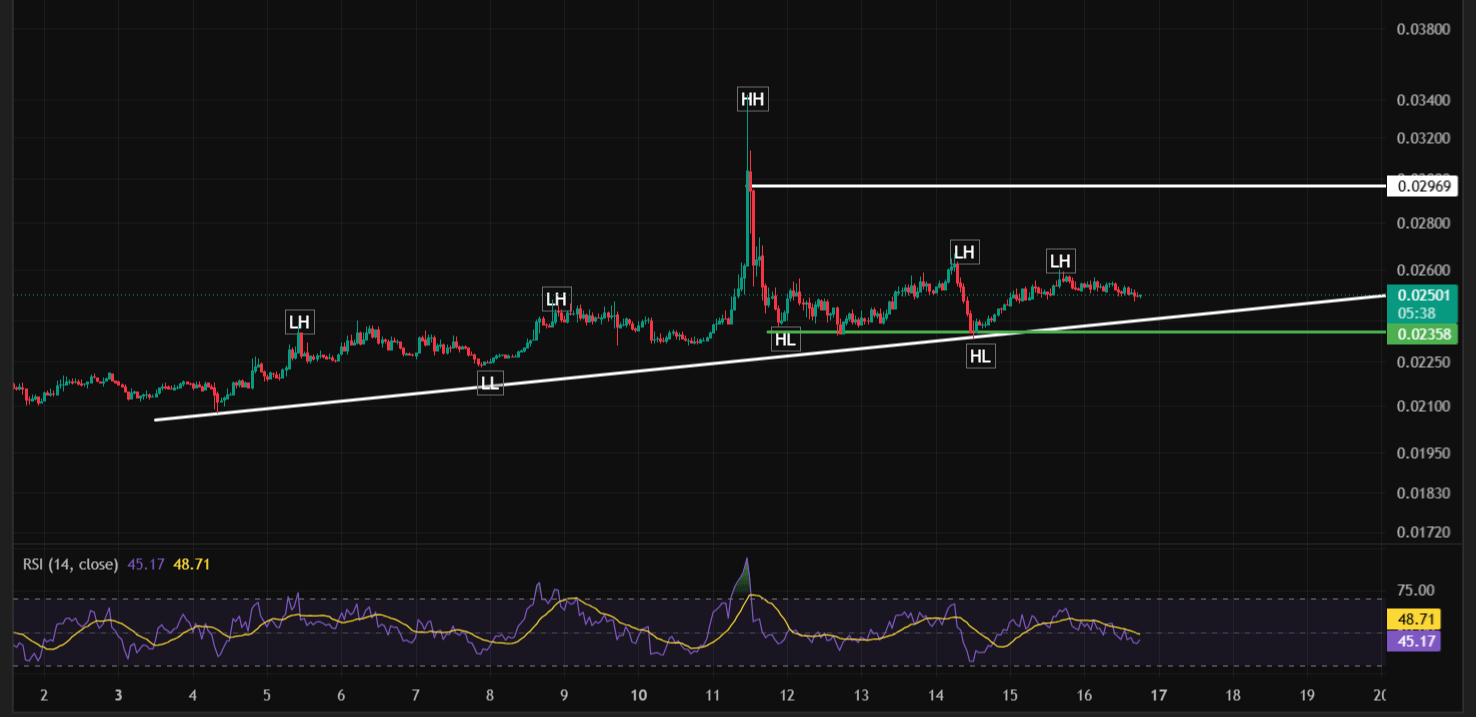
MITO/USDT delivered a sharp vertical spike to a high near $0.0325 on August 11, and has spent the days since cooling into a choppier, lower-energy range. Price is currently flat at $0.02498 (+0.12% today), still sitting above the rising trendline that's supported this move since early August.
This article is for educational and informational purposes only. It is not financial advice. The post-spike price action has been choppy with a series of Lower Highs. Confirm support holds before assuming the broader uptrend simply continues.
What Happened: A Sharp Spike, Then a Cooling-Off Period
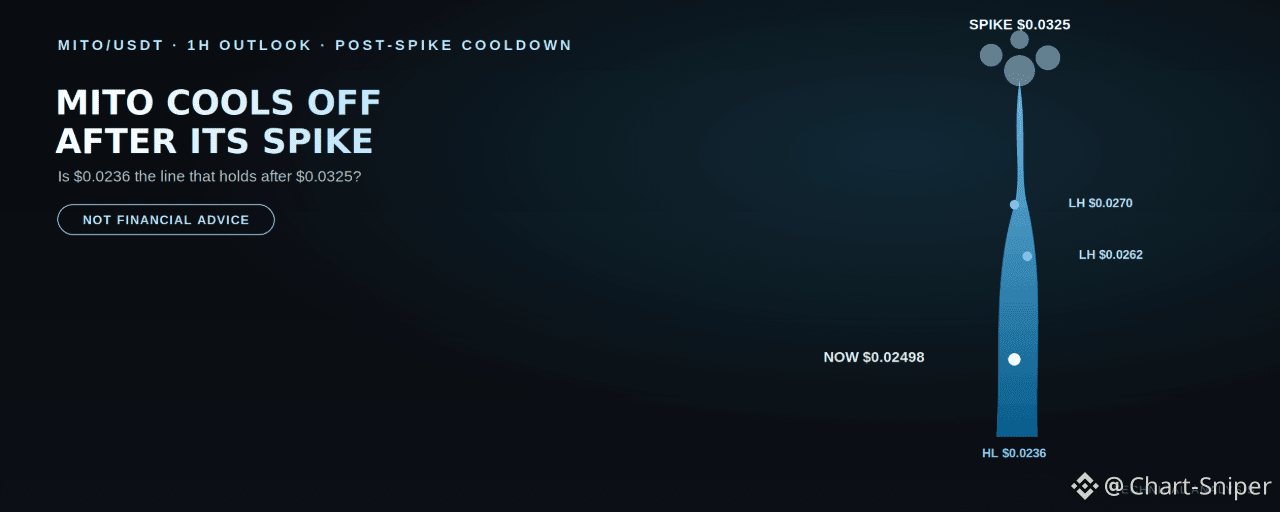
From a Lower Low near $0.0205 on August 2, MITO built a gradual base with a couple of Lower Highs before spiking sharply to a high near $0.0325 on August 11 — a fast, high-momentum move. Since that spike, price has pulled back and settled into a range roughly between $0.0236 and $0.0297, with two Lower Highs forming along the way ($0.0270, then $0.0262) — a sign that the explosive momentum behind the original spike has faded for now.
A rising trendline connects the original Lower Low through the recent Higher Lows and remains intact beneath the current range.
Momentum Is Leaning Soft
The RSI (14) is at 44.26, below both the neutral 50 line and its moving average of 48.65. That's a mildly bearish-leaning reading, consistent with the pattern of Lower Highs since the spike rather than a strong renewed push higher.
The Zone That Matters: $0.0236 – $0.0250
Current price is trading in this band. Holding above the rising trendline and the $0.0236 Higher Low keeps the broader structure intact; losing it would be the clearer signal that the post-spike cooldown has turned into something more bearish.
Resistance Levels to Watch
$0.0262 – $0.0270 — the recent Lower High cluster, the immediate hurdle
$0.02969 — the more significant resistance from the post-spike consolidation; clearing this would open the door to retesting the $0.0325 spike high
Support Levels to Watch
$0.0236 — the Higher Low, and the level most closely tied to the rising trendline
Below the trendline, the next real reference is the original $0.0205 Lower Low
Potential Trade Setups (Illustrative Only — Not Financial Advice)
🟢 Setup 1 — Buy the trendline / support retest
Entry zone: $0.0236 – $0.0250
Invalidation / Stop-loss: Below $0.0220
Target 1: $0.0270
Target 2: $0.02969
🔴 Setup 2 — Fade a rejection at the Lower High cluster
Trigger: Rejection candle inside $0.0262–$0.0270
Entry zone: Top of the rejection
Invalidation / Stop-loss: Above $0.0275
Target 1: $0.0236
Target 2: $0.0220
🟢 Setup 3 — Bullish breakout (spike retest)
Trigger: A confirmed 1H close above $0.02969
Entry zone: $0.0298 – $0.0305 on confirmation
Invalidation / Stop-loss: Below $0.0262
Target: $0.0325 (retest of the spike high)
⚠️ Trendline breakdown (bearish invalidation)
A confirmed close below the rising trendline and $0.0220 would break the structure that's held since early August, suggesting the post-spike cooldown has turned into a genuine reversal.
Bottom Line
MITO's explosive spike to $0.0325 has given way to a choppier, cooler phase with a pattern of Lower Highs and softening RSI. The $0.0236–$0.0250 zone is the level to watch: hold above the rising trendline here, and a push back toward $0.0270–$0.02969 remains plausible; lose it, and the cooldown would need to be reassessed as something more serious.
Disclaimer: This content is for informational and educational purposes only and does not constitute financial, investment, or trading advice. Cryptocurrency trading, especially in low-priced and recently volatile assets, involves significant risk, including the potential loss of principal. Past performance and chart patterns are not indicative of future results. Always conduct your own research and consult a licensed financial advisor before making trading decisions.
@Binance Square Official @Binance Earn Official #SpaceXSharesRiseTo$140 #SECReviewsSix3xLeveragedCommodityETFs #USToPressNationsToPickUSOrChinaAICoalition #SP500TopsRecord7800 #Binance