


As of August 14, 2026, the Bitcoin price today sits at $62,907 after a grinding, methodical downtrend rather than a sharp crash. Price has slipped below every major daily moving average, and that shift changes how traders should frame risk.
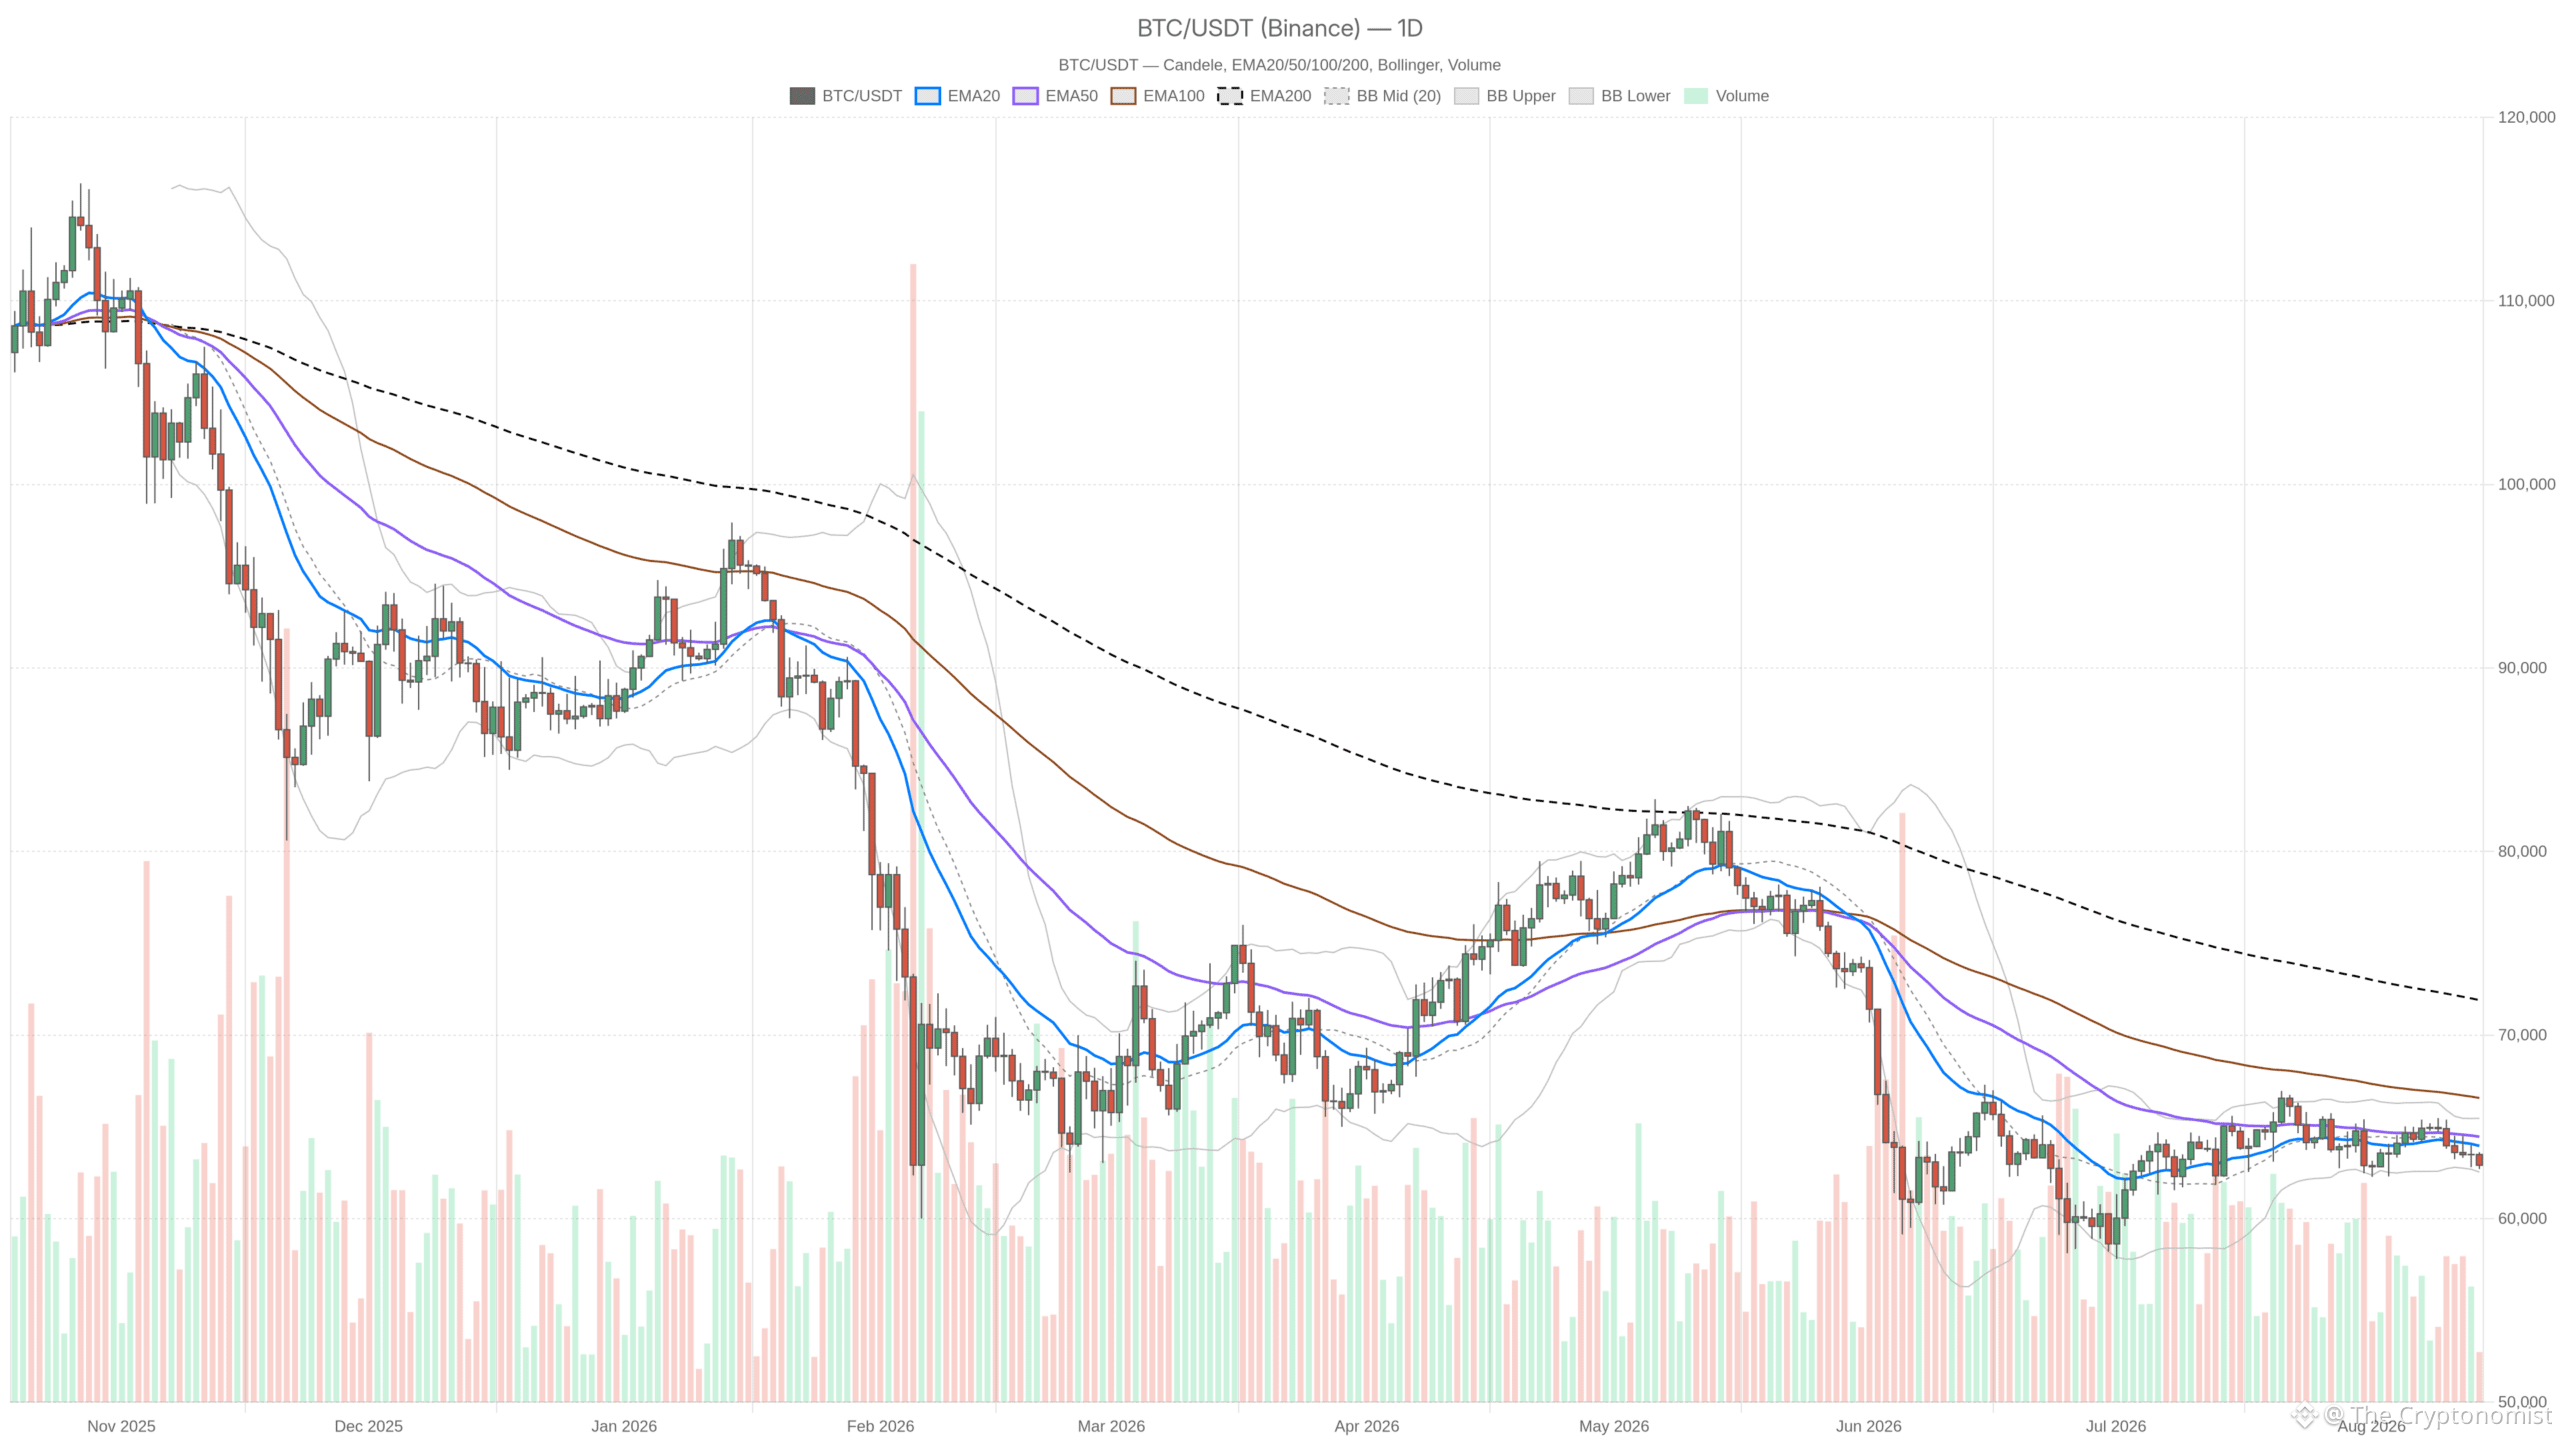 BTC/USDT — daily chart with candlesticks, EMA20/EMA50 and volume.
Key takeaways
Bitcoin traded at $62,907 on August 14, 2026, below all major daily moving averages.
The Fear & Greed Index sat at 29, squarely in fear territory.
Daily RSI14 was 42.06, soft but not yet oversold.
Support near $62,532 aligns with the lower Bollinger Band.
Bitcoin ETF inflows reached $850 million, per Bloomberg, despite spot weakness.
Market Sentiment: Dominance and Fear
The market’s tone is defensive rather than panicked. Bitcoin dominance stands at 56.08% of a total crypto market cap near $2.247 trillion, which fell 0.92% over 24 hours, according to aggregated market data. That combination suggests capital is leaving the table rather than rotating into alternative assets. The Fear & Greed Index reading of 29 reinforces the read: dip-buyers are not stepping in with conviction.
Daily Chart: The Macro Bias Is Bearish
The daily chart confirms a structural downtrend, not a shallow pullback. Price at $62,907 trades below the EMA20 at $63,961, the EMA50 at $64,462.68, and the EMA200 at $71,907.36. That gap to the 200-period average, close to $9,000, signals a downtrend that has been building for a while.
The daily RSI14 at 42.06 is soft but not yet oversold, so sellers still have room to push. MACD confirms the bearish tone: the line sits at -149.36 against a signal of -4.22, producing a histogram of -145.13. That wide negative histogram reflects momentum still accelerating lower rather than fading. Meanwhile, price hugs the lower Bollinger Band at $62,535.02, with the midline at $63,998.37.
When price rides the lower band this closely, two readings apply. The trend may keep walking the band lower, or the move is stretched enough for a short-term bounce. With RSI still mid-range rather than deeply oversold, the first reading looks more likely. Daily ATR14 of $1,099.93 confirms real volatility. Moreover, the daily pivot at $63,074.82 with support at $62,532.19 lines up almost exactly with the lower band, making that zone the key level to watch.
1H and 15m: Confirmation With a Hint of Fatigue
The lower timeframes confirm the bearish bias while showing early signs of selling fatigue. On the 1-hour chart, price stacks below the EMA20 at $63,298.72, the EMA50 at $63,519.56, and the EMA200 at $63,963.21, and the regime remains bearish. However, RSI14 at 32.59 pushes into oversold territory, suggesting short-term sellers have been aggressive.
MACD on the 1-hour chart shows the line at -160.17, the signal at -105.51, and a histogram of -54.65. The histogram is less extreme than the daily reading, hinting that the pace of selling has slowed even while the broader trend stays intact. On the 15-minute chart, useful only for execution timing, RSI14 sits at 36.35. There, the MACD histogram has narrowed to just -14.64 from -143.46 and -128.82 on the line and signal.
That narrowing histogram is the one piece of tension in this picture. It suggests intraday selling pressure is decelerating even while higher timeframes stay firmly bearish. A short-term relief bounce inside a larger downtrend is plausible. Still, reading it as a trend reversal would be a mistake without confirmation from the 1-hour and daily structures actually breaking.
What Would Flip the Script in Either Direction
A reclaim of the daily EMA20 near $63,961 would repair the bullish case, while a close below $62,532 would confirm more downside. On the bullish side, a move back above the daily pivot at $63,074.82 and through R1 at $63,449.64 would start repairing short-term structure. However, the level that really matters is the EMA20 combined with a close above the Bollinger mid-band at $63,998.37.
Clearing both would suggest the downtrend is losing steam rather than pausing. Anything less, a bounce that fails below the pivot, keeps sellers in control. Given where the Bitcoin price today sits, the bearish case is more straightforward. A daily close below S1 at $62,532.19, nearly coinciding with the lower Bollinger Band at $62,535.02, would confirm the band-walking scenario.
That close would open the door to further downside, with the $1,099.93 ATR showing how far one daily session could travel. Only a genuine reclaim of the EMA20 and pivot cluster would invalidate that scenario, not a single green candle on the 15-minute chart.
Context Beyond the Chart
Institutional demand has not disappeared despite the spot weakness. Bloomberg reported that Bitcoin ETF inflows hit $850 million even after news of a Coldcard wallet hack. That is a meaningful signal that flows and price are not always moving in lockstep. Separately, CNBC noted that Riot Platforms struck a deal with Anthropic as miners increasingly shift toward AI infrastructure.
The Riot-Anthropic story speaks to the mining sector’s evolving business model rather than a direct price catalyst. It shows how the industry around Bitcoin keeps changing even while the asset consolidates lower.
FAQ
Where is Bitcoin trading today?
Bitcoin traded at $62,907 on August 14, 2026, below the daily EMA20, EMA50, and EMA200.
What levels matter most for Bitcoin’s next move?
Support sits near $62,532, aligning with the lower Bollinger Band. A reclaim of the daily EMA20 near $63,961 would suggest the downtrend is losing steam.
Is Bitcoin oversold right now?
The daily RSI14 at 42.06 is soft but not oversold. The 1-hour RSI14 at 32.59 is closer to oversold territory, hinting at possible short-term exhaustion.
What does the Fear & Greed Index show?
The Fear & Greed Index sits at 29, squarely in fear territory, signaling that risk appetite remains switched off.
Putting it together, the macro trend is bearish, momentum indicators agree, and only the shortest timeframe shows sellers pausing for breath. Volatility near $1,100 a day on ATR terms cuts both ways, and the Fear & Greed reading of 29 shows how little conviction exists on either side. Positioning around defined levels, rather than around a prediction of where price should go, is the more honest way to navigate this tape.
Disclaimer: This article is for informational purposes only and does not constitute financial advice, an investment recommendation, or a solicitation to buy or sell any financial instrument or cryptocurrency. The analysis provided is not indicative of future results. Investing in crypto assets and financial markets carries a high risk of capital loss. Always do your own research (DYOR) and consult a qualified financial advisor before making any decision.
Article produced with the assistance of artificial intelligence and reviewed by the editorial team.