[August 13 Bitcoin-Chartanalyse]
BTCUSD 30Min-Chart
*Meine Analyse ist für TradingView optimiert.
Wenn du die Wiedergabetaste drückst, kannst du die Bewegungen in Echtzeit prüfen.
-Long-Position-Strategie-
Was den Nasdaq betrifft: Aufgrund des MACD-Dead-Cross im 12-Stunden-Chart
ist es sehr wahrscheinlich, dass er bis morgen seitwärts handeln wird.
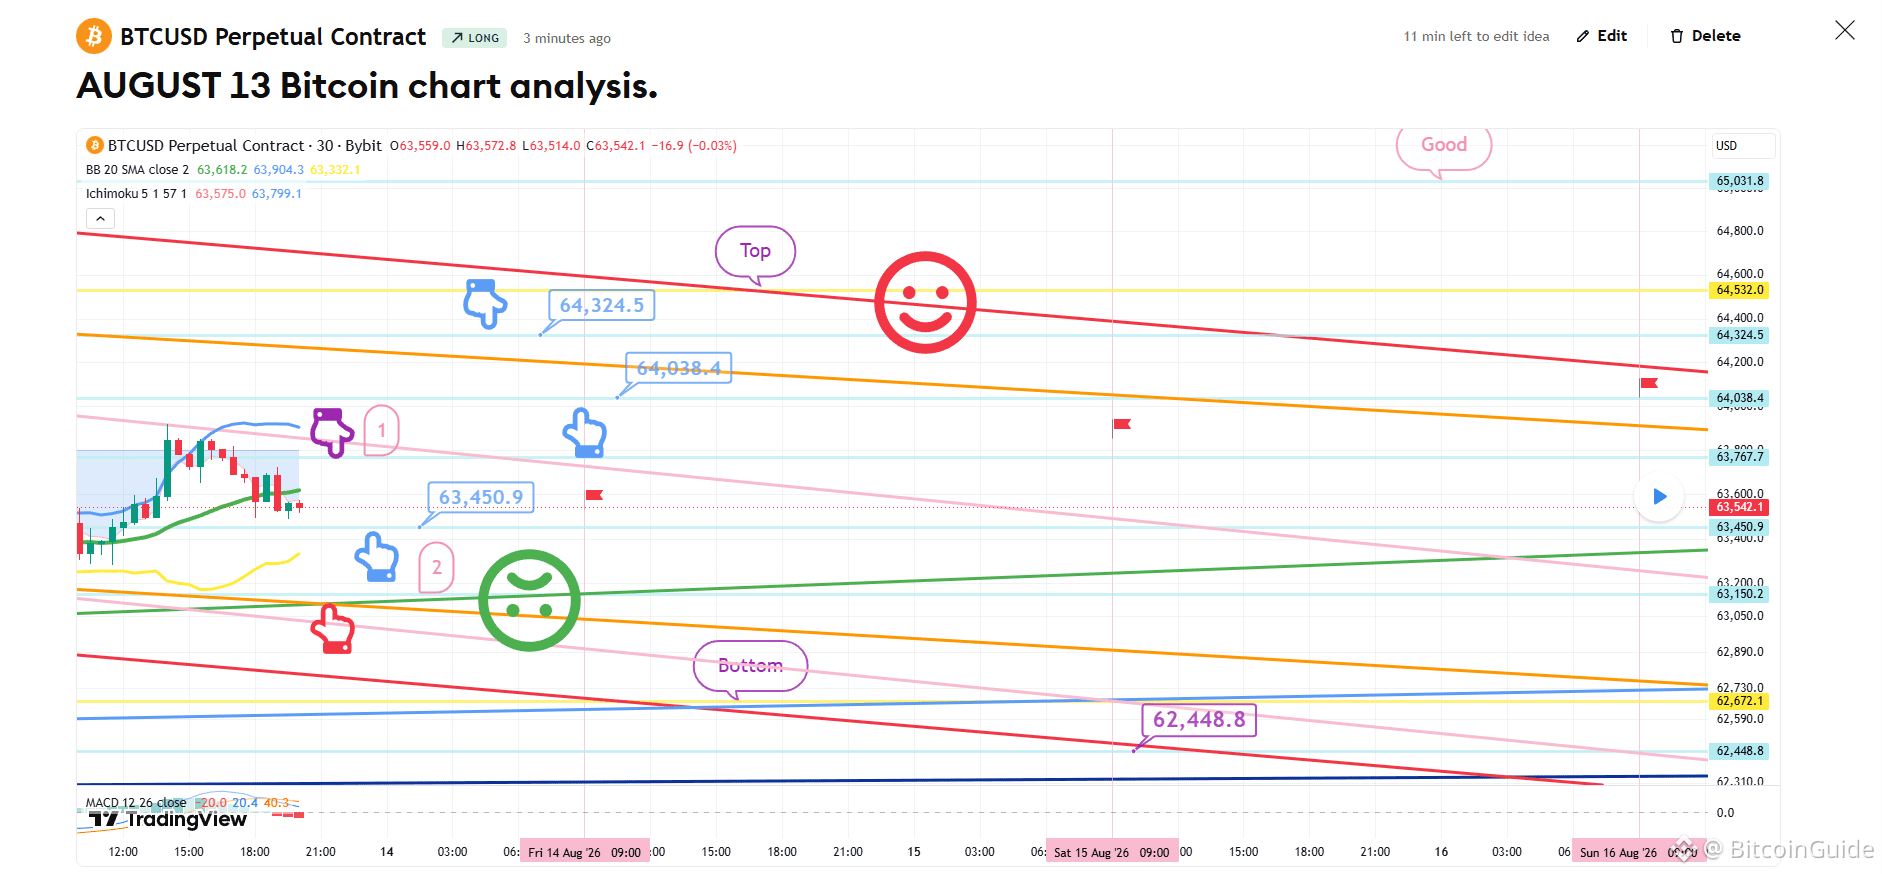
*Long-Position-Strategie (Um den Zeitpunkt des Purple-Finger-Touches 1 oben)
1) Nach der Bestätigung des Touches von $63,7K im Purple-Finger-Zone-1,
ist der Einstiegspunkt für die Long-Position $63.450,9 (hellblaue Hand) / Stop-Loss, falls die grüne Unterstützungslinie gebrochen wird.
2) $64.324,5 ist das erste Ziel für die Long-Position –> Zielpreise in der Reihenfolge Oben, Gut.
- Wenn der Kurs bei $64,3K erreicht wird, nutze den Bereich $64.038,4, um die Long-Position erneut einzusteigen.
3) Wenn der Preis Zone 1 nicht berührt und sofort abfällt:
Der Einstiegspunkt für die Long-Position ist $63.150,2 in der roten Finger-Zone 2 unten / Stop-Loss, falls die grüne Unterstützungslinie gebrochen wird –> Die verbleibenden Zielpreise bleiben gleich.
- Die Bottom-Zone unten ist eine mittelfristige Aufwärtstrendlinie, also
nicht empfehlenswert, wenn sie bricht, da weitere Rückgänge auftreten könnten.
Die Begrenzung ist offen bis zu maximal $62.448,8.
Bitte nutze meine Analysebeiträge lediglich als Referenz und für praktische Zwecke.
Ich hoffe, dass du sicher agierst, indem du dich strikt an die Handelsprinzipien und Stop-Loss-Orders hältst.
Ich poste die Analyseergebnisse jeden Tag als Kommentar.
Vielen Dank.
(Du kannst den Link auf meinem Profil finden.)
- Klicke auf „Folgen“, um jeden Tag schnellere Informationen zu erhalten.
- Überprüfe die Ergebnisse mit der Wiedergabetaste in TradingView.
#Crypto #BTC100K #Altcoin Season# #BTC Price Analysis# $ETH $USDT $BTC $USDT
BTCUSD 30Min-Chart
*Meine Analyse ist für TradingView optimiert.
Wenn du die Wiedergabetaste drückst, kannst du die Bewegungen in Echtzeit prüfen.
-Long-Position-Strategie-
Was den Nasdaq betrifft: Aufgrund des MACD-Dead-Cross im 12-Stunden-Chart
ist es sehr wahrscheinlich, dass er bis morgen seitwärts handeln wird.
*Long-Position-Strategie (Um den Zeitpunkt des Purple-Finger-Touches 1 oben)
1) Nach der Bestätigung des Touches von $63,7K im Purple-Finger-Zone-1,
ist der Einstiegspunkt für die Long-Position $63.450,9 (hellblaue Hand) / Stop-Loss, falls die grüne Unterstützungslinie gebrochen wird.
2) $64.324,5 ist das erste Ziel für die Long-Position –> Zielpreise in der Reihenfolge Oben, Gut.
- Wenn der Kurs bei $64,3K erreicht wird, nutze den Bereich $64.038,4, um die Long-Position erneut einzusteigen.
3) Wenn der Preis Zone 1 nicht berührt und sofort abfällt:
Der Einstiegspunkt für die Long-Position ist $63.150,2 in der roten Finger-Zone 2 unten / Stop-Loss, falls die grüne Unterstützungslinie gebrochen wird –> Die verbleibenden Zielpreise bleiben gleich.
- Die Bottom-Zone unten ist eine mittelfristige Aufwärtstrendlinie, also
nicht empfehlenswert, wenn sie bricht, da weitere Rückgänge auftreten könnten.
Die Begrenzung ist offen bis zu maximal $62.448,8.
Bitte nutze meine Analysebeiträge lediglich als Referenz und für praktische Zwecke.
Ich hoffe, dass du sicher agierst, indem du dich strikt an die Handelsprinzipien und Stop-Loss-Orders hältst.
Ich poste die Analyseergebnisse jeden Tag als Kommentar.
Vielen Dank.
(Du kannst den Link auf meinem Profil finden.)
- Klicke auf „Folgen“, um jeden Tag schnellere Informationen zu erhalten.
- Überprüfe die Ergebnisse mit der Wiedergabetaste in TradingView.
#Crypto #BTC100K #Altcoin Season# #BTC Price Analysis# $ETH $USDT $BTC $USDT