


Cisco Systems, Inc. stock closed at $123.88 on August 12, holding a firmly bullish structure above all major moving averages. However, the post-earnings after-hours sell-off creates tension with the technical picture. This gap between chart strength and market reaction demands a closer look.
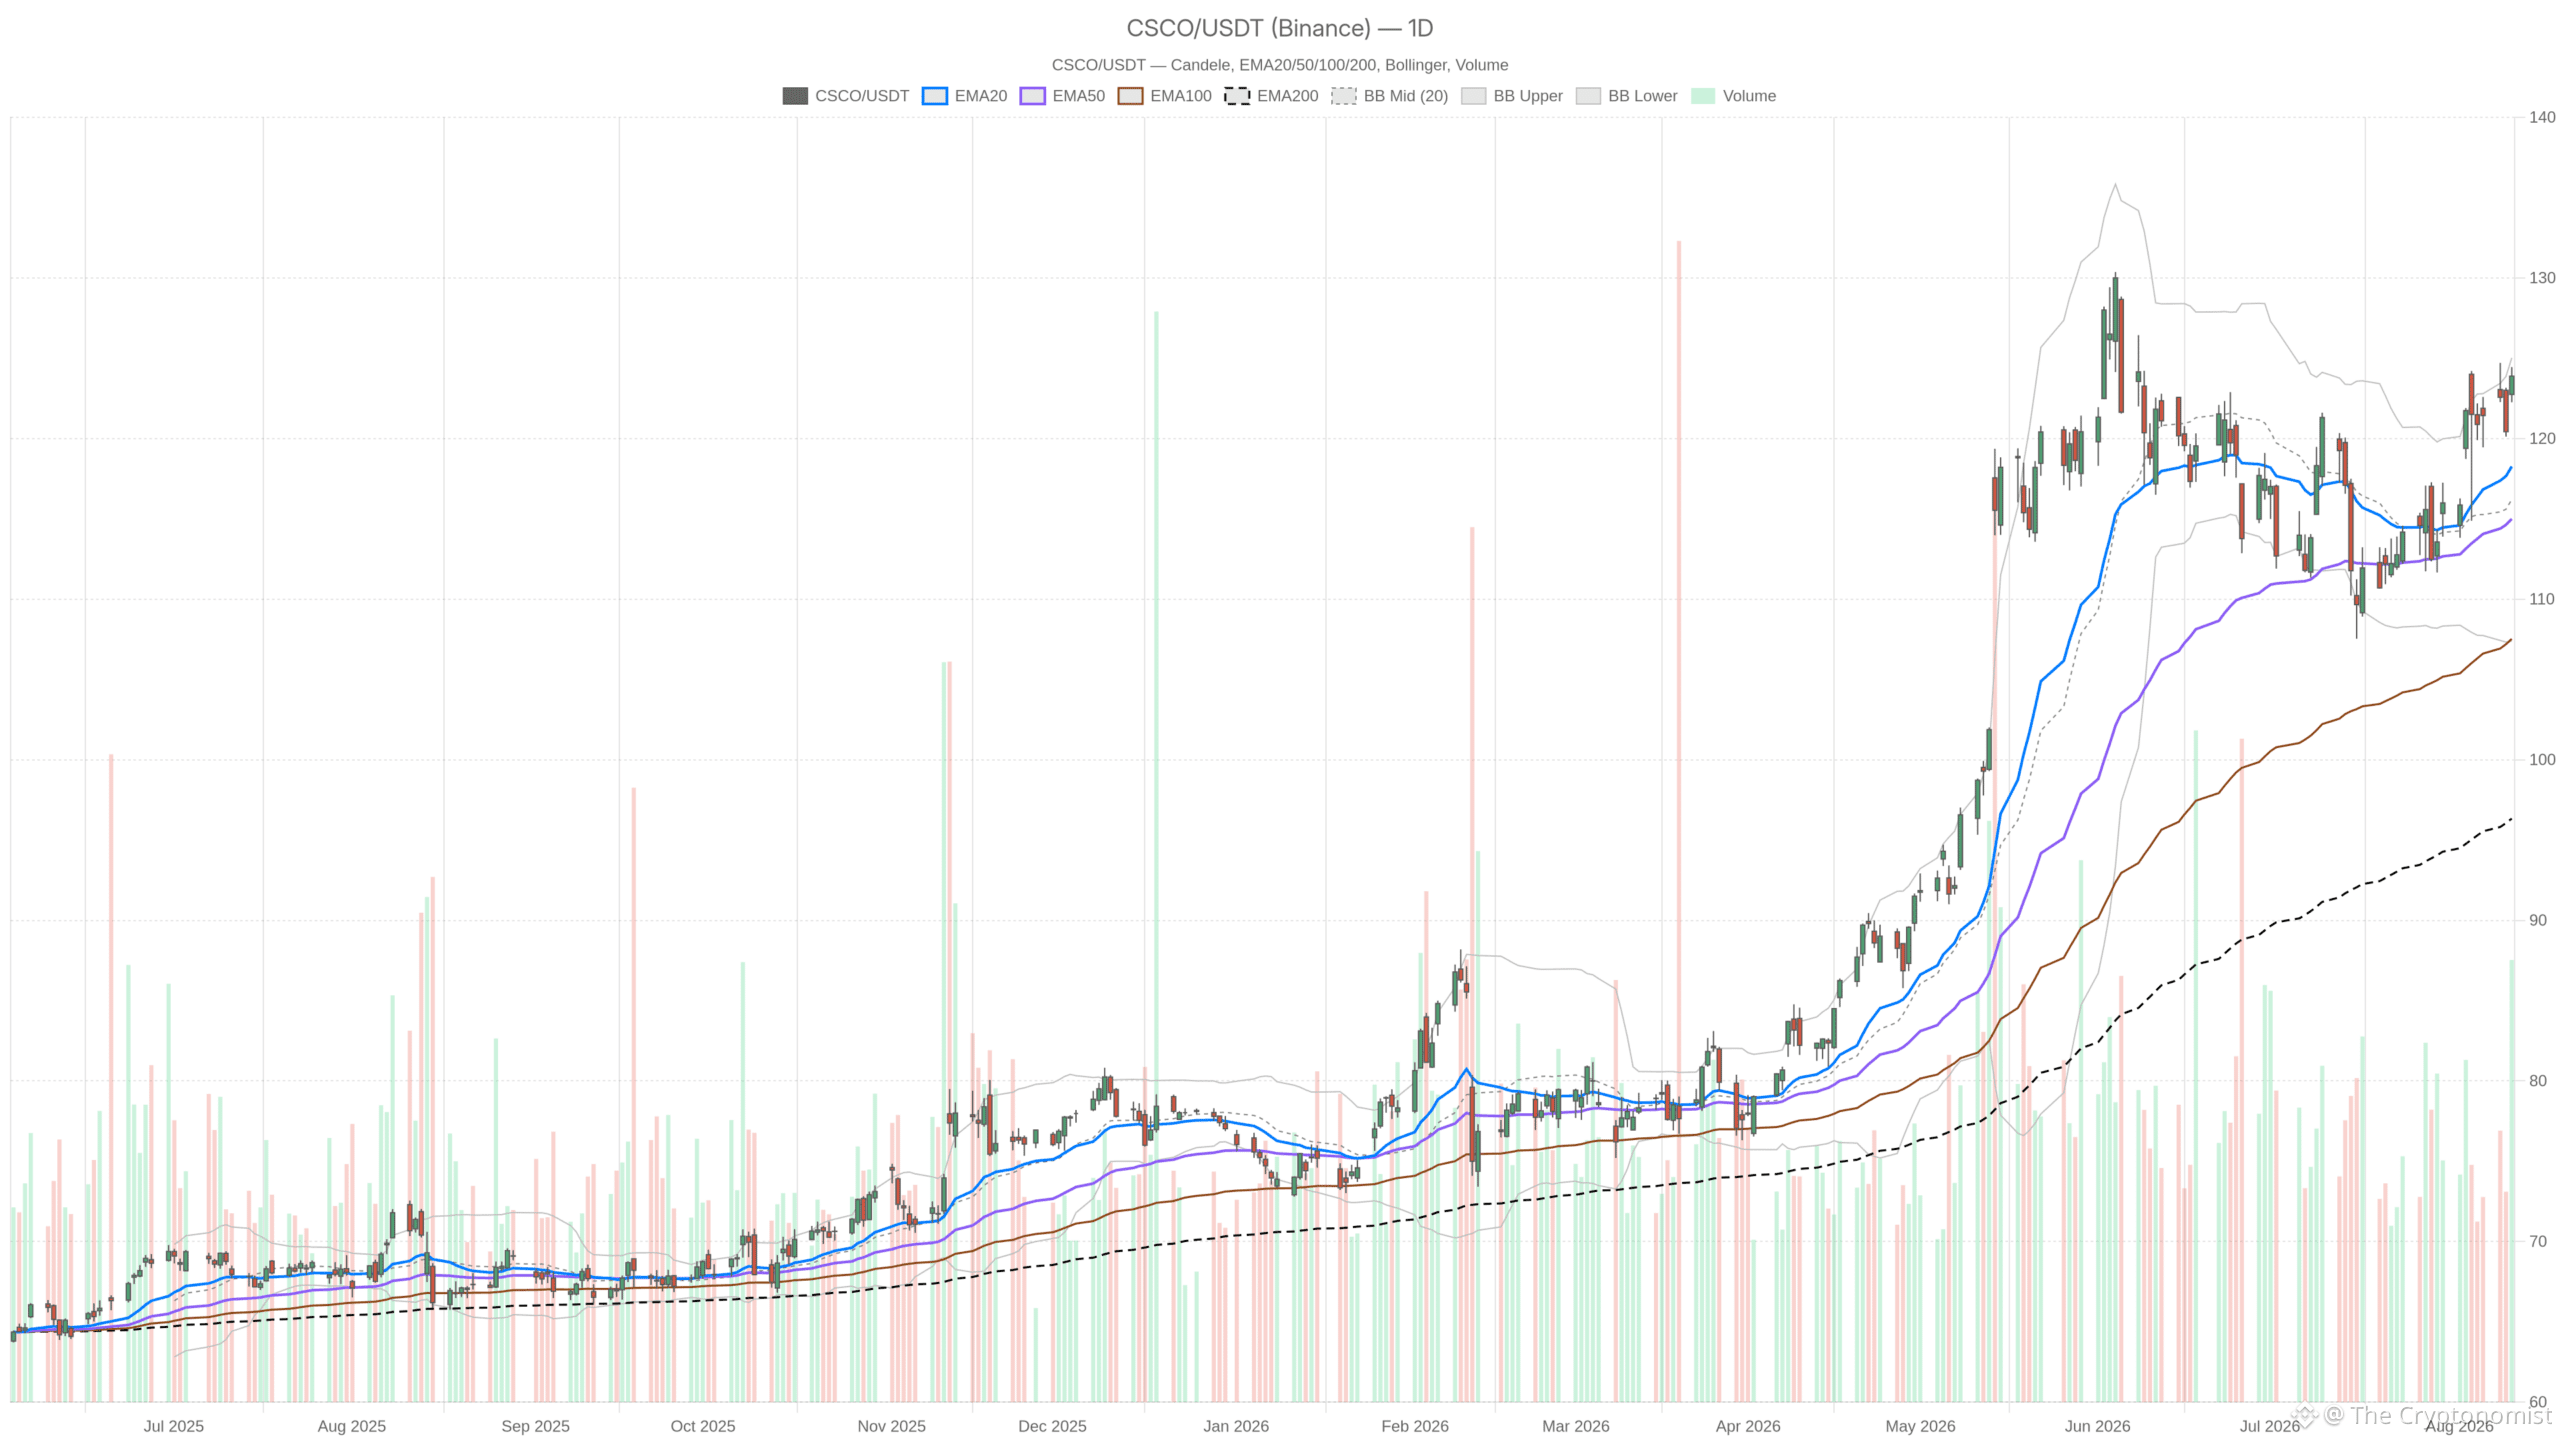 CSCO — daily chart with candlesticks, EMA20/EMA50 and volume.
Key takeaways
Cisco Systems, Inc. stock closed at $123.88 on August 12, trading above the 20-day EMA at $118.26 and the 50-day EMA at $114.99.
Daily RSI14 reads 62.98, signaling bullish momentum without yet reaching overbought extremes.
The MACD histogram on the daily chart is expanding at 0.91, confirming strengthening trend momentum.
Post-earnings after-hours selling emerged despite a beat-and-raise quarter, creating tension with the bullish chart structure.
A break below daily support at $122.61 would invalidate the near-term bullish continuation thesis.
Daily Trend Points Higher for Cisco Systems Stock
The daily chart for Cisco Systems stock is unambiguously bullish, with price trading above all three key moving averages in textbook ascending order. The 20-day EMA sits at $118.26, the 50-day at $114.99, and the 200-day all the way down at $96.34. Price trading above all three confirms a well-established uptrend rather than a short-term bounce.
Meanwhile, the daily RSI14 reads 62.98, comfortably in bullish territory but not yet flashing overbought extremes. Momentum is clearly present, yet there is still room before the stock becomes stretched.
Momentum indicators reinforce that trend read. The MACD line stands at 1.92 against a signal line of 1.02, producing a positive histogram of 0.91. That expanding gap shows momentum is strengthening, not fading.
Bollinger Bands show price near the upper band. The mid sits at $116.20, the upper at $125.02, and the lower at $107.39. Closing near the upper band is typical of a trending market rather than a mean-reverting one.
Volatility, measured by ATR14 at 3.94, remains elevated relative to the stock’s typical daily range. This is consistent with a name that has been trending hard rather than drifting. The daily pivot sits at $123.53, with resistance at $124.80 and support at $122.61. Price closing above the pivot and near resistance underscores buyers holding control into the close.
Hourly Momentum Confirms the Bullish Bias
The 1-hour chart reinforces the bullish structure, with CSCO price stacked above the EMA20, EMA50, and EMA200 in the same ascending sequence seen on the daily timeframe. Price closed at $123.92, above the EMA20 at $122.49, the EMA50 at $121.12, and the EMA200 at $117.83. That stacked order mirrors the daily structure and confirms the higher timeframe bias.
RSI14 on the hourly reads 61.30, slightly below the daily reading but still in bullish territory. MACD on the 1-hour is positive as well, with the line at 0.58 above the signal at 0.42, producing a histogram of 0.16. That smaller histogram suggests intraday momentum is positive but less forceful than the broader trend. In other words, the hourly chart supports the bullish case without adding extra conviction.
Bollinger Bands here show mid at $122.58, upper at $125.36, and lower at $119.80, with price trading in the upper half of the band. The hourly pivot sits at $123.72, resistance at $124.26, and support at $123.37. This tight range suggests the market is consolidating just under recent highs.
Execution Context on the 15-Minute Chart
The 15-minute chart confirms the short-term uptrend remains intact, though momentum has cooled slightly into a normal consolidation pattern. Price closed at $123.92, essentially matching the hourly close. The EMA20 at $123.28 sits just below price. Meanwhile, the EMA50 at $122.72 and EMA200 at $121.10 confirm the short-term uptrend even at this granular level.
RSI14 at 59.86 is more neutral than the higher timeframes, hinting that short-term momentum has cooled after the intraday push. The MACD histogram has narrowed to just 0.01, with the line at 0.43 barely above the signal at 0.41. That near-flat reading signals a pause, not a reversal.
This is a normal consolidation pattern within a broader uptrend. It matters mainly for traders looking at entry timing rather than for the overall bias. The 15-minute pivot at $123.75, resistance at $124.21, and support at $123.45 frame a tight intraday range just below the daily resistance zone.
Bullish Scenario: What Could Extend the Cisco Stock Rally
The bullish case for Cisco stock hinges on a decisive break above the $124.80 resistance level, with the upper Bollinger Band at $125.02 serving as the next key test. Continuation above the daily pivot at $123.53 is the first condition. If buyers can push price through the upper band on strong volume, that would reinforce the trending nature of the move rather than signal exhaustion.
A daily close above $124.80, combined with the MACD histogram continuing to expand, would support further upside toward fresh highs. Notably, the news around Cisco’s AI infrastructure orders and expanding networking ambitions adds a fundamental narrative. This was discussed in coverage of its Taipei and Santa Clara conference presentations. If sentiment holds, that narrative could keep buyers engaged.
Bearish Risk: The Post-Earnings Reaction in CSCO
Despite the bullish technical structure, Cisco stock faces real downside risk after the post-earnings after-hours sell-off reported on August 12. Cisco reported fiscal fourth-quarter results after the close that day. According to reporting from Seeking Alpha, the stock sold off in after-hours trading even though both results and guidance topped estimates.
That is a notable disconnect. A beat-and-raise quarter typically supports a stock. Yet the after-hours reaction moved the other way. This suggests the market may be pricing in expectations, valuation, or forward commentary beyond the headline numbers.
This creates a genuine conflict between the technical setup and the immediate post-earnings price action. The charts are unambiguously bullish across daily, hourly, and 15-minute timeframes. However, the news flow points the other way.
If that after-hours selling pressure carries into the next regular session, it could test daily support at $122.61. It could also test the more significant EMA20 level at $118.26. A break below the daily pivot and support zone would invalidate the near-term bullish continuation thesis. This would shift focus toward how much of the AI-driven infrastructure narrative was already priced into the stock ahead of earnings.
Closing Take: Positioning Cisco Systems Stock Into Volatility
Cisco Systems, Inc. stock enters the next session with an unresolved tension: a bullish multi-timeframe structure set against immediate post-earnings selling pressure. Overall, the technical picture is constructive. Trend, momentum, and volatility readings all point in the same direction across every timeframe analyzed.
At the same time, the after-hours sell-off following an earnings beat introduces real uncertainty that the charts alone cannot resolve. Therefore, positioning around current levels should account for the possibility of a gap or elevated volatility once the market fully digests the earnings reaction. With ATR readings already elevated on the daily chart, price swings in either direction should not be surprising. The interplay between technical trend and fundamental reaction will likely determine which force ultimately wins out.
FAQ
Is Cisco Systems stock in a bullish trend right now?
Yes, the daily chart shows a textbook bullish structure. Price sits above the 20-day EMA at $118.26, the 50-day EMA at $114.99, and the 200-day EMA at $96.34. An RSI14 of 62.98 and an expanding MACD histogram of 0.91 support the bullish read without signaling overbought conditions.
What are the key resistance levels for CSCO?
Daily resistance sits at $124.80, with the upper Bollinger Band at $125.02 as the next key hurdle. A decisive close above these levels on strong volume would reinforce the trending nature of the move rather than signal exhaustion.
Why did Cisco stock drop after earnings despite beating estimates?
According to Seeking Alpha reporting, CSCO sold off in after-hours trading on August 12 even though both results and guidance topped estimates. The reaction suggests the market may be pricing in expectations, valuation concerns, or forward commentary that go beyond the headline numbers.
What support levels should traders watch?
Daily support sits at $122.61, with the more significant level at the 20-day EMA of $118.26. A break below this zone on rising volume would invalidate the bullish continuation thesis and shift focus to how much of the AI infrastructure narrative was already priced in.
Disclaimer: This article is for informational purposes only and does not constitute financial advice, an investment recommendation, or a solicitation to buy or sell any financial instrument or cryptocurrency. The analysis provided is not indicative of future results. Investing in crypto assets and financial markets carries a high risk of capital loss. Always do your own research (DYOR) and consult a qualified financial advisor before making any decision.
Article produced with the assistance of artificial intelligence and reviewed by the editorial team.