


Boxlight Corporation stock delivered one of its most violent sessions in recent memory. It opened at $4.57, spiked to $9.89, and settled at $7.86. Volume told the story: 61,279,802 shares changed hands, dwarfing any normal trading day for this name.
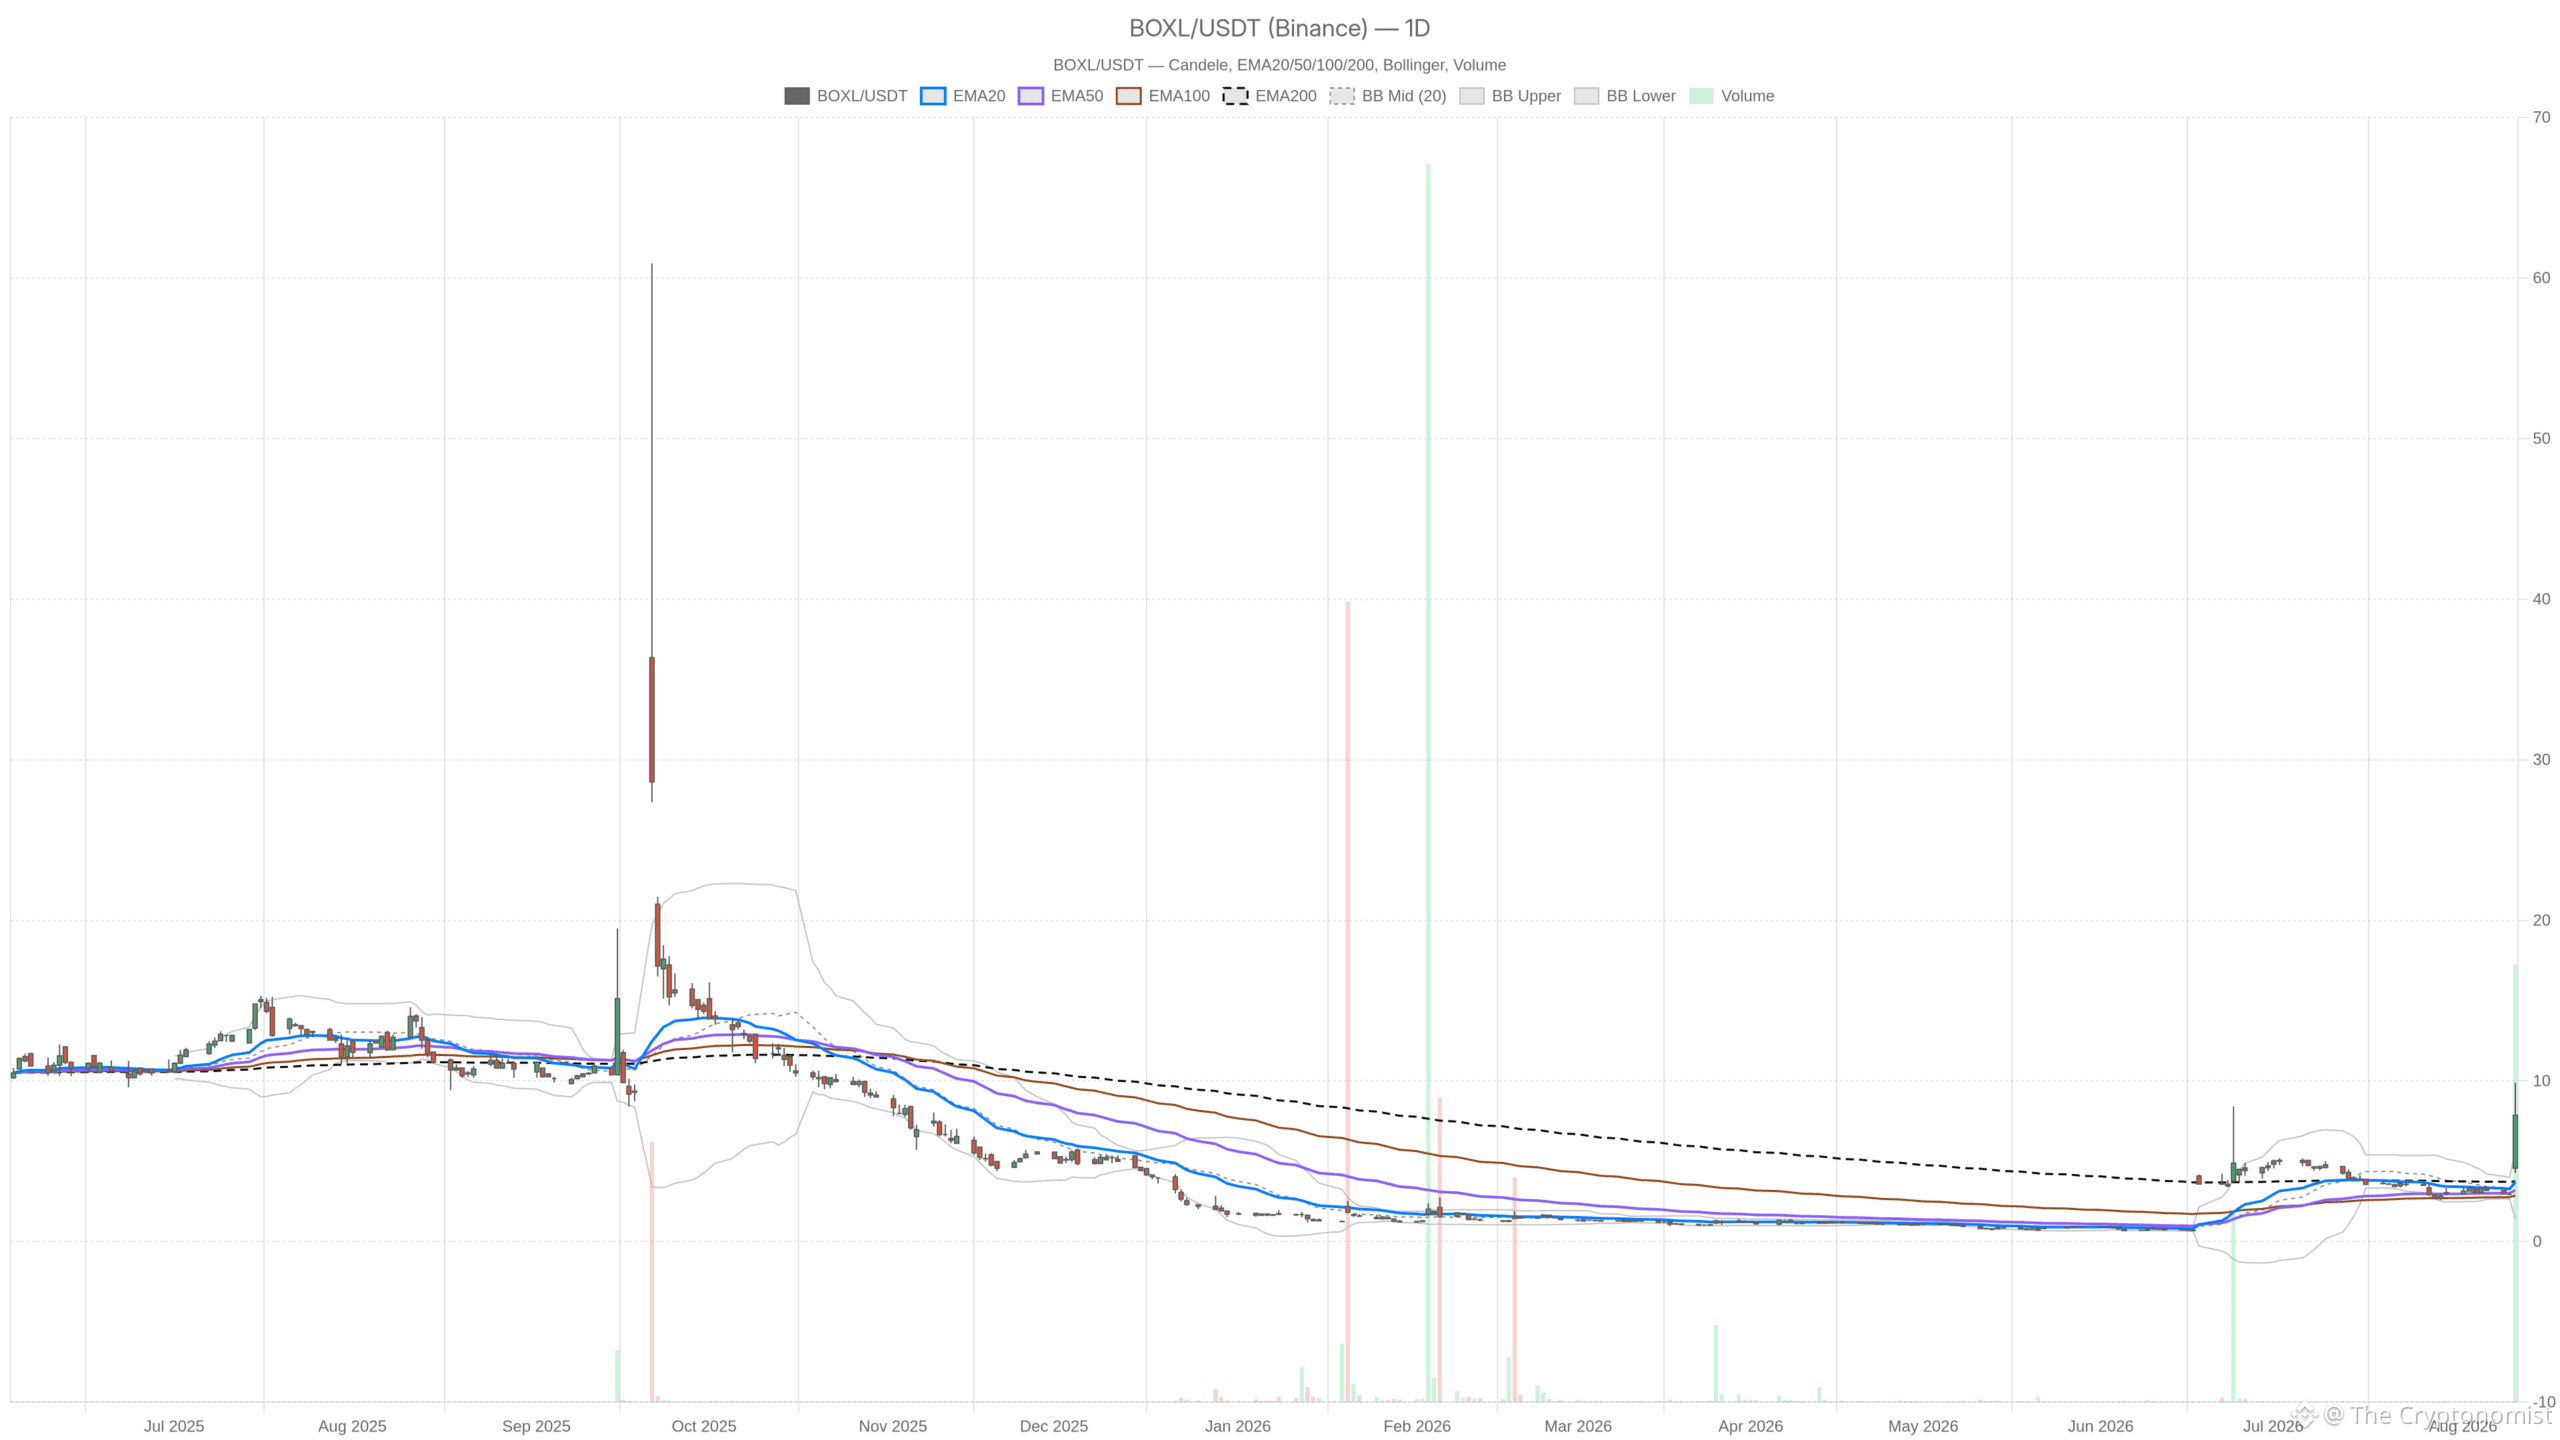 BOXL — daily chart with candlesticks, EMA20/EMA50 and volume.
Key takeaways
Boxlight Corporation stock surged to a session high of $9.89 before settling at $7.86, essentially doubling off its recent base.
Record volume of 61,279,802 shares confirmed extraordinary participation behind the move.
Daily RSI14 reached 81.28, deep in overbought territory, while price traded far outside Bollinger Bands.
Price closed below the hourly pivot of $8.39, signaling early exhaustion after testing the highs.
Daily ATR of 0.80 dramatically understates the actual $5.60+ session range, pointing to elevated two-way risk.
Boxlight Corporation Stock Daily Structure Points to Extreme Extension
Boxlight Corporation stock is trading at an extreme extension on the daily chart. Price closed roughly double all major moving averages.
On the daily timeframe, price closed at $7.86. Meanwhile, the EMA20 sits at $3.71, the EMA50 at $3.20, and the EMA200 at $3.75. In other words, the stock is trading roughly double its short-, medium-, and long-term moving averages. That is not a trend continuation pattern. It is a vertical dislocation.
Bollinger Bands reinforce that view. The upper band stands at $5.59. This means the closing price of $7.86 is trading well outside the band entirely. RSI14 confirms the extreme reading at 81.28, deep into overbought territory.
Momentum, measured by MACD, remains technically bullish. It reads 0.28 against a signal of 0.03, with a histogram of 0.25. Still, bullish MACD combined with an 81 RSI and a price far outside its bands signals an overextended move. It is not a healthy trend.
ATR14 on the daily chart reads just 0.80. Yet the actual session range spanned from $4.28 to $9.89, a swing of more than $5.60. That mismatch alone shows how far this move has outrun its own historical volatility. Meanwhile, the daily pivot sits at $7.34, with resistance at $10.41 and support at $4.79. Price closing between the pivot and R1 keeps the bullish tone intact for now. However, the room below toward S1 is significant.
1H Timeframe: Momentum Holds, But Cracks Appear
The hourly chart shows Boxlight Corporation stock momentum still intact, but cracks are appearing after price retreated from the $9.89 session high.
The hourly chart adds nuance. Boxlight opened the hour at $9.03, pushed to a high of $9.89, then dropped to $7.41 before closing at $7.86. That retreat from the session high deserves attention.
EMA structure on the 1H remains stacked bullish. The EMA20 sits at $4.58, EMA50 at $3.83, and EMA200 at $3.83. RSI14 reads 76.4, still overbought but slightly cooler than the daily figure. MACD stays firmly positive, with the line at 0.95 versus a signal of 0.42 and a histogram of 0.53. Momentum has not broken down.
The Bollinger upper band on this timeframe sits at $7.31. The close at $7.86 remains above it, meaning the stretch persists even after the pullback.
A more telling detail is the pivot level. The 1H pivot is $8.39, with R1 at $9.36 and S1 at $6.88. Price closing at $7.86 means Boxlight is now trading below its hourly pivot. In contrast to the daily chart, which still holds above its pivot, the hourly structure shows early signs of exhaustion after testing the highs.
15-Minute Execution Context
The 15-minute chart shows consolidation rather than continuation, with price trading almost exactly at its own pivot.
Zooming into the 15-minute chart, the picture becomes more contained. The candle opened at $7.97, ranged between $7.41 and $8.39, and closed at $7.86. This is consolidation, not continuation.
EMA alignment here is genuinely bullish. The EMA20 sits at $5.98, EMA50 at $4.80, and EMA200 at $3.85, properly stacked in ascending order. That structure aligns with the explicit bullish regime tag on this timeframe. RSI14 has cooled further to 72.31. The MACD histogram has narrowed to 0.31 from 0.53 on the hourly, signaling short-term momentum deceleration even though it remains positive.
Notably, the 15-minute close of $7.86 sits below its own upper Bollinger Band of $8.41. Price has actually pulled back inside its bands on this timeframe, contrasting with the daily and hourly charts. The 15-minute pivot is $7.89, with R1 at $8.36 and S1 at $7.38. This places the current price almost exactly at the 15-minute pivot, in a tight decision zone.
Bullish Scenario for Boxlight Corporation Stock
The bullish case for Boxlight Corporation stock rests on momentum that has not yet cracked across any timeframe.
MACD remains positive across all three timeframes. The daily close still sits above its pivot of $7.34, within striking distance of R1 at $10.41. If buyers can defend the hourly pivot near $8.39 and hold the 15-minute support at $7.38, a renewed push toward the daily resistance zone becomes plausible.
The sheer volume behind this move, over 61 million shares, suggests real participation rather than a thin, easily reversed spike. Should price reclaim the hourly high near $9.89 and hold above the 15-minute pivot, momentum traders would likely view that as confirmation of further upside toward the daily R1 level.
Bearish Scenario and What Would Invalidate the Bullish Case
The bearish case centers on extreme overbought conditions and early warning signs on the hourly chart that could trigger sharp mean reversion.
The risk of mean reversion here is substantial. RSI readings of 81.28 on the daily and 76.4 on the hourly are both firmly in overbought territory. Price on both timeframes is trading well outside its respective upper Bollinger Band. That combination rarely resolves cleanly higher without at least a sharp corrective pullback.
The hourly chart already shows a warning sign. Price fell from a high of $9.89 down to $7.86, dropping below its own pivot of $8.39. Therefore, a failure to reclaim that hourly pivot would tilt the near-term balance toward sellers. The same applies to a break below the 15-minute support at $7.38.
A deeper breakdown through the daily S1 at $4.79 would open the door toward the EMA20 at $3.71 and the Bollinger mid-band at $3.50. Those levels represent a large air pocket given how far price has run from its EMA50 of $3.20 and EMA200 of $3.75.
Closing Take on Boxlight Corporation Stock
Boxlight Corporation stock is caught between explosive momentum and extreme technical extension, with pivot levels across all timeframes serving as the key battlegrounds.
Daily and hourly indicators still lean bullish on trend and momentum. Yet RSI and Bollinger readings across every timeframe point to conditions that are historically unstable. Meanwhile, the 15-minute chart shows the market pausing to digest the move, trading almost exactly at its own pivot.
ATR readings of 0.80 on the daily, 0.84 on the hourly, and 0.88 on the 15-minute chart all understate what actually occurred. The daily range exceeded $5.60. That gap between stated volatility and realized volatility is itself a signal. Positioning around such a stretched move carries elevated two-way risk. The pivot levels across all three timeframes will likely serve as the key battlegrounds for whatever comes next.
FAQ
What do the overbought RSI readings mean for Boxlight Corporation stock?
The daily RSI14 at 81.28 and hourly RSI14 at 76.4 are both firmly in overbought territory, signaling the stock has moved too far, too fast. Historically, such extreme readings rarely resolve cleanly higher without at least a sharp corrective pullback, especially when combined with price trading outside Bollinger Bands.
What are the key support and resistance levels to watch?
On the daily chart, resistance sits at $10.41 (R1) and support at $4.79 (S1). The hourly pivot at $8.39 is a critical near-term level. The 15-minute pivot at $7.89 and support at $7.38 serve as immediate decision zones. A break below $7.38 would shift the near-term balance toward sellers.
How significant is the volume behind this move?
Volume reached 61,279,802 shares, an extraordinary figure that dwarfs normal trading activity for Boxlight Corporation stock. This level of participation suggests real conviction behind the move rather than a thin, easily reversed spike.
What would invalidate the bullish case?
A failure to reclaim the hourly pivot at $8.39 or a break below the 15-minute support at $7.38 would weaken the bullish case. A deeper breakdown through the daily S1 at $4.79 would open the door toward the EMA20 at $3.71 and the Bollinger mid-band at $3.50, levels that represent a substantial air pocket given the stock’s current elevation.
Disclaimer: This article is for informational purposes only and does not constitute financial advice, an investment recommendation, or a solicitation to buy or sell any financial instrument or cryptocurrency. The analysis provided is not indicative of future results. Investing in crypto assets and financial markets carries a high risk of capital loss. Always do your own research (DYOR) and consult a qualified financial advisor before making any decision.
Article produced with the assistance of artificial intelligence and reviewed by the editorial team.