[12. August Bitcoin-Chartanalyse]
BTCUSD 30Min Chart
*Meine Analyse ist für TradingView optimiert.
Wenn du die Wiedergabetaste drückst, kannst du die Bewegungen in Echtzeit überprüfen.
-Long-Position-Strategie-
Der CPI-Indikator wird in Kürze um 9:30 Uhr veröffentlicht.
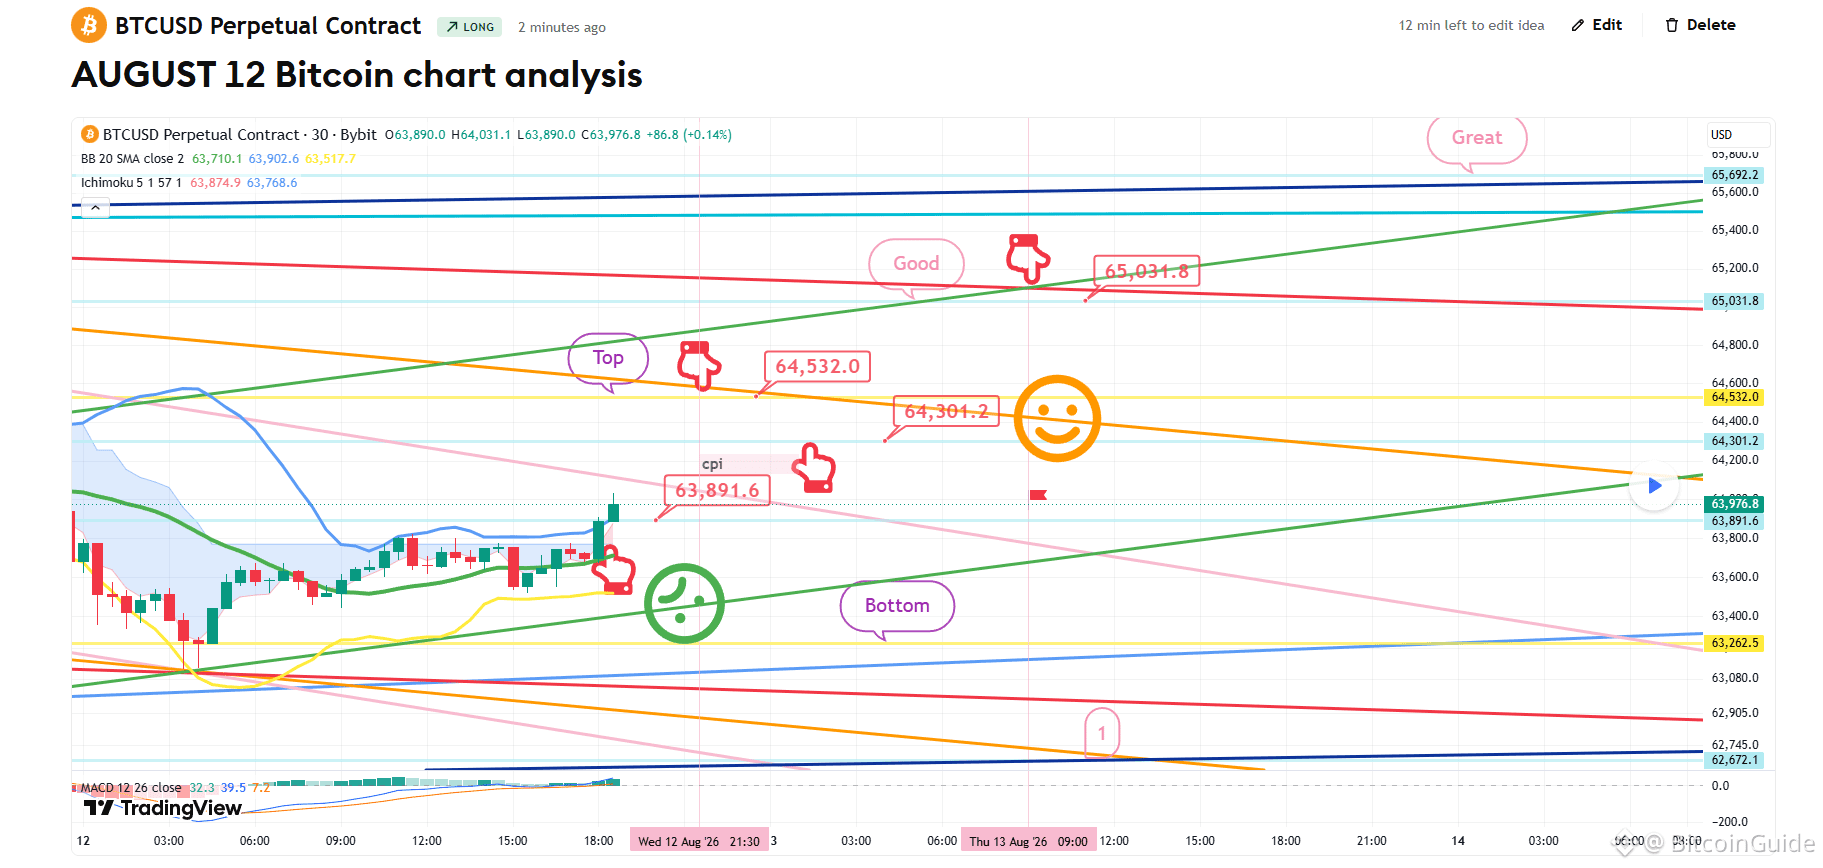
*Dies ist eine Long-Position-Strategie, um dem Preis zu folgen, indem der Bewegungsweg des roten Fingers nachgezeichnet wird.
1) Einstieg für die Long-Position bei 63.891,6 $ / Stop-Loss, falls die grüne Unterstützungs-Linie durchbrochen wird.
2) 1. Ziel für die Long-Position bei 64.532 $ -> gutes 2. Ziel.
- Wenn die Strategie erfolgreich ist, nutze den Bereich von 64,3K, um erneut in die Long-Position einzusteigen.
- Endzielpreis für den großen Bereich nach morgen.
Wenn die grüne Unterstützungs-Linie durchbrochen wird,
Bitte sei vorsichtig, da der Boden bis zur 1. Zone offen ist.
Angesichts der kürzlichen Beteiligungsrate und der heißen Wetterlage: Wenn heute ein Stop-Loss eintritt, mache ich diese Woche eine Pause vom Veröffentlichen von Analyseartikeln.
Ich poste die Analyseergebnisse jeden Tag als Kommentar.
Vielen Dank.
(Du findest den Link auf meinem Profil.)
- Klicke auf „Folgen“, um jeden Tag schnellere Informationen zu erhalten.
- Prüfe die Ergebnisse mit der Wiedergabe-Schaltfläche auf TradingView.
#BTC100K #Altcoin Season# #BTC Price Analysis# #BNBChain# $BTC $ETH $USDT $ALT $XRP
BTCUSD 30Min Chart
*Meine Analyse ist für TradingView optimiert.
Wenn du die Wiedergabetaste drückst, kannst du die Bewegungen in Echtzeit überprüfen.
-Long-Position-Strategie-
Der CPI-Indikator wird in Kürze um 9:30 Uhr veröffentlicht.
*Dies ist eine Long-Position-Strategie, um dem Preis zu folgen, indem der Bewegungsweg des roten Fingers nachgezeichnet wird.
1) Einstieg für die Long-Position bei 63.891,6 $ / Stop-Loss, falls die grüne Unterstützungs-Linie durchbrochen wird.
2) 1. Ziel für die Long-Position bei 64.532 $ -> gutes 2. Ziel.
- Wenn die Strategie erfolgreich ist, nutze den Bereich von 64,3K, um erneut in die Long-Position einzusteigen.
- Endzielpreis für den großen Bereich nach morgen.
Wenn die grüne Unterstützungs-Linie durchbrochen wird,
Bitte sei vorsichtig, da der Boden bis zur 1. Zone offen ist.
Angesichts der kürzlichen Beteiligungsrate und der heißen Wetterlage: Wenn heute ein Stop-Loss eintritt, mache ich diese Woche eine Pause vom Veröffentlichen von Analyseartikeln.
Ich poste die Analyseergebnisse jeden Tag als Kommentar.
Vielen Dank.
(Du findest den Link auf meinem Profil.)
- Klicke auf „Folgen“, um jeden Tag schnellere Informationen zu erhalten.
- Prüfe die Ergebnisse mit der Wiedergabe-Schaltfläche auf TradingView.
#BTC100K #Altcoin Season# #BTC Price Analysis# #BNBChain# $BTC $ETH $USDT $ALT $XRP