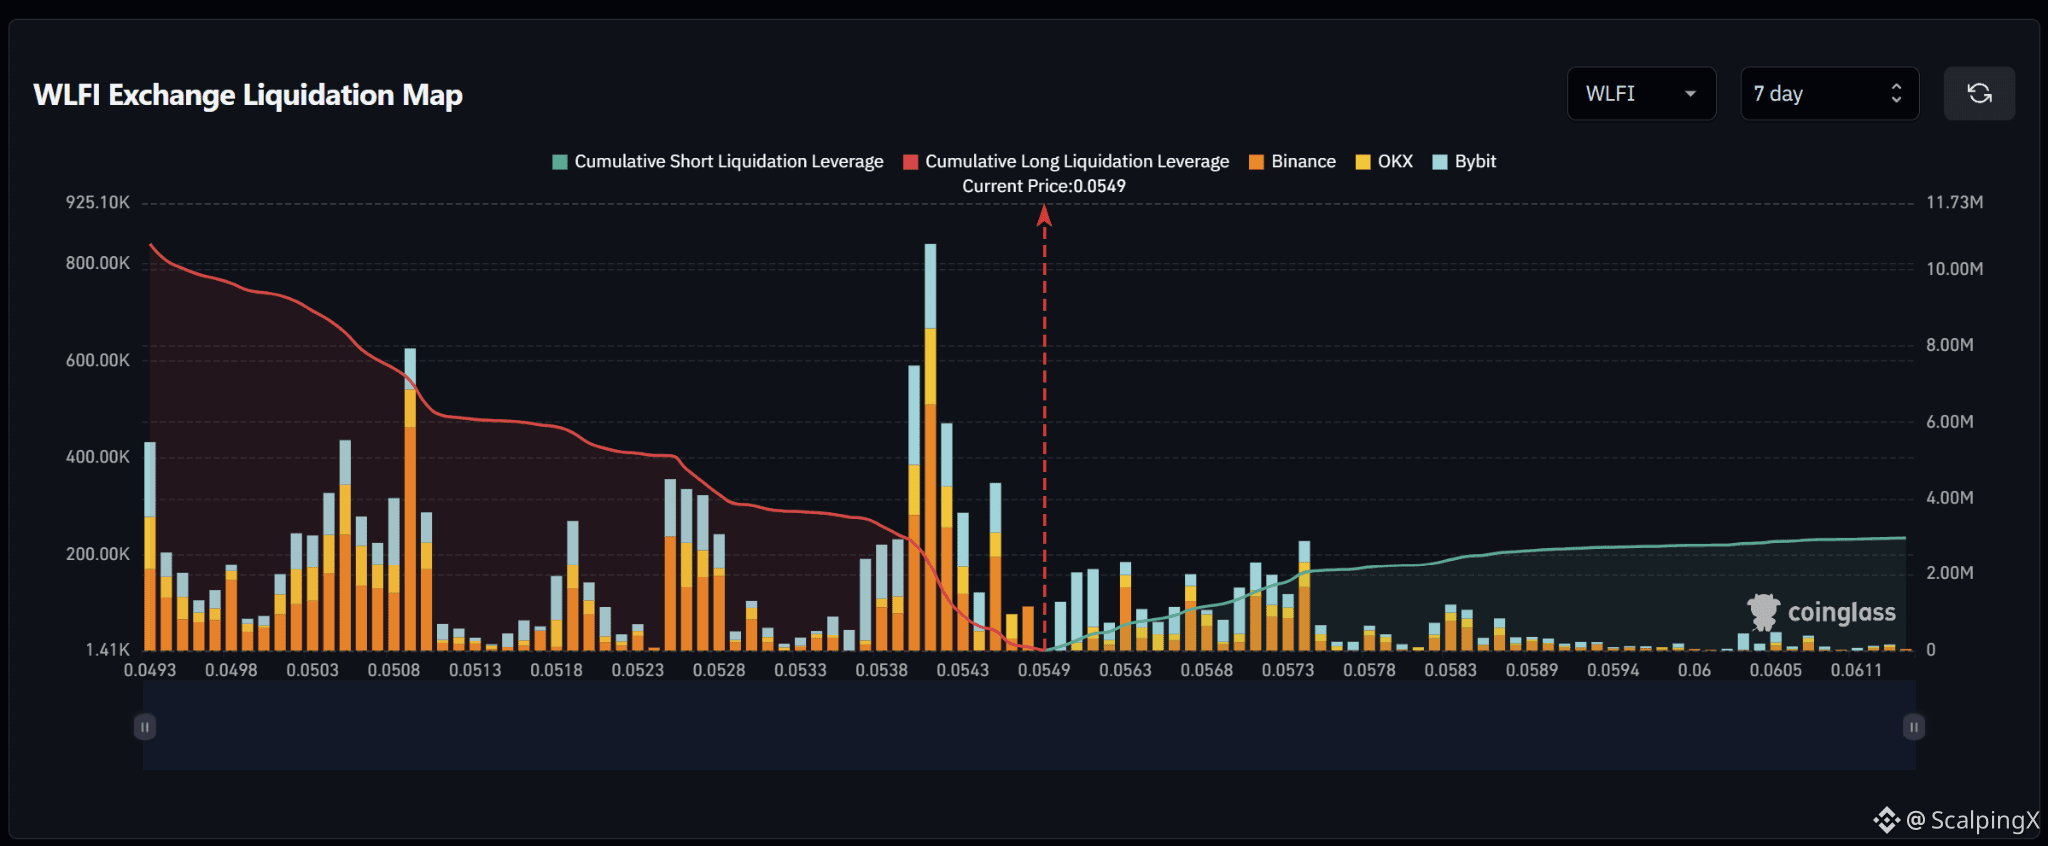
$WLFI – Liquidationskarte (7 Tage) – Aktueller Preis 0.0549
🔎 Die 7-Tage-Liquidationskarte zeigt ungefähr 10–11 Millionen bei Long-Liquidationen unter dem aktuellen Preis, deutlich mehr als etwa 2,5–3 Millionen bei Short-Liquidationen oberhalb. Die gesamte Liquiditätsstruktur tendiert daher klar nach unten, wobei sich ein großer Cluster zudem relativ nahe am Preis befindet.
📉 Unterhalb des Marktes steigt die Dichte der Long-Liquidationen deutlich an, über den Bereich 0.0543–0.0538 hinweg. Die stärkste Konzentration liegt bei 0.0540–0.0542, wo sich einige der größten Balken auf der Karte befinden. Wenn 0.0543 verloren geht, würde das die Wahrscheinlichkeit eines Sweeps hin zu 0.0540–0.0538 spürbar erhöhen. Weiter darunter bleibt 0.0528–0.0523 eine weitere bemerkenswerte Zone.
📈 Oberhalb des Marktes beginnt die Liquidität für Short-Liquidationen sich ab 0.0553–0.0563 aufzubauen und wird dichter über 0.0568–0.0573. Der prominenteste nahegelegene Aufwärts-Cluster sitzt bei rund 0.0573. Wenn man über 0.0549 hält und 0.0563 nach oben bricht, könnte sich der Fokus hin zu 0.0568–0.0573 verschieben.
🧭 Das wahrscheinlichere Szenario ist ein erster Test von 0.0543–0.0538, weil die Downside-Liquidität sowohl deutlich größer als auch relativ nah ist. Umgekehrt würde das Halten der aktuellen Levels und das Brechen über 0.0563 den Fokus auf einen Short-Liquidation-Sweep über 0.0568–0.0573 verlagern.
#LiquidationMap
🔎 Die 7-Tage-Liquidationskarte zeigt ungefähr 10–11 Millionen bei Long-Liquidationen unter dem aktuellen Preis, deutlich mehr als etwa 2,5–3 Millionen bei Short-Liquidationen oberhalb. Die gesamte Liquiditätsstruktur tendiert daher klar nach unten, wobei sich ein großer Cluster zudem relativ nahe am Preis befindet.
📉 Unterhalb des Marktes steigt die Dichte der Long-Liquidationen deutlich an, über den Bereich 0.0543–0.0538 hinweg. Die stärkste Konzentration liegt bei 0.0540–0.0542, wo sich einige der größten Balken auf der Karte befinden. Wenn 0.0543 verloren geht, würde das die Wahrscheinlichkeit eines Sweeps hin zu 0.0540–0.0538 spürbar erhöhen. Weiter darunter bleibt 0.0528–0.0523 eine weitere bemerkenswerte Zone.
📈 Oberhalb des Marktes beginnt die Liquidität für Short-Liquidationen sich ab 0.0553–0.0563 aufzubauen und wird dichter über 0.0568–0.0573. Der prominenteste nahegelegene Aufwärts-Cluster sitzt bei rund 0.0573. Wenn man über 0.0549 hält und 0.0563 nach oben bricht, könnte sich der Fokus hin zu 0.0568–0.0573 verschieben.
🧭 Das wahrscheinlichere Szenario ist ein erster Test von 0.0543–0.0538, weil die Downside-Liquidität sowohl deutlich größer als auch relativ nah ist. Umgekehrt würde das Halten der aktuellen Levels und das Brechen über 0.0563 den Fokus auf einen Short-Liquidation-Sweep über 0.0568–0.0573 verlagern.
#LiquidationMap