
📰 Daily Market Update:
Ethereum’s derivatives market is sending mixed signals.
While momentum indicators are flashing green, net taker volume on Binance is turning sharply negative
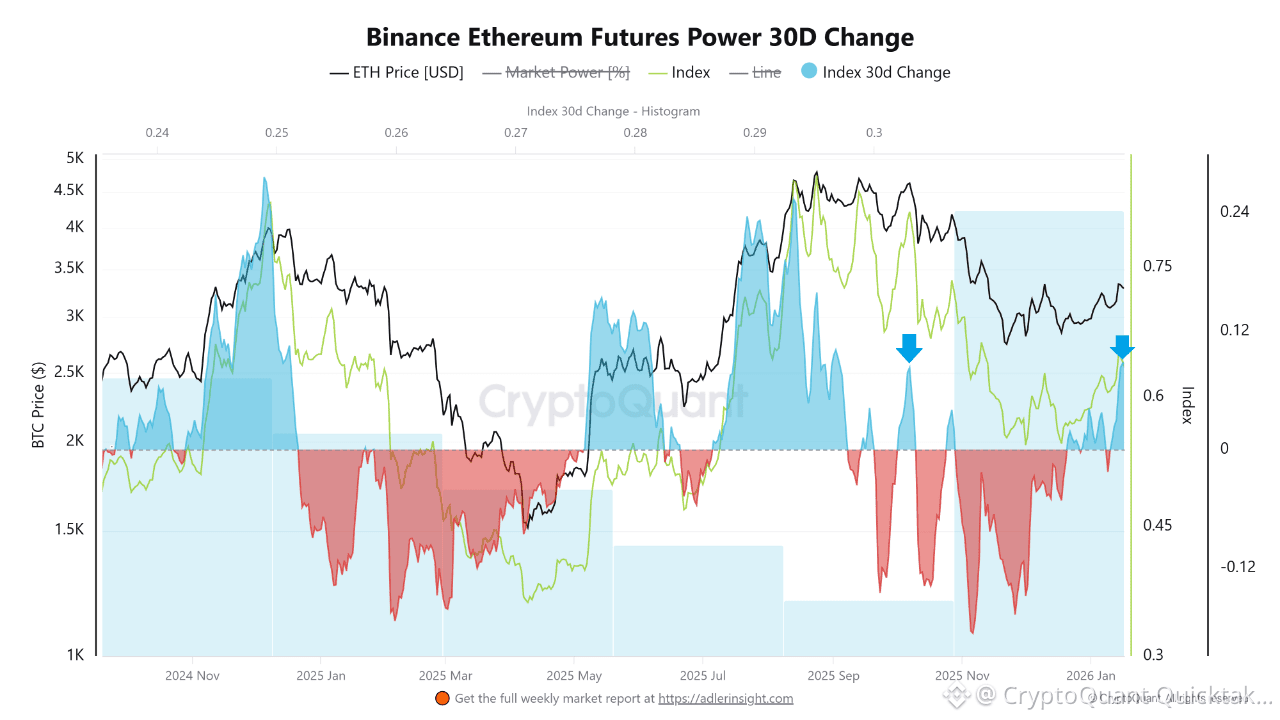
📊 Binance Ethereum Futures Power – 30D Change
🔍 New Index ( light green )
A composite indicator that combines price action with derivatives market momentum to measure the true strength of a trend — not just a superficial price move.
🔍 Index 30D Change
The difference between today’s composite index value and its level 30 days ago. It reflects the real change in market momentum across price, derivatives, and liquidity. This metric shows how much market strength has improved or weakened, expressed as index points rather than percentages.
🔬 Key Observation
The chart highlights a clear increase in the 30D Index Change for Ethereum derivatives momentum on Binance.
📆 On January 16, the Index 30D Change reached +0.088
📆 The last time we saw similar levels was October 7
⏲️ Back then, ETH was trading above $4,600
Index value reached 0.083
📉 After that October signal, Ethereum price dropped nearly -40% in the following weeks.
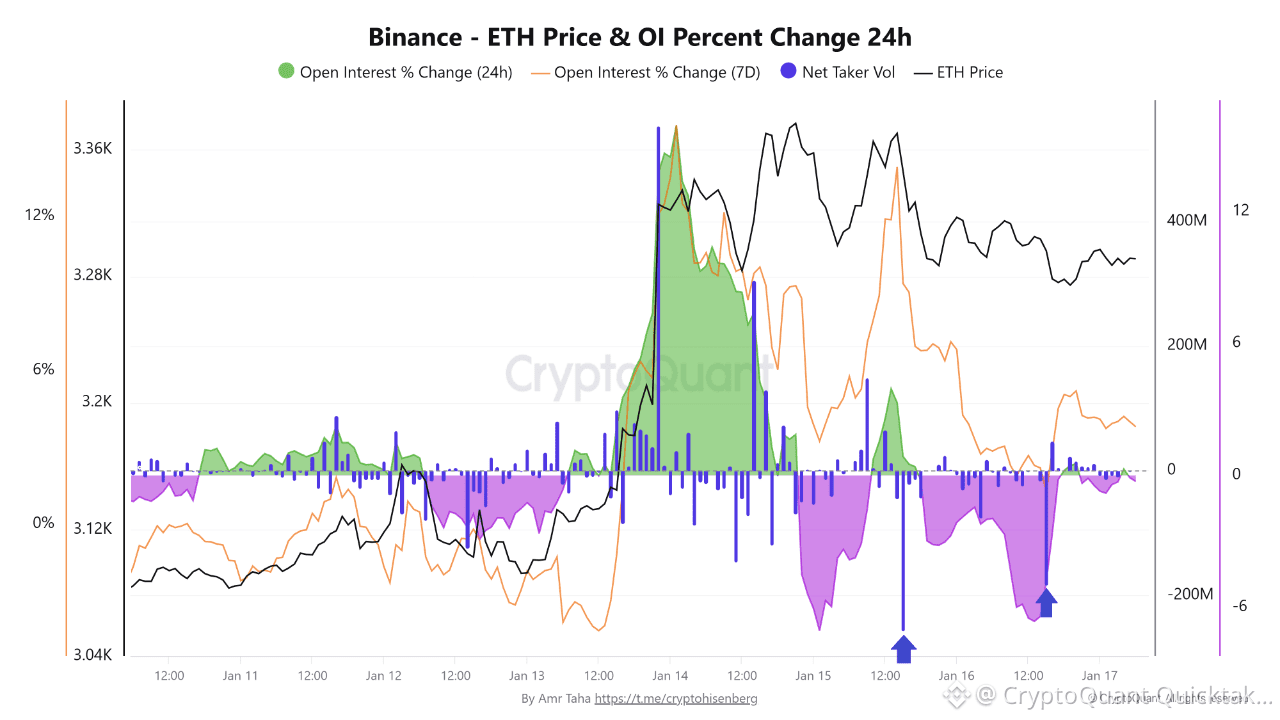
📊 Binance – ETH Price & OI Percent Change 24h / 7D
This chart tracks ETH price, open interest changes, and Net Taker Volume (buy/sell pressure via market orders).
🔬 Key Observation
📆 On Jan 15, Net Taker Volume printed -257M USD.
📆 On Jan 16, it was still negative at -183M USD.
📉 Interpretation:
When negative net taker values increase on Binance derivatives, it often signals that:
A large investor, or a group of investors, has begun opening short positions or closing previous long positions to lock in profits after a strong move.
Written by Amr Taha
