

Eine der schwersten Gewohnheiten, die man als Trader aufbauen muss, ist zu lernen zu warten.
Die aktuelle Chartanalyse deutet darauf hin, dass ETH/USDT weiterhin in einer bärischen Marktstruktur handelt. Das bedeutet: Dem Kurs tiefer hinterherzulaufen könnte nicht die beste Chance-Risiko-Möglichkeit bieten. Stattdessen liegt der Fokus darauf, zu warten, bis der Preis in eine stärkere Widerstandszone retraced, bevor man eine Short-Position sucht.
Lass uns einen genaueren Blick darauf werfen.
Aktuelles Marktbild
Ethereum handelt weiterhin innerhalb eines bärischen Trends—basierend auf der neuesten technischen Analyse.
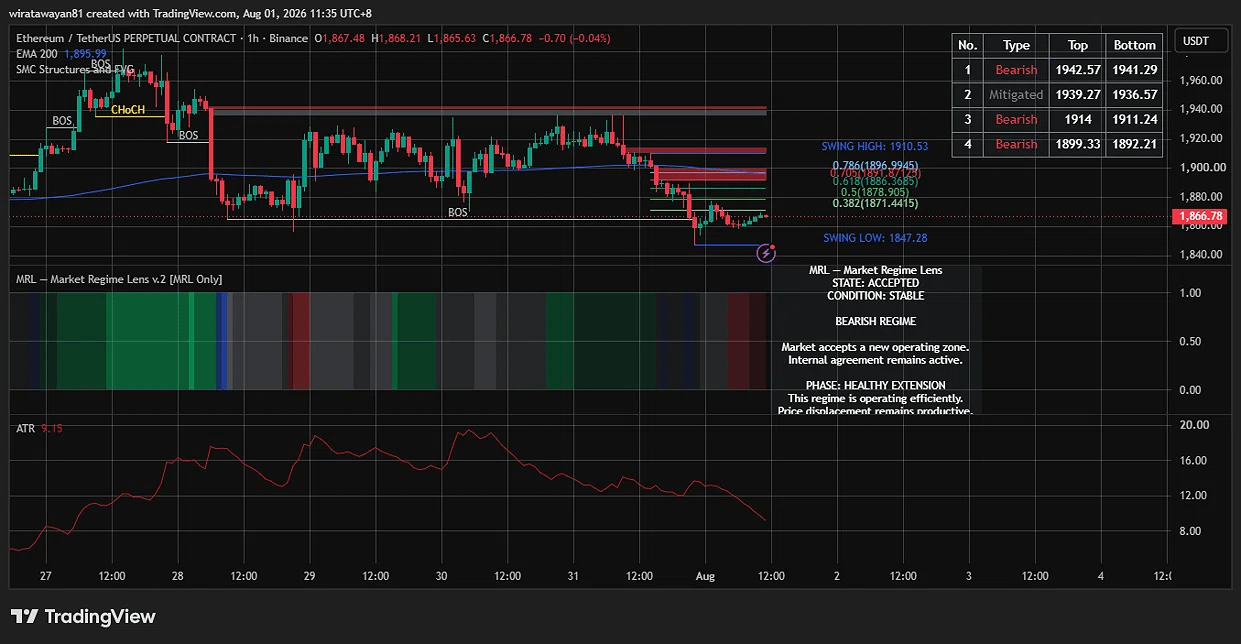
Der Market Regime Lens (MRL) zeigt aktuell:
Regime: Bearish
Status: Akzeptiert
Bedingung: Stabil
Phase: Gesunde Extension
Mit anderen Worten: Die Verkäufer haben weiterhin die Kontrolle. Der Kurs bleibt unter der 200-EMA, und derzeit gibt es keine technischen Anzeichen, die auf eine bestätigte bullische Trendwende hindeuten.
Statt nach einem großen Abwärtsimpuls direkt zu verkaufen, wartet die Strategie geduldig darauf, dass der Preis eine stärkere Widerstandszone erneut anläuft.
Wichtige Marktlevels
Hier sind die wichtigsten Niveaus, die während der Analyse identifiziert wurden:
Aktueller Preis: 1.866,78
EMA 200: 1.895,65
Swing High: 1.910,53
Swing Low: 1.847,28
ATR: 9,15
Derzeit handelt der Kurs zwischen dem letzten Swing-High und dem letzten Swing-Low, was auf eine Pullback-Chance innerhalb des bestehenden bärischen Trends hindeutet—nicht auf den Beginn eines neuen bullischen Trends.
Fair Value Gap (FVG)-Zonen
Mehrere Fair Value Gaps (FVGs) sind weiterhin nicht gemindert und könnten zu wichtigen Reaktionszonen werden, falls der Preis retraced.
Bearishe FVGs
1.941,29 – 1.942,57
1.911,24 – 1.914,00
1.892,21 – 1.899,33
Gemindertes FVG
1.936,57 – 1.939,27
Diese Bereiche werden noch aussagekräftiger, wenn sie mit anderen technischen Tools wie Fibonacci-Levels und gleitenden Durchschnitten übereinstimmen.
Warum die 1.896er-Zone Aufmerksamkeit verdient
Die stärkste technische Konfluenz scheint im Bereich 1.895,65–1.896,99 zu liegen.
Dieser Bereich kombiniert mehrere wichtige technische Faktoren:
Fibonacci-0,786-Retracement
Die 200-EMA
Ein nicht gemindertes Bearish FVG zwischen 1.892,21 und 1.899,33
Wenn mehrere technische Signale auf denselben Preisbereich hindeuten, hat diese Zone typischerweise eine höhere Wahrscheinlichkeit, eine relevante Reaktion auszulösen. Deshalb ist das die bevorzugte Position für ein Limit-Short-Setup.
Einstiegs-Kandidaten
Mehrere mögliche Einstiege wurden mit verschiedenen Validierungsfiltern getestet, darunter:
ATR-Validierung
Chance-Risiko-Verhältnis
Marge-Anforderung
Pullback-Validierung
Stop-Hunting-Schutz
Die Ergebnisse waren:
✅ Bearish FVG (1.892,21) — hat jede Validierung bestanden.
✅ EMA 200 (1.895,65) — hat jede Validierung bestanden.
✅ Fibonacci 0,786 (1.896,99) — hat jede Validierung bestanden.
❌ Alternativer Take Profit bei Fibonacci 0,382 — Chance-Risiko-Verhältnis unter der Mindestanforderung.
❌ Alternativer Take Profit bei Fibonacci 0,500 — Chance-Risiko-Verhältnis unter der Mindestanforderung.
Drei Setups haben erfolgreich alle Anforderungen erfüllt. Da ihre Confidence-Scores sehr nah beieinander lagen (innerhalb von 5%), wurde das Setup mit dem höchsten Chance-Risiko-Verhältnis ausgewählt.
Trading-Setup
Order-Typ
LIMIT ORDER
Richtung
SHORT
Trade-Parameter
Einstieg: 1.896,99 USDT
Stop Loss: 1.913,28 USDT
Take Profit: 1.847,28 USDT
Risiko: 16,29 Punkte
Chance: 49,71 Punkte
Chance-Risiko-Verhältnis: 1 : 3,05
Die geschätzte Wahrscheinlichkeit, dass der Auftrag ausgeführt wird, ist Mittel—basierend auf dem Verhältnis zwischen der erwarteten Pullback-Distanz und der Distanz zum Profit-Ziel.
Warum dieses Setup ausgewählt wurde
Dieses Setup erreichte einen Konfluenz-Score von 90—gestützt durch mehrere unabhängige technische Bestätigungen.
Der Score kommt zustande aus:
+30 — MRL Bearish Accepted
+20 — Smart-Money-Struktur (BOS, Swing High und Swing Low)
+15 — Kurs handelt unter der 200-EMA
+15 — Bearish Fair Value Gap
+10 — Fibonacci-0,786-Retracement
Finaler Konfluenz-Score: 90/100
Während der Analyse wurden keine negativen technischen Faktoren identifiziert.
Risikomanagement
Die unten angezeigte Positionsgröße dient nur zu Illustrationszwecken. Die Berechnungen basieren auf den folgenden Annahmen:
Kontostand: 10.000 USDT
Risiko pro Trade: 1% (100 USDT)
Hebel: 5×
Unter diesen Annahmen ergibt sich die berechnete Positionsgröße:
Positionsgröße: 6,14 ETH
Nominalwert: 11.646,92 USDT
Erforderliche Marge: 2.329,27 USDT
Die erforderliche Marge bleibt innerhalb der vordefinierten Sicherheitsgrenze.
Beachte, dass diese Zahlen nur Beispiele sind. Deine tatsächliche Positionsgröße, die erforderliche Marge und dein potenzieller Verlust sollten immer anhand deines eigenen Kontostands und deiner persönlichen Risikotoleranz berechnet werden, bevor du irgendeinen Trade platzierst. Eine korrekte Positionsdimensionierung ist einer der wichtigsten Bestandteile für langfristigen Handelserfolg.
Trade-Management-Plan
Dieses Setup bietet ein relativ starkes Chance-Risiko-Verhältnis von 3,05, weshalb es sich lohnt, Gewinne zu schützen, sobald der Trade sich in die erwartete Richtung bewegt.
Der vorgeschlagene Trade-Management-Plan ist:
Aktiviere den Trailing-Stop, sobald der Preis 1.880,70 USDT erreicht.
Verwende eine Trailing-Distanz von 0,5R (8,15 Punkte).
Ziehe in Betracht, die Position frühzeitig zu schließen, wenn:
Die MRL-Bedingung wechselt zu STRESSED oder CRITICAL.
Die Marktphase wechselt zu EXTENDED.
Das Take-Profit-Ziel wird erreicht.
Kurze Setup-Zusammenfassung
Instrument: ETH/USDT Perpetual
Zeitrahmen: 1 Stunde
Richtung: SHORT
Order-Typ: LIMIT
Einstieg: 1.896,99
Stop Loss: 1.913,28
Take Profit: 1.847,28
Chance-Risiko-Verhältnis: 1 : 3,05
Positionsgröße: 6,14 ETH
Hebel: 5×
Erforderliche Marge: 2.329,27 USDT
Geschätzte Ausführungswahrscheinlichkeit: Mittel
Konfluenz-Score: 90/100
Finale Gedanken
Der aktuelle Chart begünstigt weiterhin die Verkäufer—aber das heißt nicht, dass ein Einstieg sofort die beste Entscheidung ist.
Anstatt dem Kurs tiefer hinterherzulaufen, hebt diese Analyse eine höher-wahrscheinliche Pullback-Zone hervor, in der mehrere technische Faktoren zusammenfallen. Wenn du wartest, bis der Preis in deinen geplanten Einstieg zurückkehrt, führt das oft zu besserer Trade-Qualität und günstigeren Chance-Risiko-Möglichkeiten als das emotionale Reagieren auf jede Marktbewegung.
Wie immer gehört Geduld zum Strategieansatz.
Haftungsausschluss
Dieser Artikel basiert auf einer Analyse, die von einem KI-System erstellt wurde—unter Verwendung der visuellen Daten, die zum Zeitpunkt der Analyse im Chart verfügbar waren. Der Inhalt dient ausschließlich zu Bildungs- und Informationszwecken und sollte nicht als Finanz- oder Anlageberatung verstanden werden.
Obwohl alle Anstrengungen unternommen wurden, die durch KI generierte Analyse möglichst korrekt darzustellen, sollten Leser immer ihre eigenen faktischen Prüfungen durchführen, bevor sie irgendeine Trading-Entscheidung treffen. Bestätige, dass die in diesem Artikel diskutierte Marktstruktur, die Kursniveaus und die technischen Bedingungen zum Zeitpunkt der Ausführung weiterhin gültig sind. Kryptowährungsmärkte können sich sehr schnell ändern, und die finale Verantwortung für jede Trading-Entscheidung liegt vollständig beim Trader.

