
1H Technical Outlook | July 28, 2026
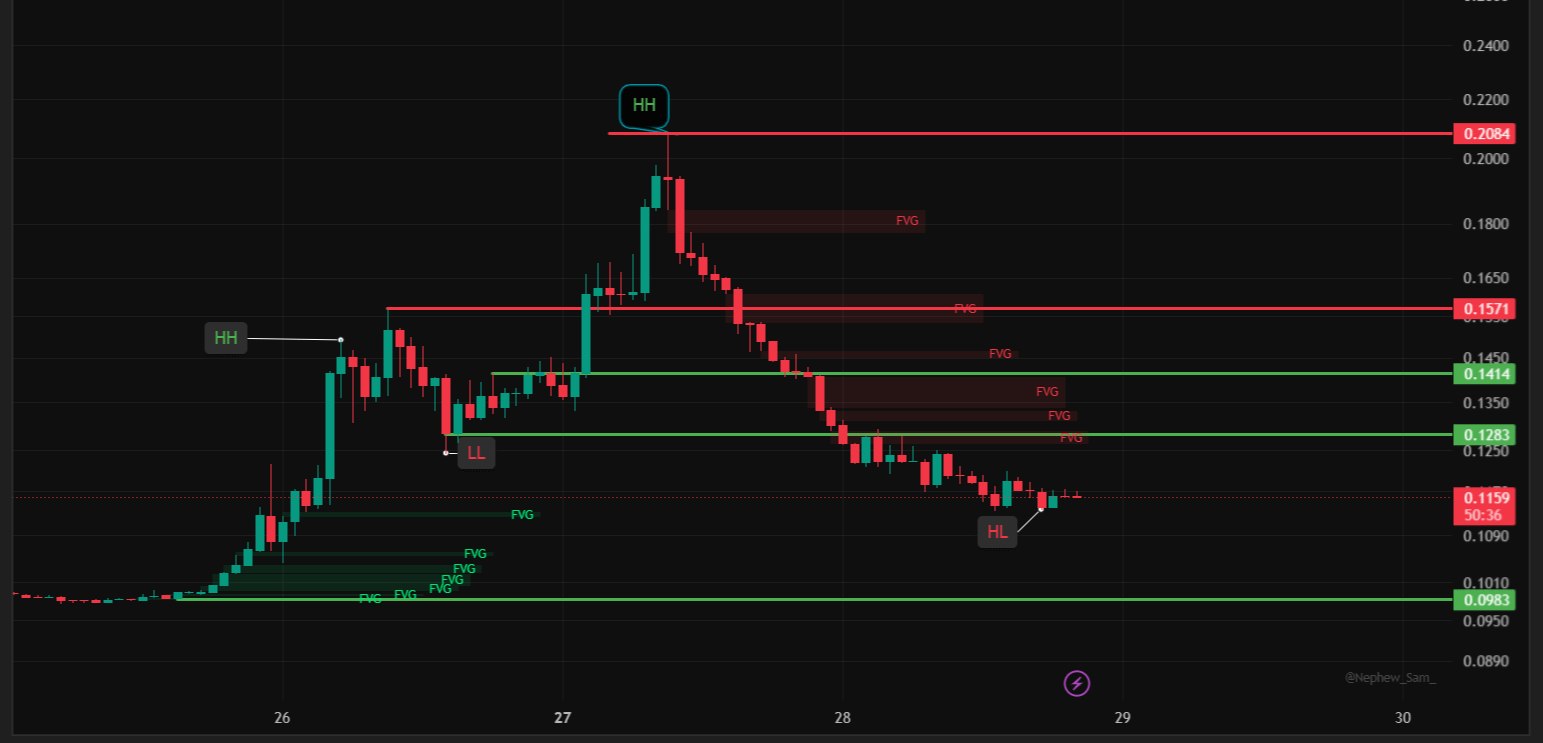
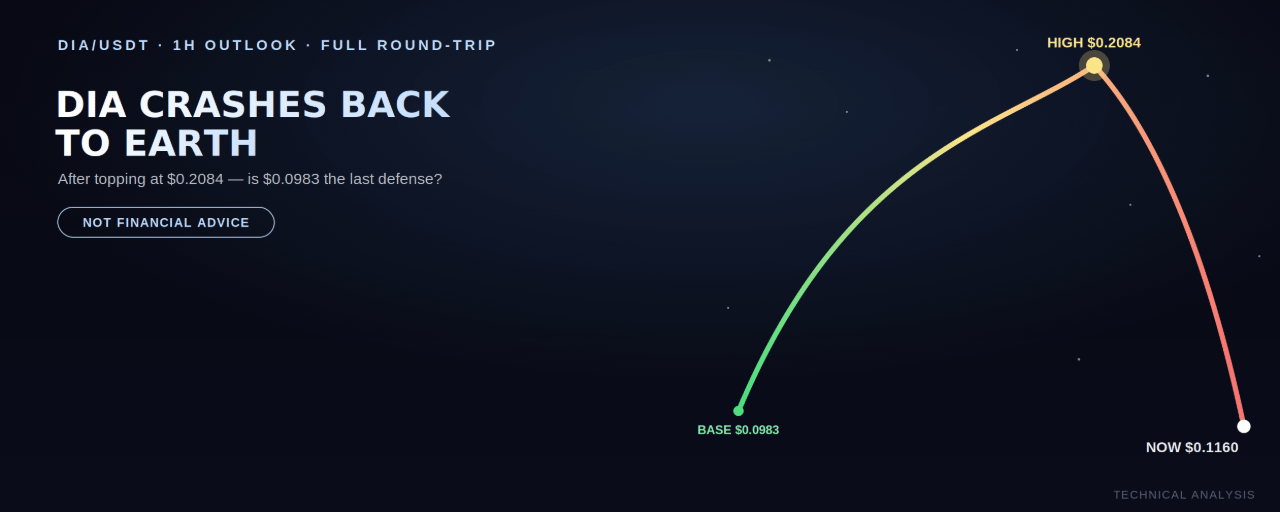
The breakout covered a couple of days ago did extend further than expected — DIA pushed all the way to a fresh high of $0.2084 before gravity took over. Since then, price has given back nearly the entire move, crashing down to a Higher Low near $0.116, where it's now trading flat at $0.1160 (0.00% today).
This article is for educational and informational purposes only. It is not financial advice. DIA has now completed a full round trip from its recent base to a new high and most of the way back down. This kind of move often takes time to stabilize — confirm strength before assuming the worst is over.
What Happened: Continuation, Then a Full Reversal
Following the earlier breakout, DIA continued higher, clearing the previous $0.1571 resistance and pushing to a new high of $0.2084. That extension turned out to be the top — price has since fallen through every level on the way back down, including the $0.1414 and $0.1283 support zones that mattered just two days ago, landing at a Higher Low near $0.116, just above the original base around $0.0983.
Today's flat session suggests some stabilization after the sharp decline, but it's too early to call this a confirmed bottom.
The Zone That Matters Most: $0.0983
This is the original launch point of the entire move and the most important support left on the chart. It has held so far, but given how much ground was given back on the way down, it deserves close attention rather than being assumed safe.
Resistance Levels to Watch
$0.1283 — the first real resistance above current price, a former support level from earlier in the move
$0.1414 — the next level up
$0.1571 — a more significant resistance; reclaiming this would be a meaningful sign of recovery
$0.2084 — the recent high; a long way off, only relevant on a genuine trend change
Support Levels to Watch
$0.116 — the current Higher Low and the level in play right now
$0.0983 — the original base and the most important support on the chart; losing this would be a serious bearish development
Potential Trade Setups (Illustrative Only — Not Financial Advice)
🟢 Setup 1 — Buy the HL / base retest
Entry zone: $0.1150 – $0.1200
Invalidation / Stop-loss: Below $0.0983
Target 1: $0.1283
Target 2: $0.1414
Stretch Target: $0.1571
🔴 Setup 2 — Fade a bounce into resistance
Entry zone: $0.14 – $0.1571 (on a rally back into the FVG cluster)
Invalidation / Stop-loss: Above $0.16
Target 1: $0.1200
Target 2: $0.0983
🟢 Setup 3 — Bullish reversal confirmation
Trigger: A confirmed close above $0.1571
Entry zone: $0.1575 – $0.165 on confirmation
Invalidation / Stop-loss: Below $0.1283
Target: Retest of $0.2084
⚠️ Structure break (bearish invalidation)
A confirmed close below $0.0983 would break the base that this entire move launched from, and there is little established support beneath that level on this chart.
Bottom Line
DIA's breakout ran further than the earlier setup suggested before reversing sharply, and the coin is now testing whether it can hold the line at its original base near $0.0983. A stabilization here with a push back through $0.1283–$0.1414 would be a constructive sign; losing $0.0983 would mark a much more serious failure of this entire move.
Disclaimer: This content is for informational and educational purposes only and does not constitute financial, investment, or trading advice. Cryptocurrency trading involves significant risk, including the potential loss of principal. Past performance and chart patterns are not indicative of future results. Always conduct your own research and consult a licensed financial advisor before making trading decisions.
@Binance Square Official #GrubMarketFilesConfidentiallyForUSIPO #KospiCrashes11%OnChinaDUVChipThreat #USTreasuryYieldsRetreat #Binance #ChartSniper