
In this post, I will show how Bitcoin is using the same support it used during the April 2024 lows, but within a different market environment. For this analysis, I will use the AVWAP anchored to the most recent halving, the SMA50, Realized Price - UTXO Age Bands (6-12 months), and LTH Supply Change (this metric was created by Darkfost, a Verified Author at CQ).
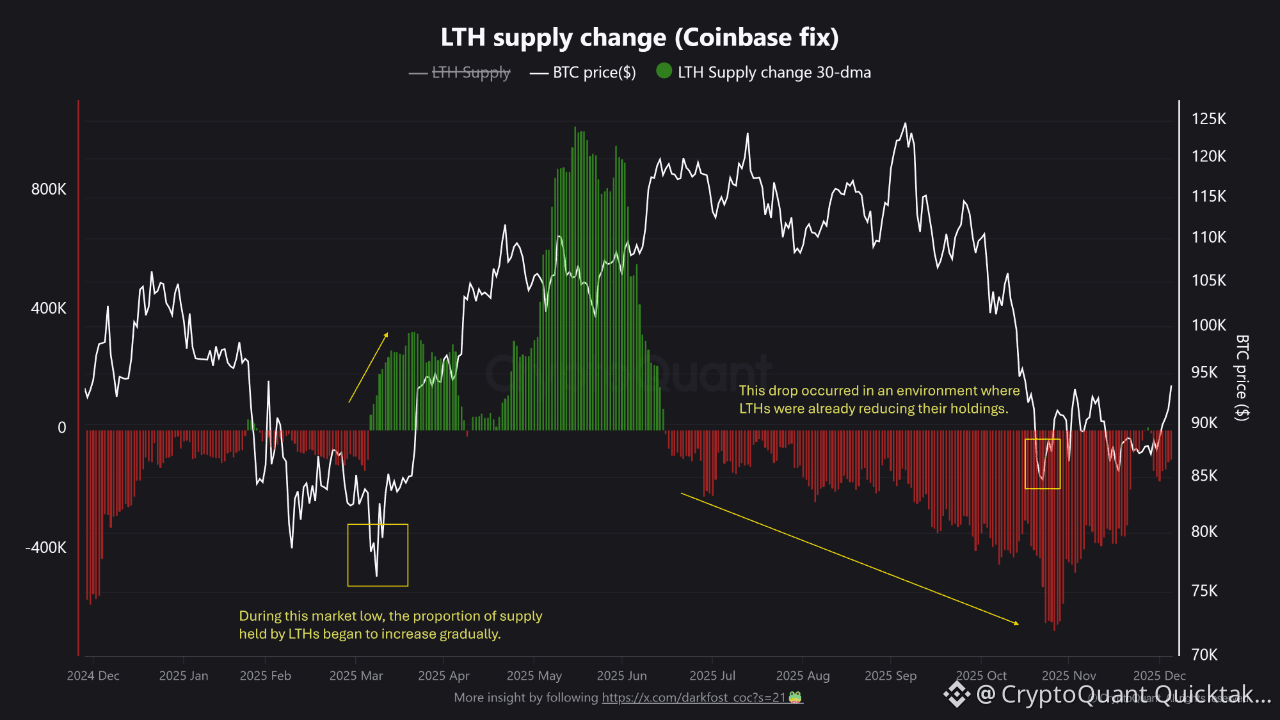
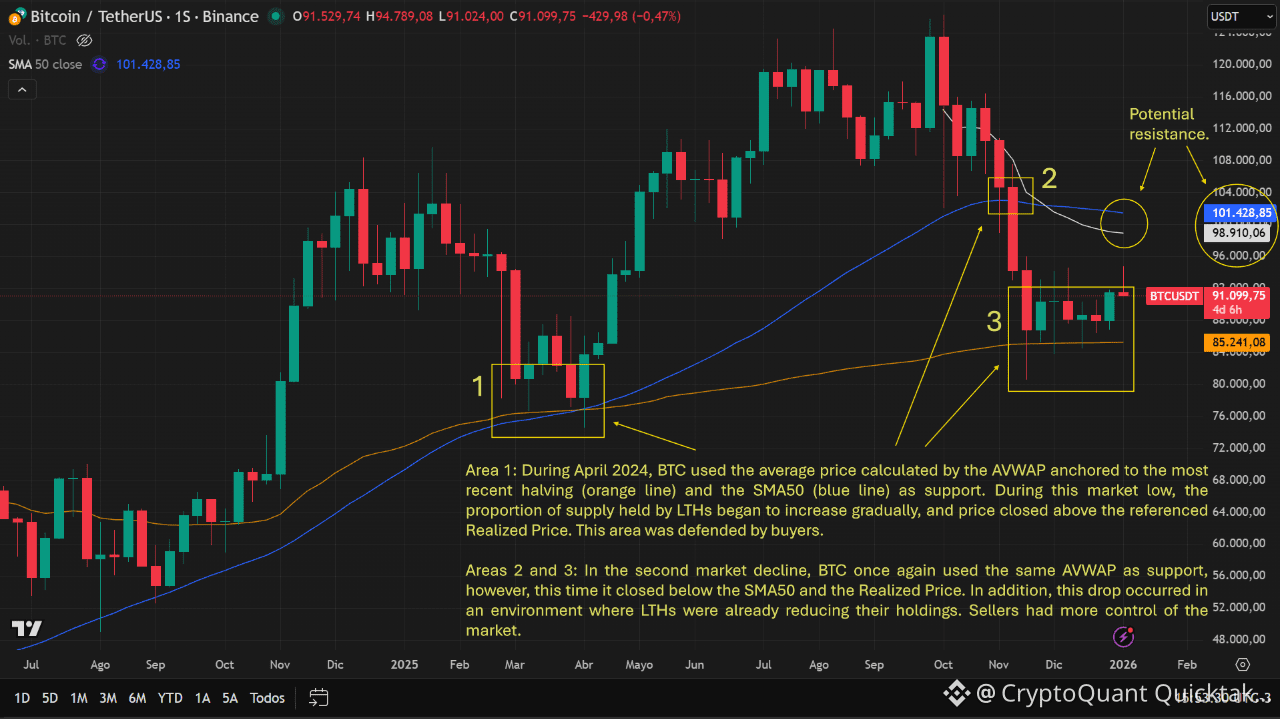
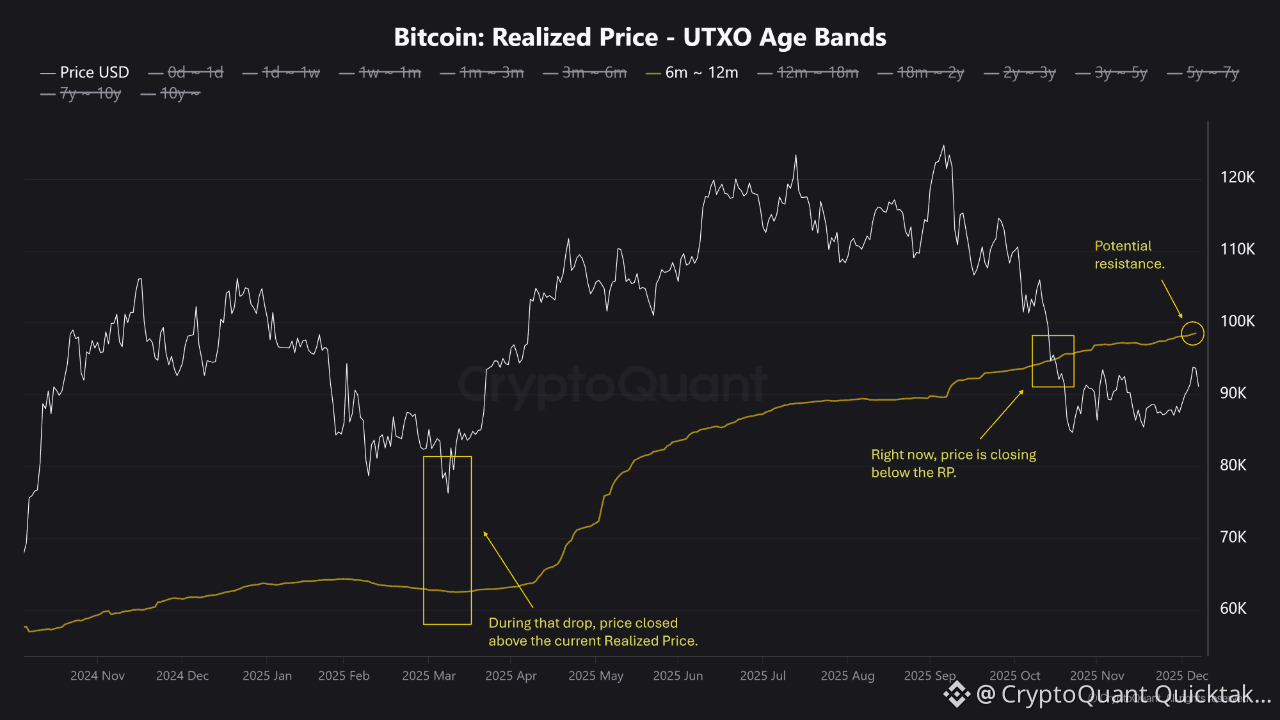
• Area 1: During April 2024, BTC used the average price calculated by the AVWAP anchored to the most recent halving (orange line) and the SMA50 (blue line) as support. During this market low, the proportion of supply held by LTHs began to increase gradually, and price closed above the referenced Realized Price. This area was defended by buyers.
• Areas 2 and 3: In the second market decline, BTC once again used the same AVWAP as support, however, this time it closed below the SMA50 and the Realized Price. In addition, this drop occurred in an environment where LTHs were already reducing their holdings. Sellers had more control of the market.
On the other hand, it is also worth noting that the AVWAP anchored to the most recent ATH (white line), the SMA50, and the Realized Price are currently clustered around the 98k-101k USD range. These levels could act as a potential resistance zone. If it reaches this area, it will be necessary to see how the price reacts.
Written by _OnChain
