A brutal selloff has swept across nearly every major asset class, and the scale of the losses has left investors searching for answers. Crypto prices have collapsed, gold and silver have suffered heavy declines, and stocks only recently showed signs of finding their footing.
Bitcoin, gold, silver, and major stock indexes rarely move lower together for an extended period. That unusual pattern has become one of the biggest stories in financial markets this week. Several analysts believe a combination of Federal Reserve policy, liquidity concerns, institutional selling, and economic uncertainty sits at the center of the storm.
Crypto Market Crash Shows How Quickly Liquidity Can Disappear
The cryptocurrency market has entered what many describe as a new crypto winter. Total crypto market capitalization has lost roughly $2 trillion from its peak levels.
Bitcoin price trades near $62,500 after reaching an all time high of $126,080 in October 2025. Ethereum has dropped toward $1,660, and Solana has lost more than 70% from its previous highs.
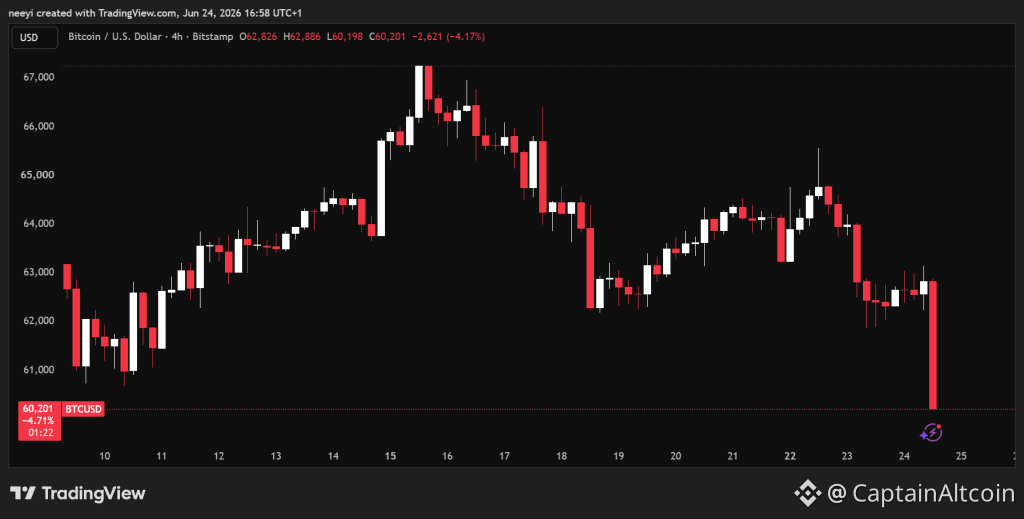 BTC Price Chart / TradingView.com
Several major forces appear to be driving the decline. One major factor comes from the Federal Reserve. Kevin Warsh replaced Jerome Powell as Federal Reserve Chair, and markets reacted negatively to the leadership change. Interest rates remain elevated, and expectations for easier monetary policy have faded. Higher borrowing costs usually reduce demand for risk assets such as Bitcoin and other cryptocurrencies.
Institutional money has also moved out of the market. Spot Bitcoin ETFs that helped fuel the previous rally have recorded more than $6 billion in net outflows over a 30 day period. That removes a major source of buying pressure that previously helped support prices.
Another issue comes from capital rotation. Large amounts of money have moved toward artificial intelligence infrastructure stocks and away from crypto assets. Investors seeking stronger earnings growth and tangible cash flows have shifted attention toward equities.
Derivatives markets have added more pressure. Several recent trading sessions saw between $660 million and $700 million in leveraged long positions liquidated within just 24 hours. Forced liquidations create automatic selling activity and can accelerate declines across exchanges.
Bitcoin miners face challenges as well. Estimated production costs now sit around $78,000 per BTC, which remains above the current Bitcoin price. Mining companies have sold large amounts of Bitcoin to cover expenses, adding another source of market supply.
Crypto Rover And 0xNobler Believe A Broader Liquidity Event Is Unfolding
Market commentators Crypto Rover and 0xNobler have pointed toward a larger issue that extends beyond crypto.
Crypto Rover noted that more than $5 trillion has been wiped out across crypto, precious metals, and stocks during the recent downturn. He linked the weakness to growing expectations for tighter Federal Reserve policy, a stronger U.S. dollar, falling oil prices, and concerns that the business cycle may be nearing a late stage.
WHY IS EVERYTHING CRASHING? This week, every asset class has been going down only. Over $5 trillion has been wiped out across precious metals, stocks, and crypto this week. Reasons: 1) Hawkish Fed The odds of a Fed rate hike are going up. DXY is getting strong. This is a… pic.twitter.com/I0jPace6B2
— Crypto Rover (@cryptorover) June 24, 2026
Crypto Rover also compared current conditions to previous periods when major asset bubbles deflated after valuations became disconnected from economic reality.
Another analyst, 0xNobler, described the recent price action as a forced liquidation cycle. He pointed to sharp declines across silver, gold, Bitcoin, platinum, and palladium within a very short period. His argument centers on liquidity stress. When margin calls appear across markets, investors often sell whatever assets can quickly raise cash.
That explanation helps explain why several unrelated assets have moved lower together.
Read Also: ChatGPT Predicts XRP Price if Binance Loses Access to the European Union Under MiCA
Gold And Silver Declines Show The Federal Reserve Matters More Than War
Gold and silver entered the conflict period with many investors expecting strong safe haven demand. The opposite happened.
Gold has fallen sharply during recent sessions. Silver has suffered even larger losses.
Recent data shows gold losing roughly 3.9% over a 30 hour period, while silver declined more than 9%. Looking at a longer timeframe, gold has dropped 25% since the conflict began, while silver has lost 38%.
Gold briefly traded below $4,000 before recovering slightly. Silver touched lows near $61.88 per ounce.
The key driver appears to be interest rate expectations.
Only a week ago, markets believed the Federal Reserve might become less aggressive after oil prices retreated and geopolitical concerns eased. That outlook changed quickly.
Markets now assign much higher odds to another rate increase before year end. Major financial institutions such as Deutsche Bank and Bank of America have pointed toward September as a possible meeting where policymakers could act.
Higher inflation expectations strengthen the case for tighter monetary policy. A stronger dollar often follows. Since gold is priced in dollars and does not generate income, higher rates can reduce its appeal compared with interest-bearing assets.
Another factor deserves attention. Broad market liquidations often force investors to sell liquid holdings. Gold and silver become sources of cash during those periods. Silver usually falls harder because it carries greater volatility than gold.
Read Also: Claude AI Predicts Bittensor (TAO) Price if AI Becomes the Biggest Crypto Trend of 2027
Stock Market Shows Early Signs Of Stability After Heavy Losses
Stocks have not escaped the damage, although signs of stabilization appeared on Wednesday.
A sharp decline in oil prices helped improve sentiment. Brent crude fell toward $73.80 per barrel, close to levels seen before recent geopolitical tensions intensified. Shipping conditions through the Strait of Hormuz also improved, reducing concerns about supply disruptions and inflation pressure.
The Nasdaq Composite gained roughly 0.6% during Wednesday trading. The S&P 500 added about 0.3%, while the Dow Jones Industrial Average moved slightly higher.
Those gains followed a painful session on June 23. The Philadelphia Semiconductor Index dropped nearly 8% in one day. Major technology names suffered steep declines. Micron Technology, SanDisk, Marvell Technology, Intel, and Alphabet all finished significantly lower.
Wall Street’s fear gauge, the VIX, jumped over13% during the selloff. That move reflected growing uncertainty across financial markets.
FAQs
How high can gold go by 2030?
By 2030, analysts project gold could reach between $6,200 and $10,000 per ounce. Major financial institutions highlight structural factors like aggressive central bank accumulation, U.S. fiscal concerns, and global currency devaluations as primary drivers for the long-term bullish outlook.
Gold price forecast for 2040
Based on an average long-term return of approximately 7% per year (which is historically common for gold), the price of $5,000 per troy ounce at the end of 2026 could rise to nearly $13,000 per troy ounce by 2040.
Subscribe to our YouTube channel for daily crypto updates, market insights, and expert analysis.
Subscribe to our YouTube channel for daily crypto updates, market insights, and expert analysis.
The post $5 Trillion Vanished: Why Bitcoin, Gold, Silver, and Stocks Are All Crashing at Once appeared first on CaptainAltcoin.