
#zecusdt
zecusdt
8.1M Aufrufe
21,464 Kommentare
Hot
Zuletzt

·
--
Verifiziert
#ZECUSDT
Der Begriff „Privacy Coin“ wird schon seit ein paar Jahren immer wieder heiß diskutiert. Warum konnte Zcash auf so eine hohe Position kommen? Hier sind ein paar persönliche Gedanken
1. Der Grayscale ZCSH-ETF ist offiziell an der NYSE gelistet. Das ist der direkteste Auslöser. Früher war es für Institutionen kaum möglich, sich an Privacy Coins heranzuwagen; jetzt kann man mit einem normalen Brokerkonto die ETF-Anteile direkt kaufen.
2. In der KI-Ära entwickelt sich alles schnell weiter, und das Thema Privacy Coins wird neu aufgelegt. Der Markt beginnt, eine Geschichte zu handeln: Zcash wird genutzt, um die Überwachung von On-Chain-Big-Data einzudämmen. Man kann wahlweise „Privacy“ aktivieren: Es sind sowohl normale, öffentliche und transparente Überweisungen möglich als auch Zero-Knowledge-Beweis-Privacy-Transfers. Genau diese auditierbare (prüfbare) Privatsphäre gibt ihm eine Chance, Regulierungen zu passieren—im Unterschied zu Coins, die vollständig anonym sind.
3. Das Angebot wird knapper. Das Umlauf- und Ausgabemechanismus von Zcash ist ähnlich wie bei Bitcoin und verfügt ebenfalls über ein Halbierungsmodell. 2024 wurde bereits die zweite Halbierung abgeschlossen: Der zusätzliche Verkaufsdruck sinkt. Dazu kommt, dass viele Coins in abgeschirmte Privacy-Pools wandern—praktisch als würden sie aus dem Sekundärmarkt-Umlauf „verschwinden“. Sobald Geld einsteigt, ist die Preiselastizität extrem hoch.
4. Liquidationen von Short-Positionen und Stop-Losses lösen eine Kettenreaktion des Panikverkaufs aus. Das dürfte selbsterklärend sein—die Kontraktspieler verstehen das.
#ZECUSDT
Der Begriff „Privacy Coin“ wird schon seit ein paar Jahren immer wieder heiß diskutiert. Warum konnte Zcash auf so eine hohe Position kommen? Hier sind ein paar persönliche Gedanken
1. Der Grayscale ZCSH-ETF ist offiziell an der NYSE gelistet. Das ist der direkteste Auslöser. Früher war es für Institutionen kaum möglich, sich an Privacy Coins heranzuwagen; jetzt kann man mit einem normalen Brokerkonto die ETF-Anteile direkt kaufen.
2. In der KI-Ära entwickelt sich alles schnell weiter, und das Thema Privacy Coins wird neu aufgelegt. Der Markt beginnt, eine Geschichte zu handeln: Zcash wird genutzt, um die Überwachung von On-Chain-Big-Data einzudämmen. Man kann wahlweise „Privacy“ aktivieren: Es sind sowohl normale, öffentliche und transparente Überweisungen möglich als auch Zero-Knowledge-Beweis-Privacy-Transfers. Genau diese auditierbare (prüfbare) Privatsphäre gibt ihm eine Chance, Regulierungen zu passieren—im Unterschied zu Coins, die vollständig anonym sind.
3. Das Angebot wird knapper. Das Umlauf- und Ausgabemechanismus von Zcash ist ähnlich wie bei Bitcoin und verfügt ebenfalls über ein Halbierungsmodell. 2024 wurde bereits die zweite Halbierung abgeschlossen: Der zusätzliche Verkaufsdruck sinkt. Dazu kommt, dass viele Coins in abgeschirmte Privacy-Pools wandern—praktisch als würden sie aus dem Sekundärmarkt-Umlauf „verschwinden“. Sobald Geld einsteigt, ist die Preiselastizität extrem hoch.
4. Liquidationen von Short-Positionen und Stop-Losses lösen eine Kettenreaktion des Panikverkaufs aus. Das dürfte selbsterklärend sein—die Kontraktspieler verstehen das.
Der Begriff „Privacy Coin“ wird schon seit ein paar Jahren immer wieder heiß diskutiert. Warum konnte Zcash auf so eine hohe Position kommen? Hier sind ein paar persönliche Gedanken
1. Der Grayscale ZCSH-ETF ist offiziell an der NYSE gelistet. Das ist der direkteste Auslöser. Früher war es für Institutionen kaum möglich, sich an Privacy Coins heranzuwagen; jetzt kann man mit einem normalen Brokerkonto die ETF-Anteile direkt kaufen.
2. In der KI-Ära entwickelt sich alles schnell weiter, und das Thema Privacy Coins wird neu aufgelegt. Der Markt beginnt, eine Geschichte zu handeln: Zcash wird genutzt, um die Überwachung von On-Chain-Big-Data einzudämmen. Man kann wahlweise „Privacy“ aktivieren: Es sind sowohl normale, öffentliche und transparente Überweisungen möglich als auch Zero-Knowledge-Beweis-Privacy-Transfers. Genau diese auditierbare (prüfbare) Privatsphäre gibt ihm eine Chance, Regulierungen zu passieren—im Unterschied zu Coins, die vollständig anonym sind.
3. Das Angebot wird knapper. Das Umlauf- und Ausgabemechanismus von Zcash ist ähnlich wie bei Bitcoin und verfügt ebenfalls über ein Halbierungsmodell. 2024 wurde bereits die zweite Halbierung abgeschlossen: Der zusätzliche Verkaufsdruck sinkt. Dazu kommt, dass viele Coins in abgeschirmte Privacy-Pools wandern—praktisch als würden sie aus dem Sekundärmarkt-Umlauf „verschwinden“. Sobald Geld einsteigt, ist die Preiselastizität extrem hoch.
4. Liquidationen von Short-Positionen und Stop-Losses lösen eine Kettenreaktion des Panikverkaufs aus. Das dürfte selbsterklärend sein—die Kontraktspieler verstehen das.
风中浪客:
ETF和AI叙事是能讲,但$ZEC老盘子套牢盘一堆,这波更像情绪+资金驱动,冲高别急着上头追。
2
3
4.5k

#ZECUSDT | Longs konzentrieren die größte Exposition auf der Karte
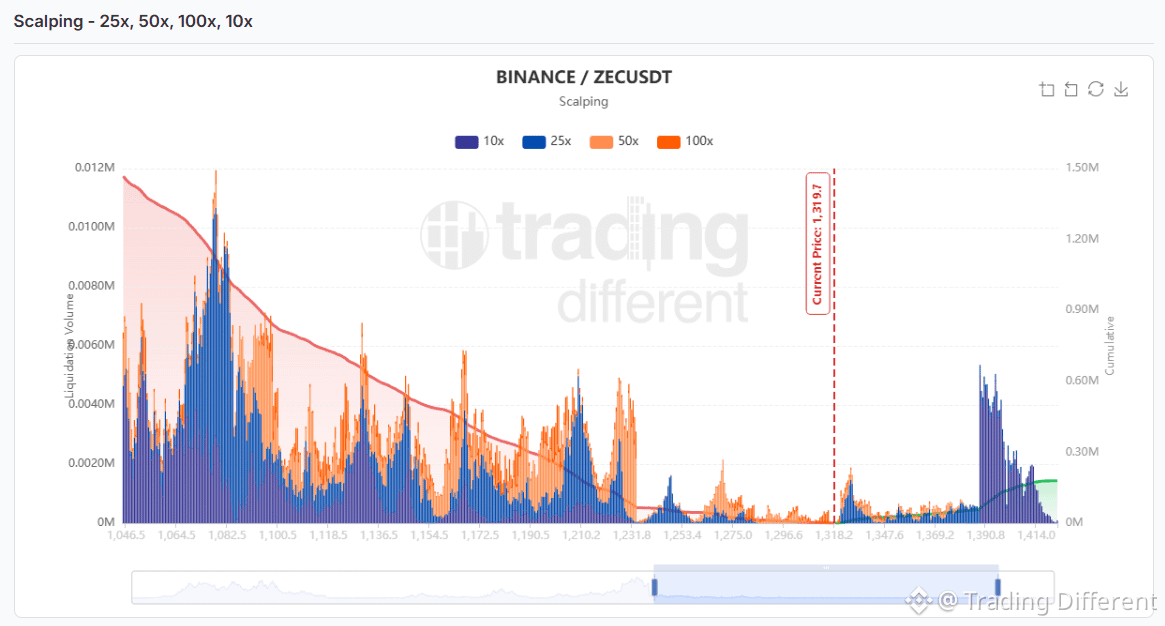
ZEC notiert nahe 1.319,7 USD, und die Scalping-Karte mit 10x, 25x, 50x und 100x zeigt eine deutliche Asymmetrie.
🔻 Unterhalb des Preises ist die Exposition der Longs klar überlegen. Besonders auffällig sind Konzentrationen um 1.210 USD, 1.170–1.190 USD, 1.130–1.155 USD und vor allem der große Block von 1.065–1.100 USD.
🔺 Oberhalb sind die Liquidationen von Shorts in den kumulierten Summen deutlich geringer. Die sichtbarste Konzentration zeigt sich bei etwa 1.390–1.415 USD, dominiert vor allem durch Hebel von 10x und 25x.
Das relevante Signal ist die Schieflage: Das potenzielle Liquidationsvolumen bleibt weiterhin viel größer unterhalb des aktuellen Preises. Der obere Block bei 1.390–1.415 USD ist die wichtigste unmittelbare Referenz, falls ZEC die Bewegung nach oben fortsetzt.
🔗 tradingdifferent.com/es/dashboard/liquidation-heatmap?code=binance-square
{future}(ZECUSDT)
#ZECUSDT | Longs konzentrieren die größte Exposition auf der Karte
ZEC notiert nahe 1.319,7 USD, und die Scalping-Karte mit 10x, 25x, 50x und 100x zeigt eine deutliche Asymmetrie.
🔻 Unterhalb des Preises ist die Exposition der Longs klar überlegen. Besonders auffällig sind Konzentrationen um 1.210 USD, 1.170–1.190 USD, 1.130–1.155 USD und vor allem der große Block von 1.065–1.100 USD.
🔺 Oberhalb sind die Liquidationen von Shorts in den kumulierten Summen deutlich geringer. Die sichtbarste Konzentration zeigt sich bei etwa 1.390–1.415 USD, dominiert vor allem durch Hebel von 10x und 25x.
Das relevante Signal ist die Schieflage: Das potenzielle Liquidationsvolumen bleibt weiterhin viel größer unterhalb des aktuellen Preises. Der obere Block bei 1.390–1.415 USD ist die wichtigste unmittelbare Referenz, falls ZEC die Bewegung nach oben fortsetzt.
🔗 tradingdifferent.com/es/dashboard/liquidation-heatmap?code=binance-square
ZEC notiert nahe 1.319,7 USD, und die Scalping-Karte mit 10x, 25x, 50x und 100x zeigt eine deutliche Asymmetrie.
🔻 Unterhalb des Preises ist die Exposition der Longs klar überlegen. Besonders auffällig sind Konzentrationen um 1.210 USD, 1.170–1.190 USD, 1.130–1.155 USD und vor allem der große Block von 1.065–1.100 USD.
🔺 Oberhalb sind die Liquidationen von Shorts in den kumulierten Summen deutlich geringer. Die sichtbarste Konzentration zeigt sich bei etwa 1.390–1.415 USD, dominiert vor allem durch Hebel von 10x und 25x.
Das relevante Signal ist die Schieflage: Das potenzielle Liquidationsvolumen bleibt weiterhin viel größer unterhalb des aktuellen Preises. Der obere Block bei 1.390–1.415 USD ist die wichtigste unmittelbare Referenz, falls ZEC die Bewegung nach oben fortsetzt.
🔗 tradingdifferent.com/es/dashboard/liquidation-heatmap?code=binance-square
1
1.1k
·
--
👀 ZEC — Lohnt es sich, drauf zu achten?Ganz ehrlich… 👀 $ZEC catched mich auf.
Über den Preis wird zwar ständig geredet, aber mich interessiert mehr, was hinter der Münze steckt.
Zcash steht seit Jahren für Privatsphäre und nutzt Zero-Knowledge-Technologie, um private Transaktionen zu ermöglichen. 🔐
Und dann gibt es da noch das maximale Angebot von 21M – das ist definitiv etwas, das man im Hinterkopf behalten sollte.
Aber ich bin nicht hier, um einen Pump zu fordern oder verrückte Kursziele auszugeben.
Ich beobachte einfach das Projekt, die Adoption und den Markt.
Glaubst du, dass Privacy Coins noch eine Zukunft haben? 👇
👀 ZEC — Lohnt es sich, drauf zu achten?
Ganz ehrlich… 👀 $ZEC catched mich auf.
Über den Preis wird zwar ständig geredet, aber mich interessiert mehr, was hinter der Münze steckt.
Zcash steht seit Jahren für Privatsphäre und nutzt Zero-Knowledge-Technologie, um private Transaktionen zu ermöglichen. 🔐
Und dann gibt es da noch das maximale Angebot von 21M – das ist definitiv etwas, das man im Hinterkopf behalten sollte.
Aber ich bin nicht hier, um einen Pump zu fordern oder verrückte Kursziele auszugeben.
Ich beobachte einfach das Projekt, die Adoption und den Markt.
Glaubst du, dass Privacy Coins noch eine Zukunft haben? 👇
Über den Preis wird zwar ständig geredet, aber mich interessiert mehr, was hinter der Münze steckt.
Zcash steht seit Jahren für Privatsphäre und nutzt Zero-Knowledge-Technologie, um private Transaktionen zu ermöglichen. 🔐
Und dann gibt es da noch das maximale Angebot von 21M – das ist definitiv etwas, das man im Hinterkopf behalten sollte.
Aber ich bin nicht hier, um einen Pump zu fordern oder verrückte Kursziele auszugeben.
Ich beobachte einfach das Projekt, die Adoption und den Markt.
Glaubst du, dass Privacy Coins noch eine Zukunft haben? 👇
AngelOfCrypto_-:
nice
3
3
1.2k

Übersetzung ansehen
$ZEC IS NOT YOUR AVERAGE MIDCAP — DON’T UNDERESTIMATE IT
How many traders got liquidated on $ZEC thinking the pump was over and a crash was coming?
A lot of traders are treating this move like it’s just another midcap pump. But ZEC isn’t a small coin that can easily be pushed around.
The volatility can shake out overleveraged traders on both sides, but that doesn’t automatically mean the bigger trend is finished.
What I’m watching is simple: who is actually selling the spot supply? Until real large-scale selling shows up, I wouldn’t assume every pullback in ZEC means the pump is over.
Privacy coins can move differently when demand comes back. $ZEC is one I’d rather watch for real spot selling than panic over every liquidation.
#ZECUSDT
$ZEC IS NOT YOUR AVERAGE MIDCAP — DON’T UNDERESTIMATE IT
How many traders got liquidated on $ZEC thinking the pump was over and a crash was coming?
A lot of traders are treating this move like it’s just another midcap pump. But ZEC isn’t a small coin that can easily be pushed around.
The volatility can shake out overleveraged traders on both sides, but that doesn’t automatically mean the bigger trend is finished.
What I’m watching is simple: who is actually selling the spot supply? Until real large-scale selling shows up, I wouldn’t assume every pullback in ZEC means the pump is over.
Privacy coins can move differently when demand comes back. $ZEC is one I’d rather watch for real spot selling than panic over every liquidation.
#ZECUSDT
How many traders got liquidated on $ZEC thinking the pump was over and a crash was coming?
A lot of traders are treating this move like it’s just another midcap pump. But ZEC isn’t a small coin that can easily be pushed around.
The volatility can shake out overleveraged traders on both sides, but that doesn’t automatically mean the bigger trend is finished.
What I’m watching is simple: who is actually selling the spot supply? Until real large-scale selling shows up, I wouldn’t assume every pullback in ZEC means the pump is over.
Privacy coins can move differently when demand comes back. $ZEC is one I’d rather watch for real spot selling than panic over every liquidation.
#ZECUSDT
300

·
--
Warum steigt ZEC so stark?
$ZEC steigt derzeit nicht wegen eines einzelnen Treibers, sondern weil mehrere starke Faktoren gleichzeitig zusammengekommen sind:
- Grayscale ZCSH ETF. Am 25. August hat Grayscale einen Spot-Zcash-ETF auf den Markt gebracht. Bis zum 8. September hatte der Fonds bereits mehr als 500 Mio. USD an Vermögenswerten erreicht und hielt über 550k $ZEC – ungefähr 3% des zirkulierenden Angebots. Das treibt eine strukturelle Nachfrage nach ZEC.
- Starker Interesse an Privacy-Coins: Zcash ermöglicht verschlüsselte Transaktionen, die den Absender, den Empfänger und den Transaktionsbetrag verbergen. Angesichts eines verstärkten globalen Fokus auf finanzielle Privatsphäre hat diese Story wieder deutlich an Zugkraft gewonnen.
- Steigende Netzwerkaktivität. Über die Hälfte aller Zcash-Transaktionen nutzt mittlerweile den Shielded-Modus, was im Vergleich zum Vorjahr einen erheblichen Anstieg darstellt.
- Short Squeeze beschleunigt den Schwung. Während ZEC über $1.000 ausbrach, wurden etwa $36,6 Mio. an Positionen liquidiert, wobei Short-Positionen für rund $34,5 Mio. verantwortlich waren. Das hat den Aufwärtsimpuls stark befeuert.
- Besser als die Schwäche des Gesamtmarkts. $ZEC
{future}(ZECUSDT)
zeigt eine bemerkenswerte relative Stärke. Am 16. September, als der breitere Kryptomarkt sich vor der Zinsentscheidung der Fed zurückzog, blieb ZEC bei den wenigen großen Coins, die weiterhin nach oben drückten.
Zusätzlich hat die Community kürzlich die NU7-Governance-Abstimmung verabschiedet und Protokoll-Upgrades genehmigt, darunter eine Reduzierung der Blockzeiten von 75 auf 25 Sekunden.
Der aktuelle Rallye-Lauf von ZEC spiegelt eine Konvergenz aus ETF-Zuflüssen, institutioneller Nachfrage, erneuertem Interesse an Privacy-Tokens und starkem Marktimpuls wider. Allerdings ist es angesichts der Tatsache, dass ZEC zuletzt ~ $1.249 berührte und einen ~138% monatlichen Gewinn verbuchte, entscheidend, das Risiko bei möglichen scharfen Rücksetzern sorgfältig zu steuern.
#ZECUSDT #pump #rally #long
Warum steigt ZEC so stark?
$ZEC steigt derzeit nicht wegen eines einzelnen Treibers, sondern weil mehrere starke Faktoren gleichzeitig zusammengekommen sind:
- Grayscale ZCSH ETF. Am 25. August hat Grayscale einen Spot-Zcash-ETF auf den Markt gebracht. Bis zum 8. September hatte der Fonds bereits mehr als 500 Mio. USD an Vermögenswerten erreicht und hielt über 550k $ZEC – ungefähr 3% des zirkulierenden Angebots. Das treibt eine strukturelle Nachfrage nach ZEC.
- Starker Interesse an Privacy-Coins: Zcash ermöglicht verschlüsselte Transaktionen, die den Absender, den Empfänger und den Transaktionsbetrag verbergen. Angesichts eines verstärkten globalen Fokus auf finanzielle Privatsphäre hat diese Story wieder deutlich an Zugkraft gewonnen.
- Steigende Netzwerkaktivität. Über die Hälfte aller Zcash-Transaktionen nutzt mittlerweile den Shielded-Modus, was im Vergleich zum Vorjahr einen erheblichen Anstieg darstellt.
- Short Squeeze beschleunigt den Schwung. Während ZEC über $1.000 ausbrach, wurden etwa $36,6 Mio. an Positionen liquidiert, wobei Short-Positionen für rund $34,5 Mio. verantwortlich waren. Das hat den Aufwärtsimpuls stark befeuert.
- Besser als die Schwäche des Gesamtmarkts. $ZEC
zeigt eine bemerkenswerte relative Stärke. Am 16. September, als der breitere Kryptomarkt sich vor der Zinsentscheidung der Fed zurückzog, blieb ZEC bei den wenigen großen Coins, die weiterhin nach oben drückten.
Zusätzlich hat die Community kürzlich die NU7-Governance-Abstimmung verabschiedet und Protokoll-Upgrades genehmigt, darunter eine Reduzierung der Blockzeiten von 75 auf 25 Sekunden.
Der aktuelle Rallye-Lauf von ZEC spiegelt eine Konvergenz aus ETF-Zuflüssen, institutioneller Nachfrage, erneuertem Interesse an Privacy-Tokens und starkem Marktimpuls wider. Allerdings ist es angesichts der Tatsache, dass ZEC zuletzt ~ $1.249 berührte und einen ~138% monatlichen Gewinn verbuchte, entscheidend, das Risiko bei möglichen scharfen Rücksetzern sorgfältig zu steuern.
#ZECUSDT #pump #rally #long
$ZEC steigt derzeit nicht wegen eines einzelnen Treibers, sondern weil mehrere starke Faktoren gleichzeitig zusammengekommen sind:
- Grayscale ZCSH ETF. Am 25. August hat Grayscale einen Spot-Zcash-ETF auf den Markt gebracht. Bis zum 8. September hatte der Fonds bereits mehr als 500 Mio. USD an Vermögenswerten erreicht und hielt über 550k $ZEC – ungefähr 3% des zirkulierenden Angebots. Das treibt eine strukturelle Nachfrage nach ZEC.
- Starker Interesse an Privacy-Coins: Zcash ermöglicht verschlüsselte Transaktionen, die den Absender, den Empfänger und den Transaktionsbetrag verbergen. Angesichts eines verstärkten globalen Fokus auf finanzielle Privatsphäre hat diese Story wieder deutlich an Zugkraft gewonnen.
- Steigende Netzwerkaktivität. Über die Hälfte aller Zcash-Transaktionen nutzt mittlerweile den Shielded-Modus, was im Vergleich zum Vorjahr einen erheblichen Anstieg darstellt.
- Short Squeeze beschleunigt den Schwung. Während ZEC über $1.000 ausbrach, wurden etwa $36,6 Mio. an Positionen liquidiert, wobei Short-Positionen für rund $34,5 Mio. verantwortlich waren. Das hat den Aufwärtsimpuls stark befeuert.
- Besser als die Schwäche des Gesamtmarkts. $ZEC
zeigt eine bemerkenswerte relative Stärke. Am 16. September, als der breitere Kryptomarkt sich vor der Zinsentscheidung der Fed zurückzog, blieb ZEC bei den wenigen großen Coins, die weiterhin nach oben drückten.
Zusätzlich hat die Community kürzlich die NU7-Governance-Abstimmung verabschiedet und Protokoll-Upgrades genehmigt, darunter eine Reduzierung der Blockzeiten von 75 auf 25 Sekunden.
Der aktuelle Rallye-Lauf von ZEC spiegelt eine Konvergenz aus ETF-Zuflüssen, institutioneller Nachfrage, erneuertem Interesse an Privacy-Tokens und starkem Marktimpuls wider. Allerdings ist es angesichts der Tatsache, dass ZEC zuletzt ~ $1.249 berührte und einen ~138% monatlichen Gewinn verbuchte, entscheidend, das Risiko bei möglichen scharfen Rücksetzern sorgfältig zu steuern.
#ZECUSDT #pump #rally #long
1
360

·
--
Bullisch
Verliere weiterhin deine Zeit auf TikTok, währenddessen $ZEC Sorge dafür, dass du alle Projektionen erfüllst und weiterhin die beste Performance von 2026 hast 🤷♂️🧠
Bis wann soll ich es dir noch mit dieser Münze sagen? Ich schwöre, ich werde dich anzeigen 😑
KLICKE HIER, UM AUF SPOT ZU KAUFEN #zec 👇👇👇👇
{spot}(ZECUSDT)
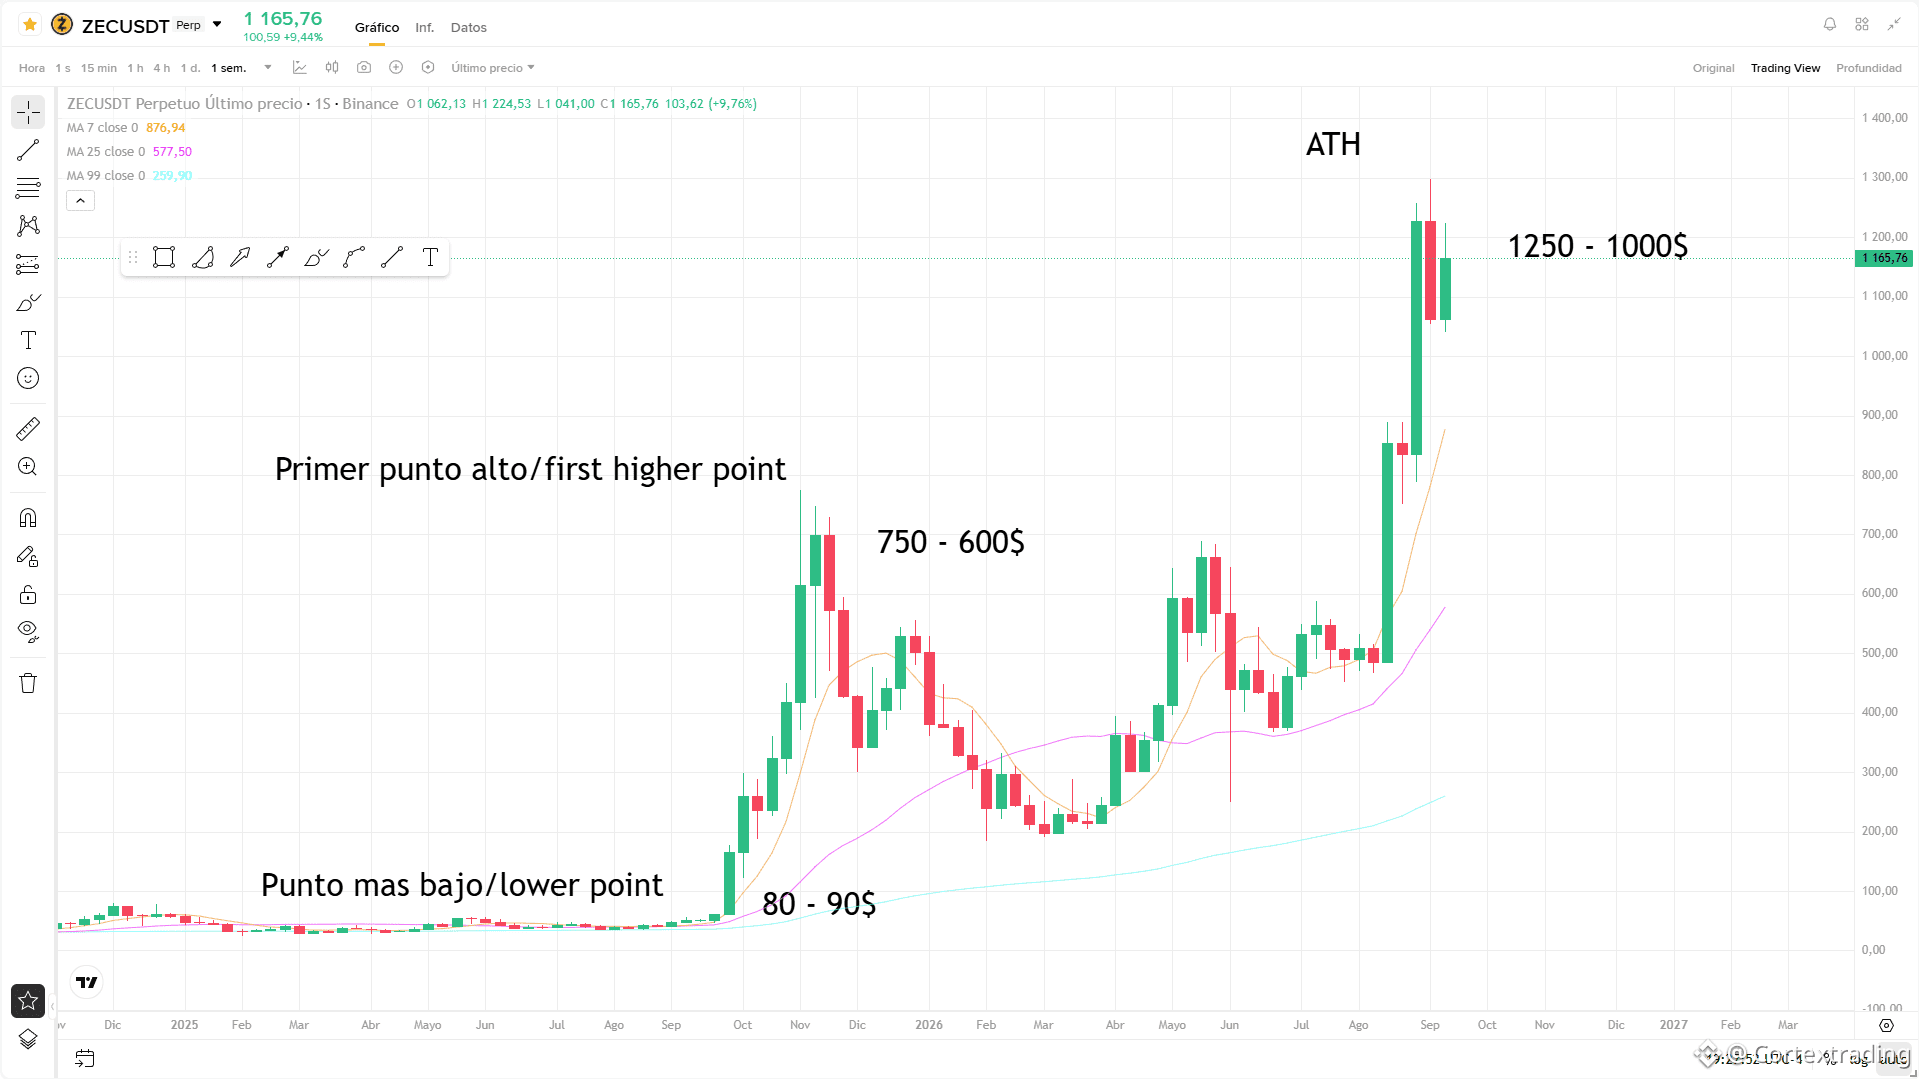
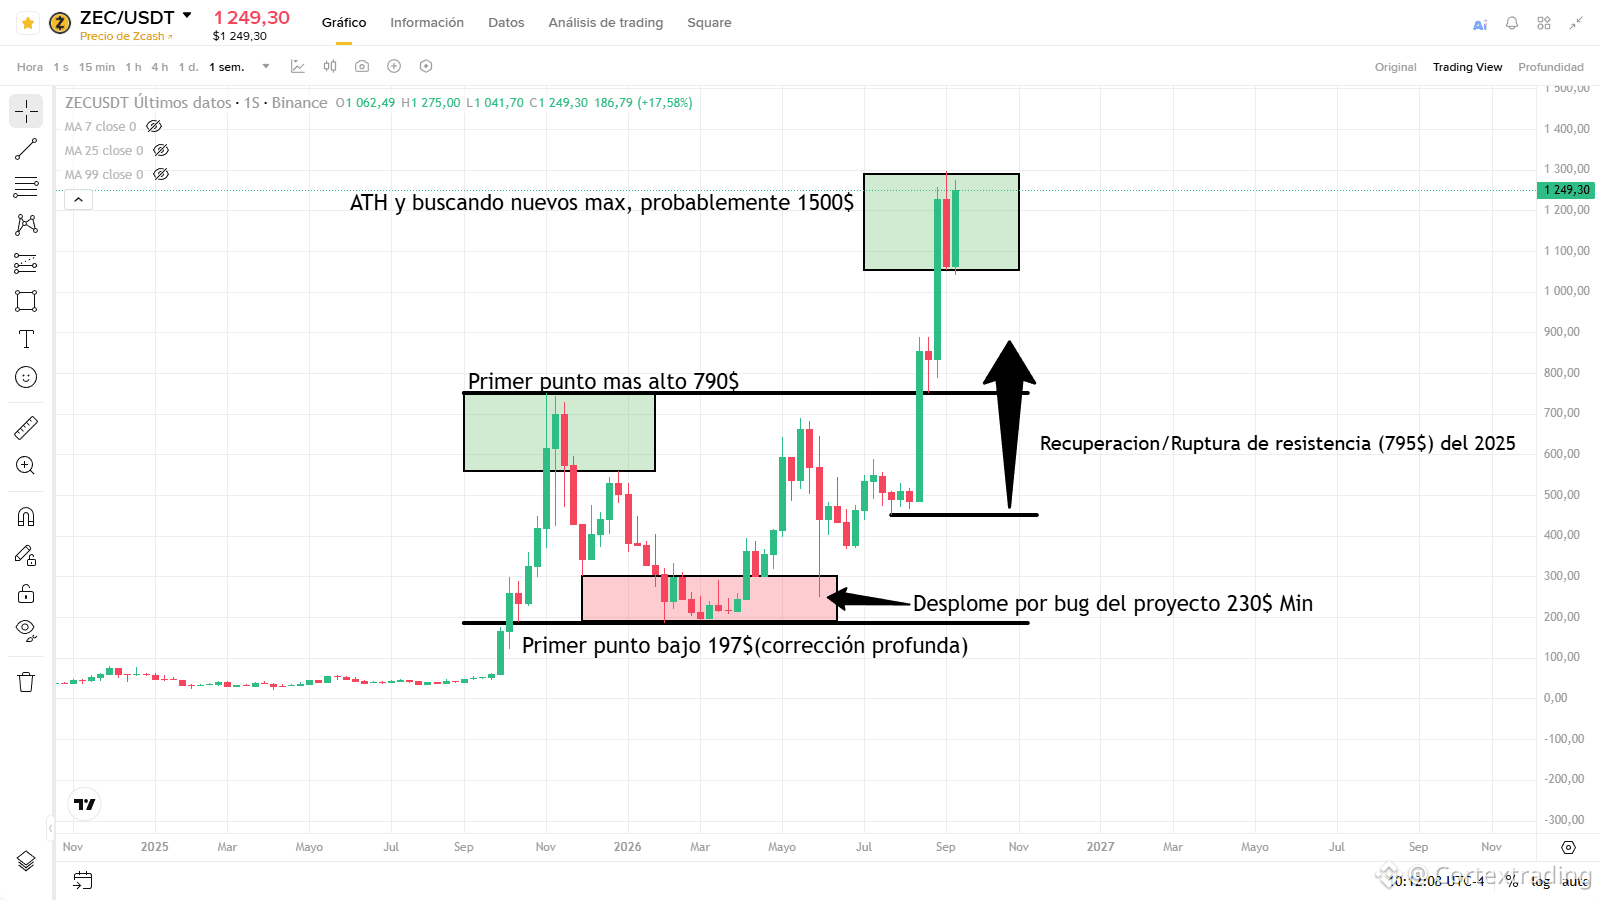
Ok, zuerst das, was passiert und warum ich damit großspurig bin, ist ganz einfach: Seit über einem Jahr sage ich dir das und erkläre dir den Kauf von #zec über $DASH und den anderen Privacy-Coins, weil #ZECUSDT diejenige ist, die die größte Market-Cap hält und das Projekt auf lange Sicht am besten in die Zukunft projiziert.
Zweitens habe ich dir seit über zwei Wochen unmissverständlich klargemacht, dass diese Münze im Vergleich zu #BTC O #ETH zu denjenigen gehört, die die beste Performance erzielt haben—nicht nur durch den Anstieg, sondern auch durch das Halten auf einem hohen Preis (Achtung: kurzfristig. Sei kein Idiot und denk, ich sage, dass die besser sind als diese Münzen 🥀).
Drittens zeigt mir die Entkopplung von $BTC mit dieser Münze, dass die Akkumulation dahin geht, wo sie hingehört, und nicht nur durch bloße Spekulation. In einfachen Worten: Zeigt einen so guten Chart kurzfristig und unabhängig, dass man die Stärke, die sie hat, nicht abstreiten kann (KURZFRISTIGER ZEITRAUM, IDIOT xD)
{spot}(BTCUSDT)
Also, danach wirst du mich hier großspurig sehen, wenn es bei 1500 ankommt, und du dort verlierst Zeit—nicht nur, dass du mir nicht folgst, sondern du denkst auch noch, ich erzähle irgendwelchen Unsinn 🥴
Verliere weiterhin deine Zeit auf TikTok, währenddessen $ZEC Sorge dafür, dass du alle Projektionen erfüllst und weiterhin die beste Performance von 2026 hast 🤷♂️🧠
Bis wann soll ich es dir noch mit dieser Münze sagen? Ich schwöre, ich werde dich anzeigen 😑
KLICKE HIER, UM AUF SPOT ZU KAUFEN #zec 👇👇👇👇
Ok, zuerst das, was passiert und warum ich damit großspurig bin, ist ganz einfach: Seit über einem Jahr sage ich dir das und erkläre dir den Kauf von #zec über $DASH und den anderen Privacy-Coins, weil #ZECUSDT diejenige ist, die die größte Market-Cap hält und das Projekt auf lange Sicht am besten in die Zukunft projiziert.
Zweitens habe ich dir seit über zwei Wochen unmissverständlich klargemacht, dass diese Münze im Vergleich zu #BTC O #ETH zu denjenigen gehört, die die beste Performance erzielt haben—nicht nur durch den Anstieg, sondern auch durch das Halten auf einem hohen Preis (Achtung: kurzfristig. Sei kein Idiot und denk, ich sage, dass die besser sind als diese Münzen 🥀).
Drittens zeigt mir die Entkopplung von $BTC mit dieser Münze, dass die Akkumulation dahin geht, wo sie hingehört, und nicht nur durch bloße Spekulation. In einfachen Worten: Zeigt einen so guten Chart kurzfristig und unabhängig, dass man die Stärke, die sie hat, nicht abstreiten kann (KURZFRISTIGER ZEITRAUM, IDIOT xD)
Also, danach wirst du mich hier großspurig sehen, wenn es bei 1500 ankommt, und du dort verlierst Zeit—nicht nur, dass du mir nicht folgst, sondern du denkst auch noch, ich erzähle irgendwelchen Unsinn 🥴
Bis wann soll ich es dir noch mit dieser Münze sagen? Ich schwöre, ich werde dich anzeigen 😑
KLICKE HIER, UM AUF SPOT ZU KAUFEN #zec 👇👇👇👇
Ok, zuerst das, was passiert und warum ich damit großspurig bin, ist ganz einfach: Seit über einem Jahr sage ich dir das und erkläre dir den Kauf von #zec über $DASH und den anderen Privacy-Coins, weil #ZECUSDT diejenige ist, die die größte Market-Cap hält und das Projekt auf lange Sicht am besten in die Zukunft projiziert.
Zweitens habe ich dir seit über zwei Wochen unmissverständlich klargemacht, dass diese Münze im Vergleich zu #BTC O #ETH zu denjenigen gehört, die die beste Performance erzielt haben—nicht nur durch den Anstieg, sondern auch durch das Halten auf einem hohen Preis (Achtung: kurzfristig. Sei kein Idiot und denk, ich sage, dass die besser sind als diese Münzen 🥀).
Drittens zeigt mir die Entkopplung von $BTC mit dieser Münze, dass die Akkumulation dahin geht, wo sie hingehört, und nicht nur durch bloße Spekulation. In einfachen Worten: Zeigt einen so guten Chart kurzfristig und unabhängig, dass man die Stärke, die sie hat, nicht abstreiten kann (KURZFRISTIGER ZEITRAUM, IDIOT xD)
Also, danach wirst du mich hier großspurig sehen, wenn es bei 1500 ankommt, und du dort verlierst Zeit—nicht nur, dass du mir nicht folgst, sondern du denkst auch noch, ich erzähle irgendwelchen Unsinn 🥴

Cortextrading
·
--
BullischSchweig und hör auf, Zeit zu verlieren, und schau dir an, wie $ZEC gerade die beste Performance-Münze des Jahres 2026 ist 💵🤷
KLICKE HIER, UM ZU HANDELN #zec 👇👇👇👇
Diejenigen, die im Markt raten, sind dumm, aber noch dümmer sind die, die keinen guten Project und keine gute, konstante Cap Market erkennen 🥀
Außerdem sage ich dir seit 2025 etwas völlig Klartext: Diese Münze wird früher oder später die 1000$-Marke brechen – und schau, wohin sie uns schon führt 🤣
Erstens, warum ich sage, dass es im Moment die beste Münze auf dem Markt ist – VOR ALLEM IM KURZFRISTIGEN – denn sie ist unglaublich einfach.
Sie gehört innerhalb all dieser Privacy-Münzen wie $XMR oder #DASH zu denjenigen, die sich tatsächlich am längsten komplett vom Rest abkoppeln von #BTC . Das liegt vor allem an ihrer großen Cap Market, die sie besitzt: Sie ist es, die sie konstant ganz oben in den Top der Top hält, und sie geht einen separaten Weg, getrennt vom Markt (KURZFRISTIG, NICHT VERGESSEN, BOBO/A 🥀)
Der zweite Grund ist, woher sie kommt: #zec ist buchstäblich abgestürzt, als sie sich in ihrem besten Moment befand (zwischen Mai und Juni in diesem Jahr) – und obwohl sie von 650$ gefallen ist, bis sie 250$ erreicht hat, also über 40% Rückgang, schaffte sie es trotzdem, sich auf eine komplett organische und exponentielle Weise zurückzuholen, praktisch mit einer Beschleunigung, die jeder x-beliebigen Schrottmünze würdig ist, wie
$B .
Und als letzter Punkt: ihr Privacy-Projekt 🔒 – eine Privacy, die sich im Unterschied zu #XMR tatsächlich besser zugänglich für Regierungen oder regulierende Stellen zeigt. Daher ist es eher vorhersehbar, dass sie weniger Probleme mit Exchanges hat als die andere Münze (#XMR )
Also, wenn du voll ausrastest und außerdem noch richtig flirtig bist wie immer 🚀, meine Crackes: bitte seid still.
KLICKE HIER, UM ZU HANDELN #zec 👇👇👇👇
Diejenigen, die im Markt raten, sind dumm, aber noch dümmer sind die, die keinen guten Project und keine gute, konstante Cap Market erkennen 🥀
Außerdem sage ich dir seit 2025 etwas völlig Klartext: Diese Münze wird früher oder später die 1000$-Marke brechen – und schau, wohin sie uns schon führt 🤣
Erstens, warum ich sage, dass es im Moment die beste Münze auf dem Markt ist – VOR ALLEM IM KURZFRISTIGEN – denn sie ist unglaublich einfach.
Sie gehört innerhalb all dieser Privacy-Münzen wie $XMR oder #DASH zu denjenigen, die sich tatsächlich am längsten komplett vom Rest abkoppeln von #BTC . Das liegt vor allem an ihrer großen Cap Market, die sie besitzt: Sie ist es, die sie konstant ganz oben in den Top der Top hält, und sie geht einen separaten Weg, getrennt vom Markt (KURZFRISTIG, NICHT VERGESSEN, BOBO/A 🥀)
Der zweite Grund ist, woher sie kommt: #zec ist buchstäblich abgestürzt, als sie sich in ihrem besten Moment befand (zwischen Mai und Juni in diesem Jahr) – und obwohl sie von 650$ gefallen ist, bis sie 250$ erreicht hat, also über 40% Rückgang, schaffte sie es trotzdem, sich auf eine komplett organische und exponentielle Weise zurückzuholen, praktisch mit einer Beschleunigung, die jeder x-beliebigen Schrottmünze würdig ist, wie
$B .
Und als letzter Punkt: ihr Privacy-Projekt 🔒 – eine Privacy, die sich im Unterschied zu #XMR tatsächlich besser zugänglich für Regierungen oder regulierende Stellen zeigt. Daher ist es eher vorhersehbar, dass sie weniger Probleme mit Exchanges hat als die andere Münze (#XMR )
Also, wenn du voll ausrastest und außerdem noch richtig flirtig bist wie immer 🚀, meine Crackes: bitte seid still.
Lance_52:
Lo digo de forma general, pero si es solo eso, pues cada quien expresa su propio estilo.
3
4
3.3k


·
--
Bullisch
🔥 Ist $ZEC getting bereit für 2.000 $?
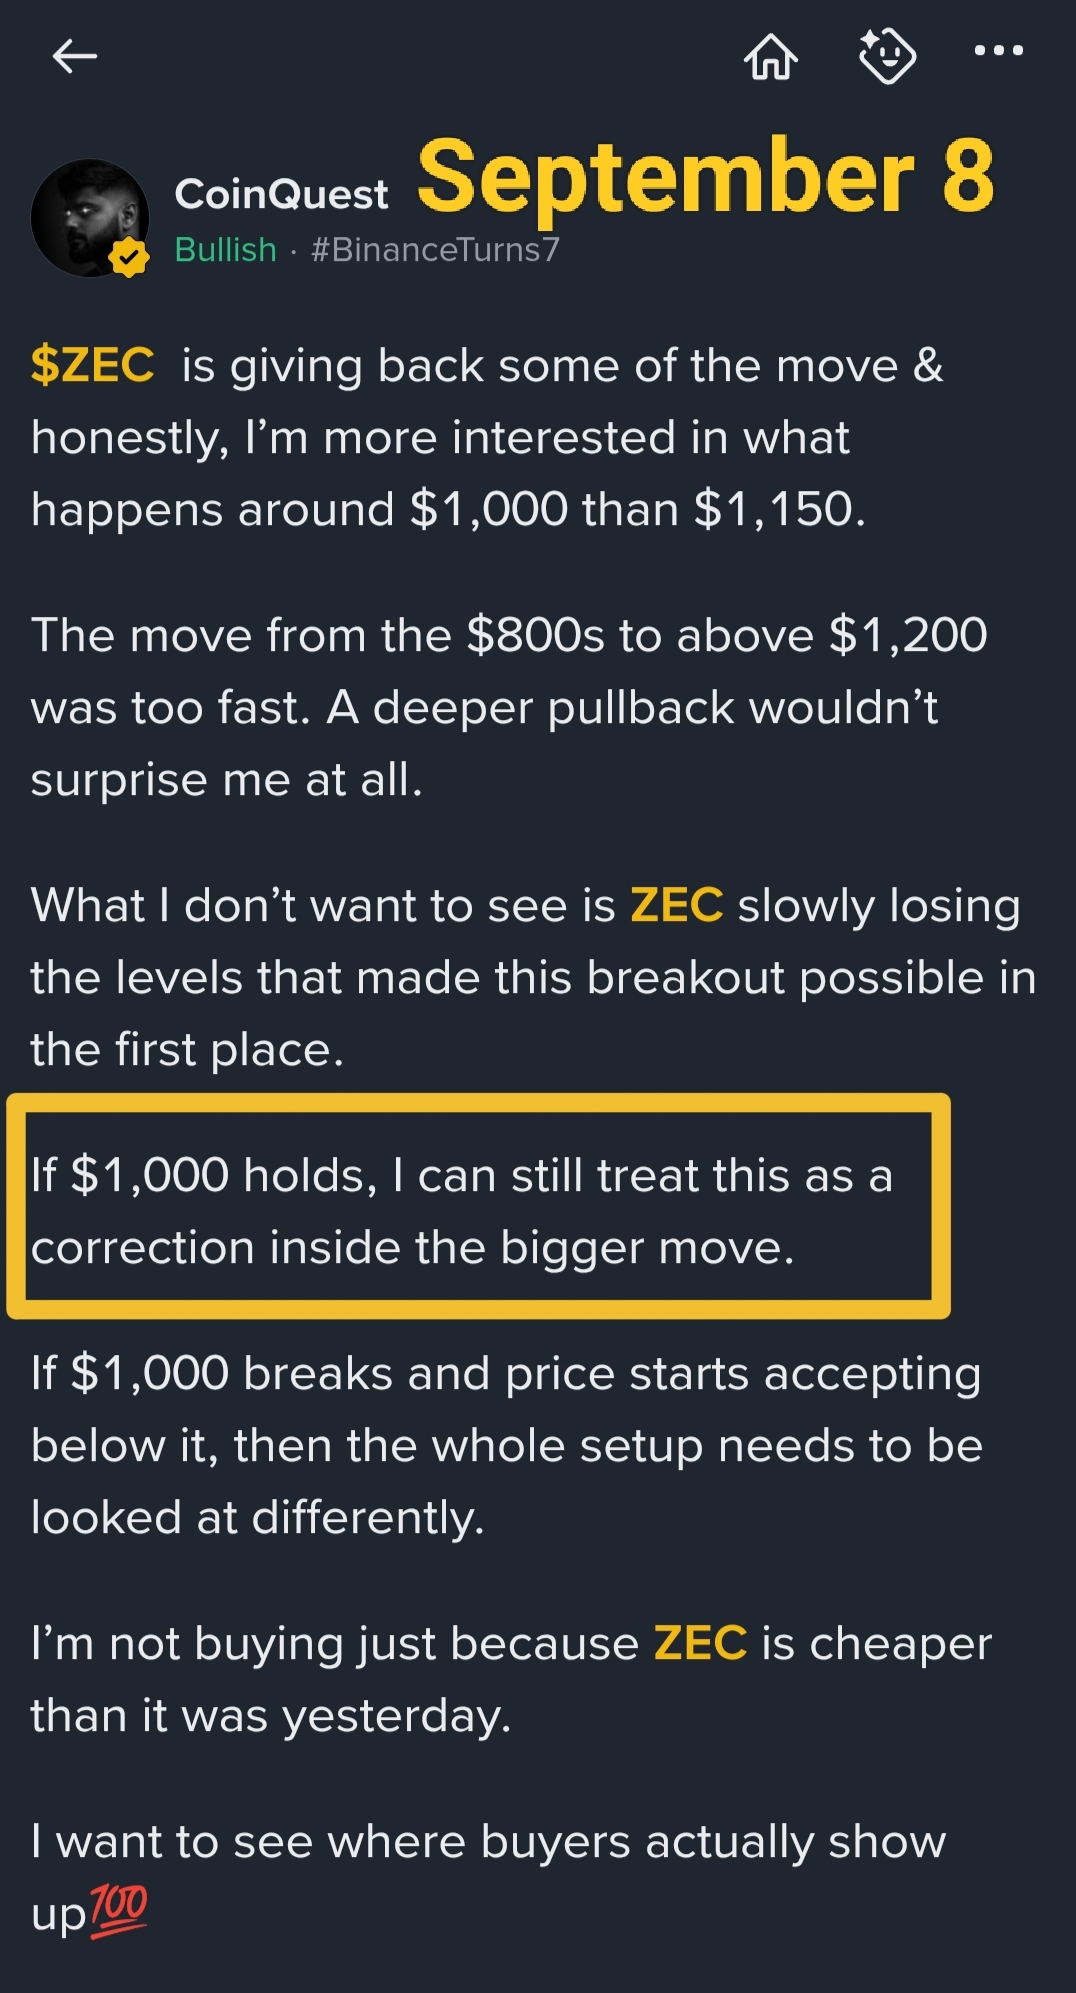
ZEC ist bereits dabei, einen starken Move zu machen..... und die nächste Frage ist, ob dieser Run die 2.000-$-Marke erreichen kann.
Zcash wird oft mit dem Bitcoin des Privacy-Sektors verglichen, und das aktuelle Setup macht mich bullish auf $ZEC.
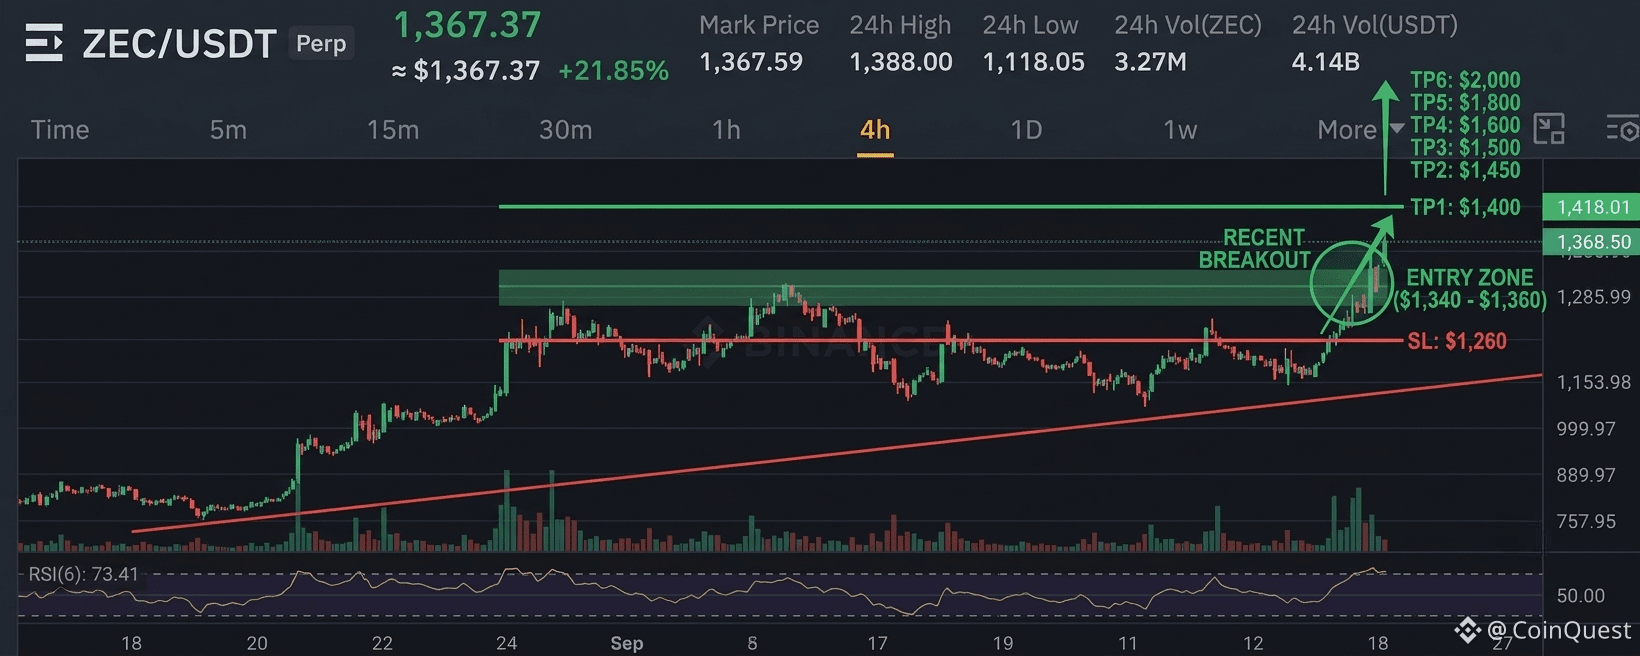
Long-Setup
Einstieg: 1.340 $ - 1.360 $
TP: 1.400 $ - 1.450 $ - 1.500 $ - 1.600 $ - 1.800 $ - 2.000 $
SL: 1.260 $
Mal sehen, wie sich dieses Setup entwickelt.....
Trade hier 👇
{future}(ZECUSDT)
#ZECUSDT #FedRateWatch #TradingwithCoinQuest
🔥 Ist $ZEC getting bereit für 2.000 $?
ZEC ist bereits dabei, einen starken Move zu machen..... und die nächste Frage ist, ob dieser Run die 2.000-$-Marke erreichen kann.
Zcash wird oft mit dem Bitcoin des Privacy-Sektors verglichen, und das aktuelle Setup macht mich bullish auf $ZEC .
Long-Setup
Einstieg: 1.340 $ - 1.360 $
TP: 1.400 $ - 1.450 $ - 1.500 $ - 1.600 $ - 1.800 $ - 2.000 $
SL: 1.260 $
Mal sehen, wie sich dieses Setup entwickelt.....
Trade hier 👇
#ZECUSDT #FedRateWatch #TradingwithCoinQuest
ZEC ist bereits dabei, einen starken Move zu machen..... und die nächste Frage ist, ob dieser Run die 2.000-$-Marke erreichen kann.
Zcash wird oft mit dem Bitcoin des Privacy-Sektors verglichen, und das aktuelle Setup macht mich bullish auf $ZEC .
Long-Setup
Einstieg: 1.340 $ - 1.360 $
TP: 1.400 $ - 1.450 $ - 1.500 $ - 1.600 $ - 1.800 $ - 2.000 $
SL: 1.260 $
Mal sehen, wie sich dieses Setup entwickelt.....
Trade hier 👇
#ZECUSDT #FedRateWatch #TradingwithCoinQuest
2
715

·
--
Bullisch
Übersetzung ansehen
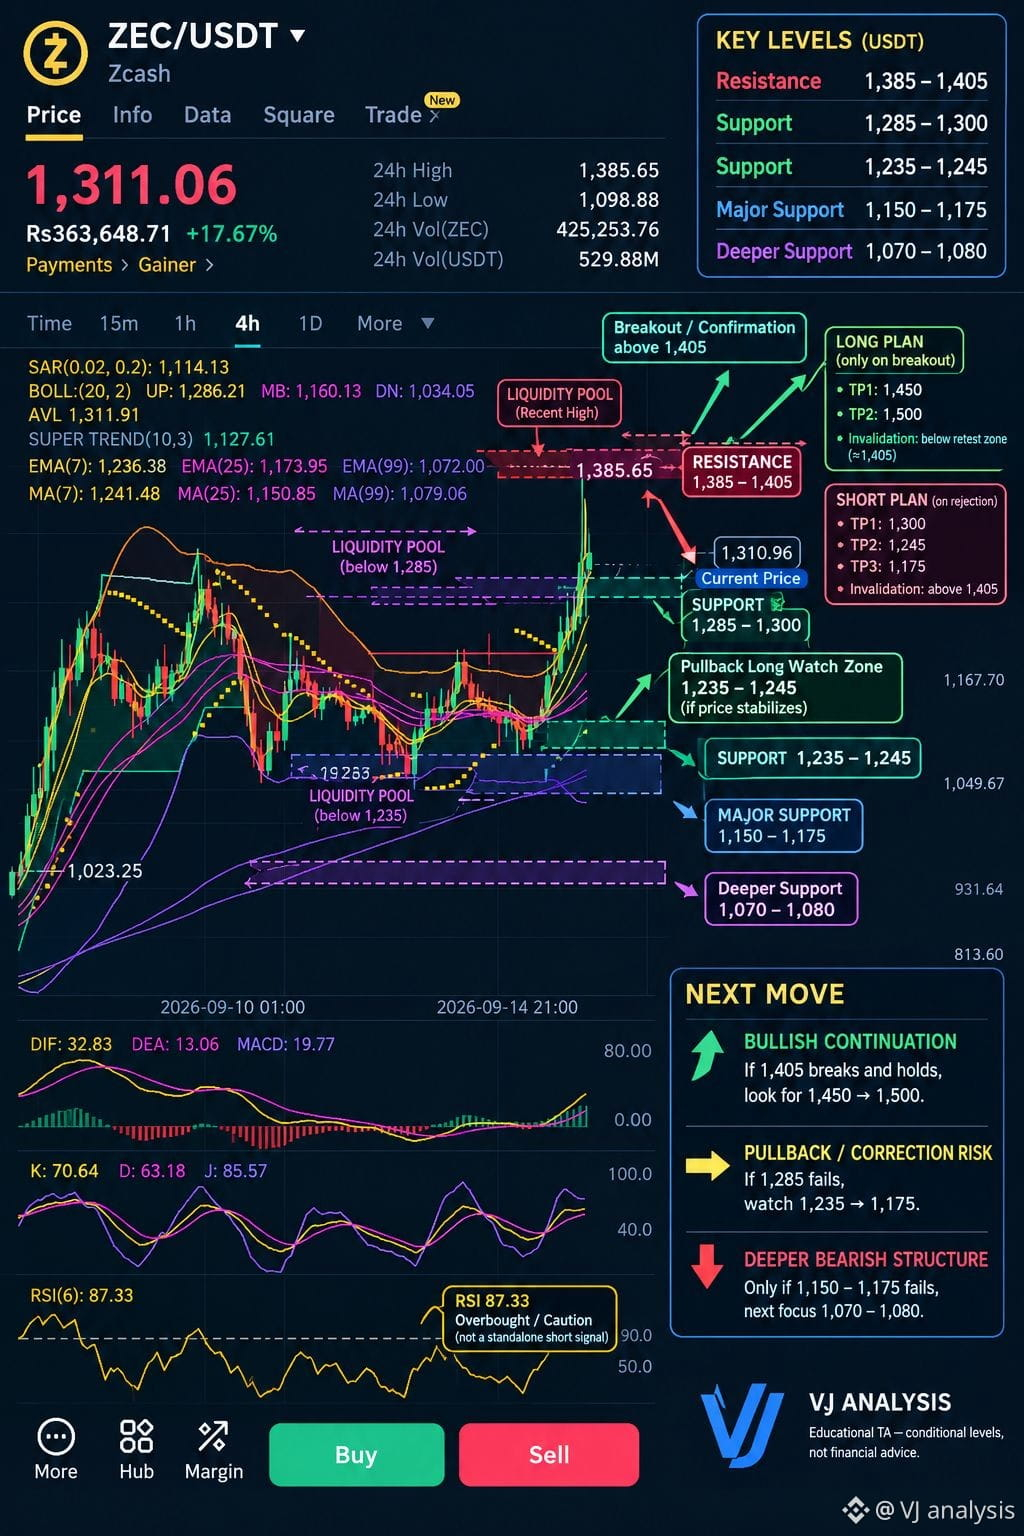
Based strictly on the chart with price around 1,311 #ZECUSDT , I would not chase a market entry here. The chart is bullish but RSI(6) is 87.33, so the immediate move is stretched.
ZEC/USDT 4H trade map
Setup
Entry
Stop / invalidation
Targets
🟢 Long — pullback
1,285–1,300 after support holds
<1,235
1,350 → 1,385 → 1,450#ZECUSDT
🟢 Long — breakout
>1,405 after a 4H close/hold
~1,385
1,450 → 1,500#ZECUSDT
🔴 Short — resistance rejection
1,385–1,405 only after rejection
>1,420
1,300 → 1,245 → 1,175
🔴 Short — support breakdown
<1,285 after confirmation
>1,315
1,245 → 1,175
At the current 1,311
Long: I would wait for 1,285–1,300 and confirmation that buyers defend it.
Short: I would not short 1,311 simply because RSI is overbought. The stronger short setup is a confirmed rejection around 1,385–1,405.
Next move to watch
1,311 → 1,385
If buyers push through 1,385 and establish above 1,405, continuation toward 1,450–1,500 becomes the relevant chart scenario.
1,311 → 1,285
If 1,285 breaks, watch 1,235–1,245. A break of that zone opens the deeper 1,150–1,175 area.
My chart-based preference: wait rather than enter immediately at 1,311. The two cleaner conditional setups are long on a defended 1,285–1,300 pullback or short on a confirmed 1,385–1,405 rejection.
These are technical levels from your screenshot, not a guarantee of outcome; crypto can move through all of these levels very quickly.#ZECUSDT
Based strictly on the chart with price around 1,311 #ZECUSDT , I would not chase a market entry here. The chart is bullish but RSI(6) is 87.33, so the immediate move is stretched.
ZEC/USDT 4H trade map
Setup
Entry
Stop / invalidation
Targets
🟢 Long — pullback
1,285–1,300 after support holds
<1,235
1,350 → 1,385 → 1,450#ZECUSDT
🟢 Long — breakout
>1,405 after a 4H close/hold
~1,385
1,450 → 1,500#ZECUSDT
🔴 Short — resistance rejection
1,385–1,405 only after rejection
>1,420
1,300 → 1,245 → 1,175
🔴 Short — support breakdown
<1,285 after confirmation
>1,315
1,245 → 1,175
At the current 1,311
Long: I would wait for 1,285–1,300 and confirmation that buyers defend it.
Short: I would not short 1,311 simply because RSI is overbought. The stronger short setup is a confirmed rejection around 1,385–1,405.
Next move to watch
1,311 → 1,385
If buyers push through 1,385 and establish above 1,405, continuation toward 1,450–1,500 becomes the relevant chart scenario.
1,311 → 1,285
If 1,285 breaks, watch 1,235–1,245. A break of that zone opens the deeper 1,150–1,175 area.
My chart-based preference: wait rather than enter immediately at 1,311. The two cleaner conditional setups are long on a defended 1,285–1,300 pullback or short on a confirmed 1,385–1,405 rejection.
These are technical levels from your screenshot, not a guarantee of outcome; crypto can move through all of these levels very quickly.#ZECUSDT
ZEC/USDT 4H trade map
Setup
Entry
Stop / invalidation
Targets
🟢 Long — pullback
1,285–1,300 after support holds
<1,235
1,350 → 1,385 → 1,450#ZECUSDT
🟢 Long — breakout
>1,405 after a 4H close/hold
~1,385
1,450 → 1,500#ZECUSDT
🔴 Short — resistance rejection
1,385–1,405 only after rejection
>1,420
1,300 → 1,245 → 1,175
🔴 Short — support breakdown
<1,285 after confirmation
>1,315
1,245 → 1,175
At the current 1,311
Long: I would wait for 1,285–1,300 and confirmation that buyers defend it.
Short: I would not short 1,311 simply because RSI is overbought. The stronger short setup is a confirmed rejection around 1,385–1,405.
Next move to watch
1,311 → 1,385
If buyers push through 1,385 and establish above 1,405, continuation toward 1,450–1,500 becomes the relevant chart scenario.
1,311 → 1,285
If 1,285 breaks, watch 1,235–1,245. A break of that zone opens the deeper 1,150–1,175 area.
My chart-based preference: wait rather than enter immediately at 1,311. The two cleaner conditional setups are long on a defended 1,285–1,300 pullback or short on a confirmed 1,385–1,405 rejection.
These are technical levels from your screenshot, not a guarantee of outcome; crypto can move through all of these levels very quickly.#ZECUSDT
408

·
--
Bullisch
$ZEC Tut Genau das, wozu die Grafik hingewiesen hat! - Was kommt als Nächstes für #ZEC vor dem Trading?
{future}(ZECUSDT)
Vor zwei Tagen habe ich darauf hingewiesen, dass ZEC Momentum für einen weiteren bullischen Move aufbaut. Jetzt haben wir den Move.
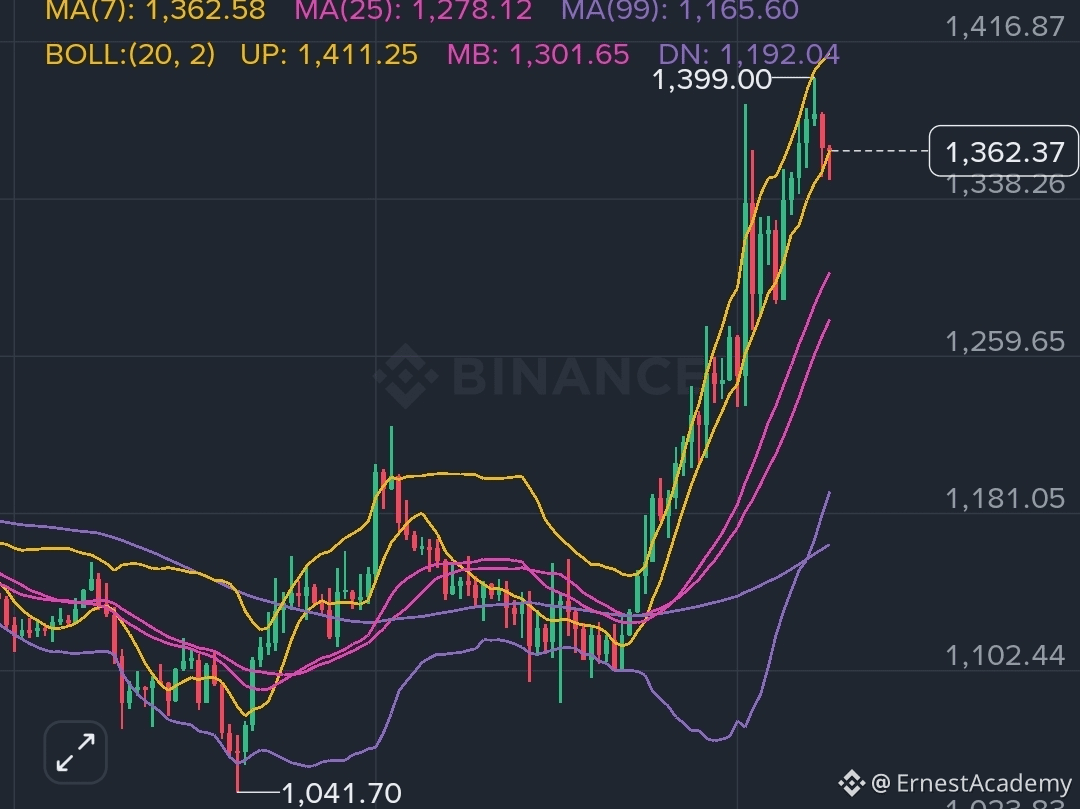
ZEC hat ein neues Allzeithoch von 1,399 $ erreicht, wobei der Preis aktuell bei etwa 1,362 $ liegt und am Tag um mehr als 18 Prozent gestiegen ist. Aktuelle Marktdaten bestätigen außerdem den starken Ausbruch: ZEC erreichte 1,399 $
Wenn man sich den 1-Stunden-Chart ansieht, ist die Struktur klar bullisch. Der Preis hält sich oberhalb des jüngsten Ausbruchsbereichs und bleibt über den wichtigen gleitenden Durchschnitten, die im Chart gezeigt sind. Der Move von etwa 1,040 $ bis nahezu 1,400 $ war aggressiv, daher wäre es nicht überraschend, wenn es zu einer Abkühlung kommt.
Was mir hier gefällt, ist, dass das Momentum nach dem ersten Anstoß nicht verschwunden ist. Die Käufer sind weiter eingestiegen und haben schließlich die vorherigen Hochs ausgebrochen.
Aber jetzt kommt der interessante Teil;
$ZEC versucht nicht mehr zu beweisen, dass es ausbrechen kann. Das hat es bereits getan.
Die Frage ist, ob es diese neuen Niveaus halten kann und den früheren Widerstand in Unterstützung verwandelt.
Insgesamt würde ich den Chart als bullisch beschreiben, aber mit zunehmender Volatilität.
Der Move hat bereits bewiesen, dass die Käufer die Kontrolle haben. Jetzt muss $ZEC beweisen, dass der Bereich von 1,300+ zu einer nachhaltigen Basis werden kann – und nicht nur der nächste Stopp auf einem vertikalen Rallye.
#ZECUSDT
$ZEC Tut Genau das, wozu die Grafik hingewiesen hat! - Was kommt als Nächstes für #ZEC vor dem Trading?
Vor zwei Tagen habe ich darauf hingewiesen, dass ZEC Momentum für einen weiteren bullischen Move aufbaut. Jetzt haben wir den Move.
ZEC hat ein neues Allzeithoch von 1,399 $ erreicht, wobei der Preis aktuell bei etwa 1,362 $ liegt und am Tag um mehr als 18 Prozent gestiegen ist. Aktuelle Marktdaten bestätigen außerdem den starken Ausbruch: ZEC erreichte 1,399 $
Wenn man sich den 1-Stunden-Chart ansieht, ist die Struktur klar bullisch. Der Preis hält sich oberhalb des jüngsten Ausbruchsbereichs und bleibt über den wichtigen gleitenden Durchschnitten, die im Chart gezeigt sind. Der Move von etwa 1,040 $ bis nahezu 1,400 $ war aggressiv, daher wäre es nicht überraschend, wenn es zu einer Abkühlung kommt.
Was mir hier gefällt, ist, dass das Momentum nach dem ersten Anstoß nicht verschwunden ist. Die Käufer sind weiter eingestiegen und haben schließlich die vorherigen Hochs ausgebrochen.
Aber jetzt kommt der interessante Teil;
$ZEC versucht nicht mehr zu beweisen, dass es ausbrechen kann. Das hat es bereits getan.
Die Frage ist, ob es diese neuen Niveaus halten kann und den früheren Widerstand in Unterstützung verwandelt.
Insgesamt würde ich den Chart als bullisch beschreiben, aber mit zunehmender Volatilität.
Der Move hat bereits bewiesen, dass die Käufer die Kontrolle haben. Jetzt muss $ZEC beweisen, dass der Bereich von 1,300+ zu einer nachhaltigen Basis werden kann – und nicht nur der nächste Stopp auf einem vertikalen Rallye.
#ZECUSDT
Vor zwei Tagen habe ich darauf hingewiesen, dass ZEC Momentum für einen weiteren bullischen Move aufbaut. Jetzt haben wir den Move.
ZEC hat ein neues Allzeithoch von 1,399 $ erreicht, wobei der Preis aktuell bei etwa 1,362 $ liegt und am Tag um mehr als 18 Prozent gestiegen ist. Aktuelle Marktdaten bestätigen außerdem den starken Ausbruch: ZEC erreichte 1,399 $
Wenn man sich den 1-Stunden-Chart ansieht, ist die Struktur klar bullisch. Der Preis hält sich oberhalb des jüngsten Ausbruchsbereichs und bleibt über den wichtigen gleitenden Durchschnitten, die im Chart gezeigt sind. Der Move von etwa 1,040 $ bis nahezu 1,400 $ war aggressiv, daher wäre es nicht überraschend, wenn es zu einer Abkühlung kommt.
Was mir hier gefällt, ist, dass das Momentum nach dem ersten Anstoß nicht verschwunden ist. Die Käufer sind weiter eingestiegen und haben schließlich die vorherigen Hochs ausgebrochen.
Aber jetzt kommt der interessante Teil;
$ZEC versucht nicht mehr zu beweisen, dass es ausbrechen kann. Das hat es bereits getan.
Die Frage ist, ob es diese neuen Niveaus halten kann und den früheren Widerstand in Unterstützung verwandelt.
Insgesamt würde ich den Chart als bullisch beschreiben, aber mit zunehmender Volatilität.
Der Move hat bereits bewiesen, dass die Käufer die Kontrolle haben. Jetzt muss $ZEC beweisen, dass der Bereich von 1,300+ zu einer nachhaltigen Basis werden kann – und nicht nur der nächste Stopp auf einem vertikalen Rallye.
#ZECUSDT
1
1
407

·
--
Artikel
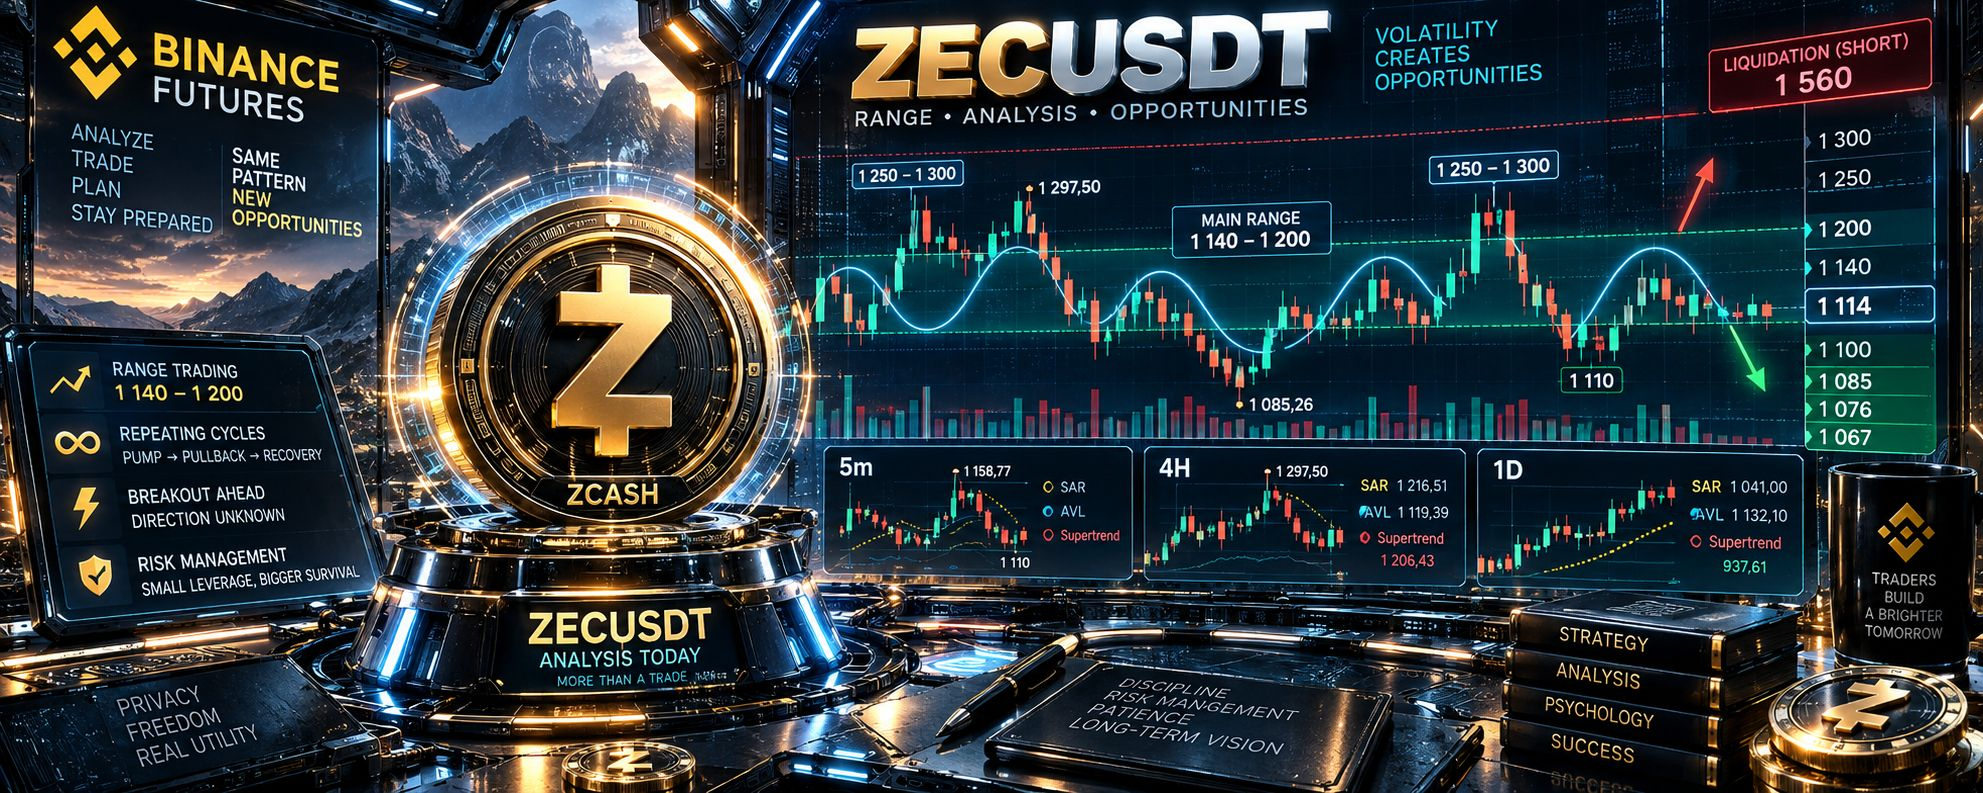
$ZEC: ein weiterer Rückprall innerhalb der bekannten SpanneHallo, liebe Freunde!
Die unsichtbare Beständigkeit stellt uns nun schon seit mehreren Tagen $ZEC zur Verfügung. Der Preis von 1 076 reicht fast bis zu 1 300, bewegt sich jedoch häufiger innerhalb der Spanne von etwa 1 140–1 200. Dabei fällt eine gewisse Häufigkeit auf, mit der sich dieselbe Sinuskurve in bestimmten Bereichen wiederholt: Anstieg, Rücksetzer, der Versuch der Erholung und erneut ein Absinken.
$ZEC: ein weiterer Rückprall innerhalb der bekannten Spanne
Hallo, liebe Freunde!
Die unsichtbare Beständigkeit stellt uns nun schon seit mehreren Tagen $ZEC zur Verfügung. Der Preis von 1 076 reicht fast bis zu 1 300, bewegt sich jedoch häufiger innerhalb der Spanne von etwa 1 140–1 200. Dabei fällt eine gewisse Häufigkeit auf, mit der sich dieselbe Sinuskurve in bestimmten Bereichen wiederholt: Anstieg, Rücksetzer, der Versuch der Erholung und erneut ein Absinken.
Die unsichtbare Beständigkeit stellt uns nun schon seit mehreren Tagen $ZEC zur Verfügung. Der Preis von 1 076 reicht fast bis zu 1 300, bewegt sich jedoch häufiger innerhalb der Spanne von etwa 1 140–1 200. Dabei fällt eine gewisse Häufigkeit auf, mit der sich dieselbe Sinuskurve in bestimmten Bereichen wiederholt: Anstieg, Rücksetzer, der Versuch der Erholung und erneut ein Absinken.
1
1.8k

Übersetzung ansehen
ZEC just bounced off the 4‑hour swing low, looks like it’s gearing up for a move.
🟢 $ZEC LONG 📈
Entry → $1,332.83-$1,335.49
Stop → $1,294.14 (-3.0%)
TP1 → $1,354.17 (+1.5%)
TP2 → $1,400.87 (+5.0%)
R/R 1:1.7 • Confidence 65%
We got a CHoCH break, CVD is bullish, and a fresh FVG lines up right on the OB. The price is holding the OB/FVG overlap, so the structure feels like a clean bullish swing.
A 3 % stop is pretty tight on a volatile coin, so stick to low‑double‑digit leverage.
Take half off the table once you hit the first target around 1.7 R.
DYOR — this isn't financial advice, size your risk accordingly 🙏
$ZEC #ZECUSDT #FedRateWatch #TradingSignals #Write2Earn
ZEC just bounced off the 4‑hour swing low, looks like it’s gearing up for a move.
🟢 $ZEC LONG 📈
Entry → $1,332.83-$1,335.49
Stop → $1,294.14 (-3.0%)
TP1 → $1,354.17 (+1.5%)
TP2 → $1,400.87 (+5.0%)
R/R 1:1.7 • Confidence 65%
We got a CHoCH break, CVD is bullish, and a fresh FVG lines up right on the OB. The price is holding the OB/FVG overlap, so the structure feels like a clean bullish swing.
A 3 % stop is pretty tight on a volatile coin, so stick to low‑double‑digit leverage.
Take half off the table once you hit the first target around 1.7 R.
DYOR — this isn't financial advice, size your risk accordingly 🙏
$ZEC #ZECUSDT #FedRateWatch #TradingSignals #Write2Earn
🟢 $ZEC LONG 📈
Entry → $1,332.83-$1,335.49
Stop → $1,294.14 (-3.0%)
TP1 → $1,354.17 (+1.5%)
TP2 → $1,400.87 (+5.0%)
R/R 1:1.7 • Confidence 65%
We got a CHoCH break, CVD is bullish, and a fresh FVG lines up right on the OB. The price is holding the OB/FVG overlap, so the structure feels like a clean bullish swing.
A 3 % stop is pretty tight on a volatile coin, so stick to low‑double‑digit leverage.
Take half off the table once you hit the first target around 1.7 R.
DYOR — this isn't financial advice, size your risk accordingly 🙏
$ZEC #ZECUSDT #FedRateWatch #TradingSignals #Write2Earn
226

·
--
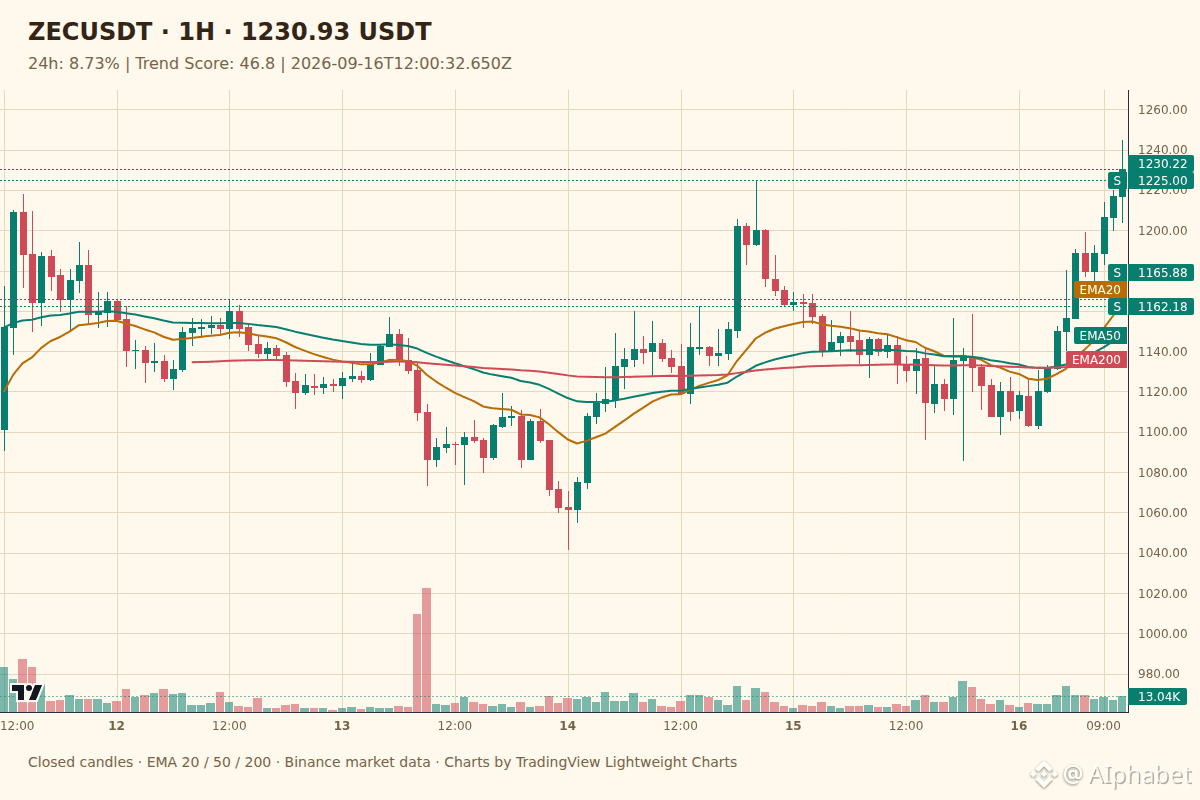
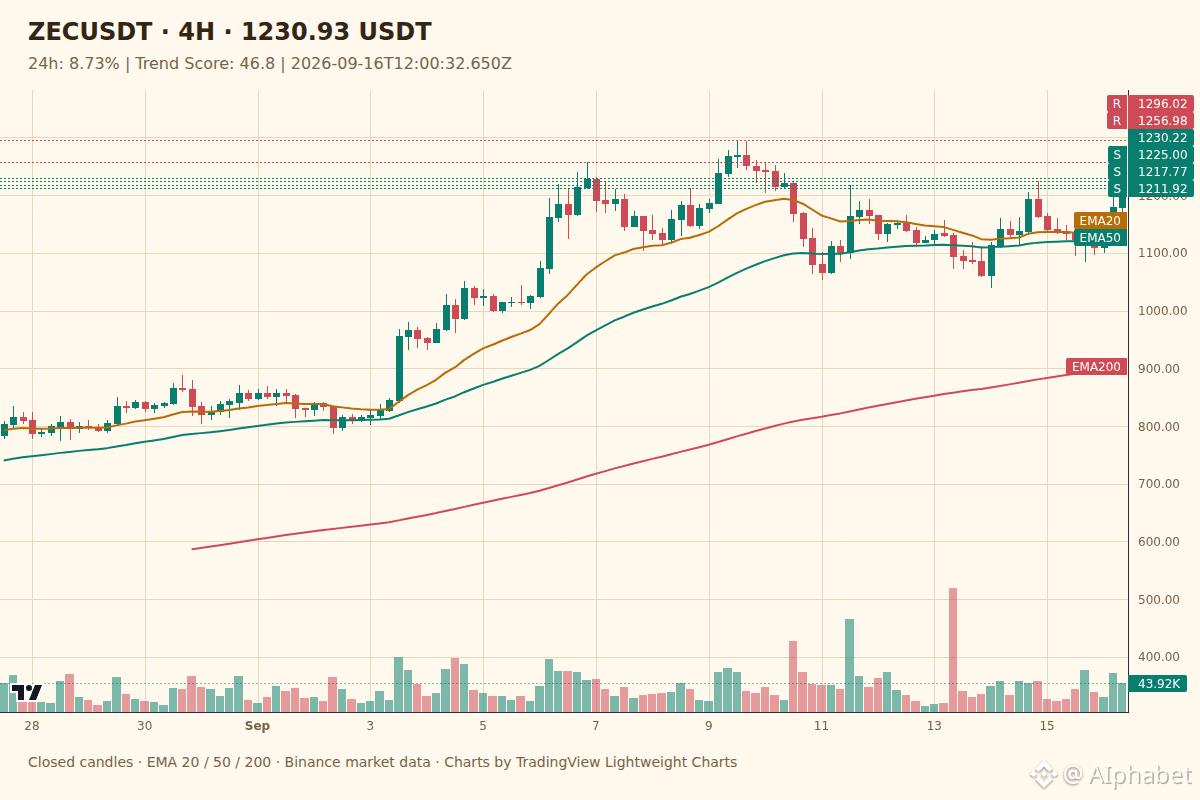
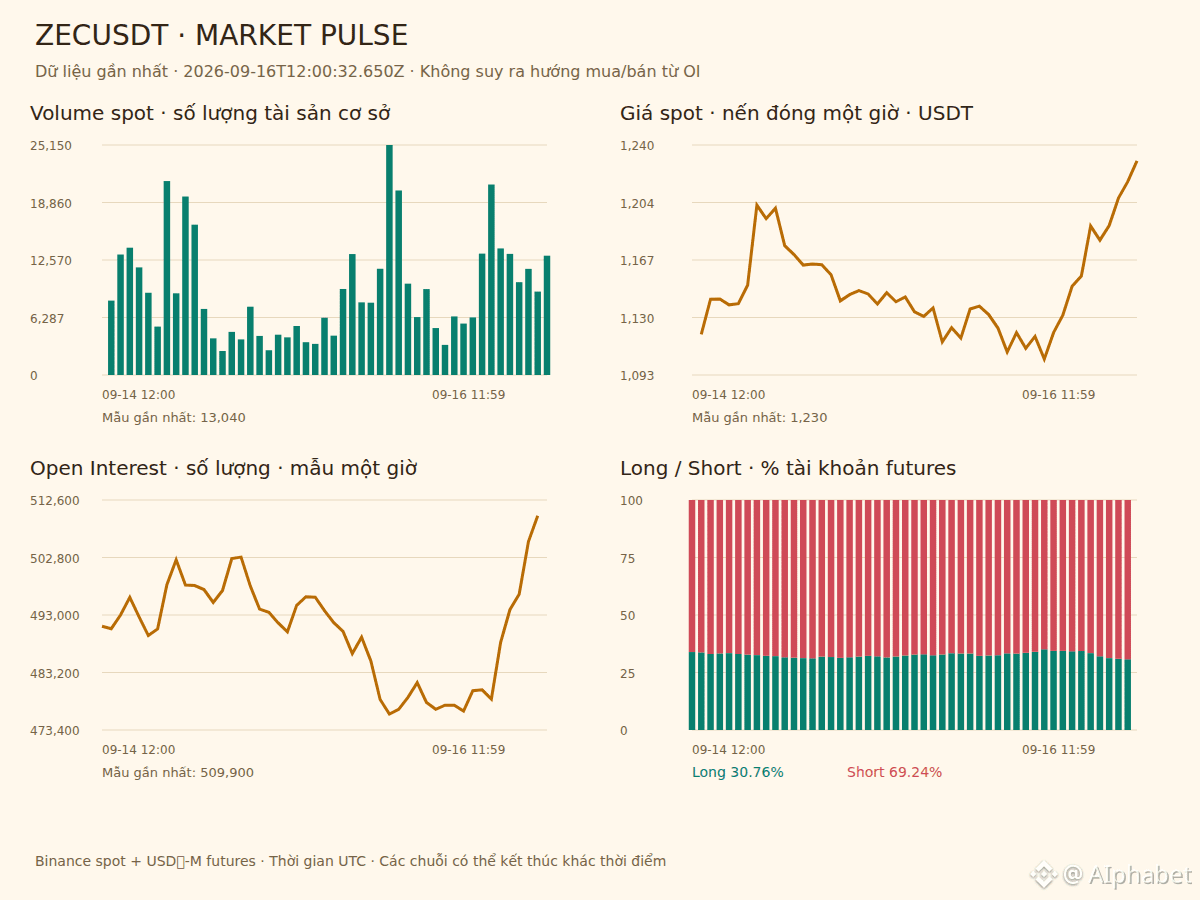
ZEC bricht kraftvoll aus – mit herausragendem Handelsvolumen
Das Handelsvolumen steigt plötzlich in einem lebhaften Tempo auf dem 1‑Stunden‑Chart an, wodurch das Diagramm $ZEC deutlich klarer wirkt.
Ich achte gerade auf die Zone 1225 von $ZEC. Der Preis hat die früheren Widerstände offiziell durchbrochen – gestützt von einem recht entschlossenen Kaufdruck. Der Relative‑Strength‑Indikator ist bereits auf ein Hoch geklettert, so als würde eine zusammengepresste Feder nun mit Schwung nach vorn ausschlagen.
Wenn jedoch kurzfristiger Verkaufsdruck zur Gewinnmitnahme auftaucht, könnte der Preis zurückkehren, um die soeben überwundenen Unterstützungszonen erneut zu testen.
Wenn der Aufwärtstrend weiterhin stabil bleibt, kann der Preis durchaus in Richtung höherer Widerstandsbereiche oberhalb davon laufen.
Dass sich ein technischer Indikator in einem hohen Bereich befindet, geht häufig mit dem Risiko plötzlicher Kursausschläge (Rangeln/Zittern) einher – ihr solltet euer Kapital umsichtig verwalten.
#ZECUSDT #Crypto
ZEC bricht kraftvoll aus – mit herausragendem Handelsvolumen
Das Handelsvolumen steigt plötzlich in einem lebhaften Tempo auf dem 1‑Stunden‑Chart an, wodurch das Diagramm $ZEC deutlich klarer wirkt.
Ich achte gerade auf die Zone 1225 von $ZEC . Der Preis hat die früheren Widerstände offiziell durchbrochen – gestützt von einem recht entschlossenen Kaufdruck. Der Relative‑Strength‑Indikator ist bereits auf ein Hoch geklettert, so als würde eine zusammengepresste Feder nun mit Schwung nach vorn ausschlagen.
Wenn jedoch kurzfristiger Verkaufsdruck zur Gewinnmitnahme auftaucht, könnte der Preis zurückkehren, um die soeben überwundenen Unterstützungszonen erneut zu testen.
Wenn der Aufwärtstrend weiterhin stabil bleibt, kann der Preis durchaus in Richtung höherer Widerstandsbereiche oberhalb davon laufen.
Dass sich ein technischer Indikator in einem hohen Bereich befindet, geht häufig mit dem Risiko plötzlicher Kursausschläge (Rangeln/Zittern) einher – ihr solltet euer Kapital umsichtig verwalten.
#ZECUSDT #Crypto
Das Handelsvolumen steigt plötzlich in einem lebhaften Tempo auf dem 1‑Stunden‑Chart an, wodurch das Diagramm $ZEC deutlich klarer wirkt.
Ich achte gerade auf die Zone 1225 von $ZEC . Der Preis hat die früheren Widerstände offiziell durchbrochen – gestützt von einem recht entschlossenen Kaufdruck. Der Relative‑Strength‑Indikator ist bereits auf ein Hoch geklettert, so als würde eine zusammengepresste Feder nun mit Schwung nach vorn ausschlagen.
Wenn jedoch kurzfristiger Verkaufsdruck zur Gewinnmitnahme auftaucht, könnte der Preis zurückkehren, um die soeben überwundenen Unterstützungszonen erneut zu testen.
Wenn der Aufwärtstrend weiterhin stabil bleibt, kann der Preis durchaus in Richtung höherer Widerstandsbereiche oberhalb davon laufen.
Dass sich ein technischer Indikator in einem hohen Bereich befindet, geht häufig mit dem Risiko plötzlicher Kursausschläge (Rangeln/Zittern) einher – ihr solltet euer Kapital umsichtig verwalten.
#ZECUSDT #Crypto
201
·
--
Bullisch
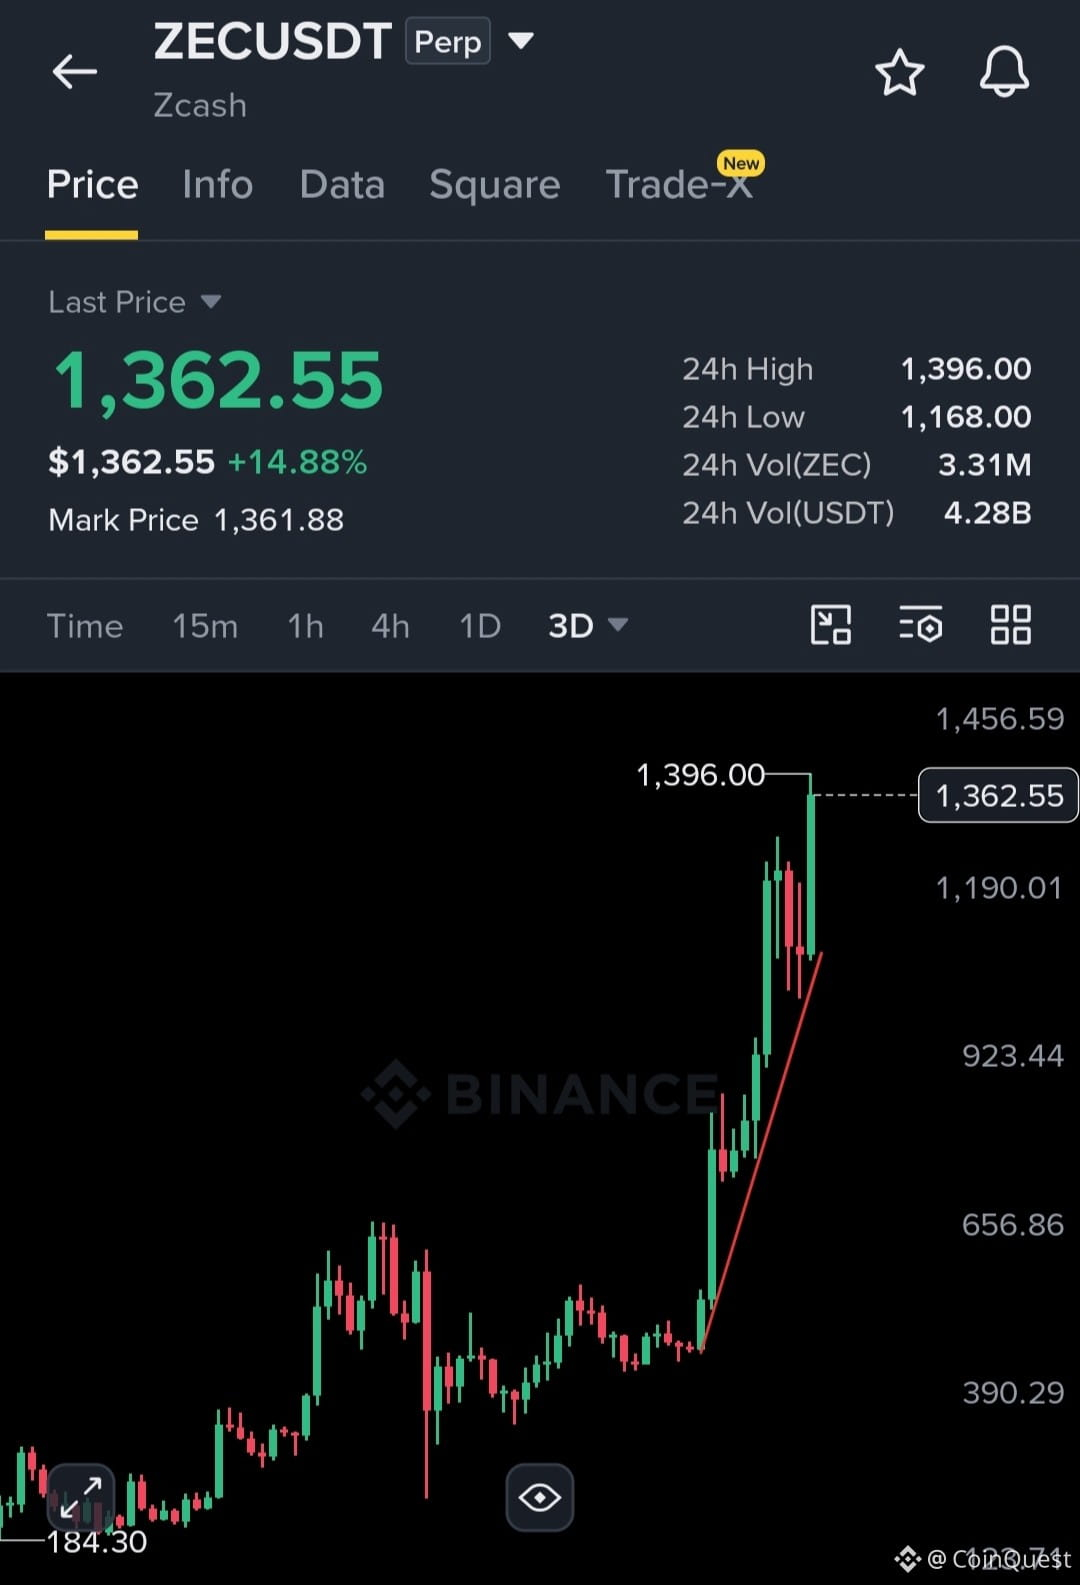
Wenn ich auf $ZEC um die 250-Dollar-Marke zurückblicke, sah das Setup damals ganz anders aus als das, was wir heute sehen
Ich habe ZEC immer wieder ins Spiel gebracht, weil die größere These nie nur darin bestand, einen kleinen Bounce einzufangen. Die Idee war, dass, wenn sich die Struktur weiterentwickelt, 1.000 US-Dollar möglich sind – und ich habe sogar darüber gesprochen, dass 5.000 langfristig eine Option sein könnten
Inzwischen ist ZEC weit über diese Levels hinausgegangen, und die Leute, die die Volatilität tatsächlich durchgehalten haben, haben den Unterschied gesehen zwischen jedem Kerzenmoment zu handeln und einer starken These Zeit zu geben, sich zu entfalten
Offensichtlich weiß niemand, wie weit dieser Zyklus ZEC noch treiben kann, aber die Bewegung von 250 US-Dollar auf die aktuellen Kurse zeigt, warum ich es vorziehe, auf das große Ganze zu schauen, statt mich nur auf den heutigen Preis zu konzentrieren
{future}(ZECUSDT)
#ZECUSDT #FedSEPProjects2026RateAt4.1%
Wenn ich auf $ZEC um die 250-Dollar-Marke zurückblicke, sah das Setup damals ganz anders aus als das, was wir heute sehen
Ich habe ZEC immer wieder ins Spiel gebracht, weil die größere These nie nur darin bestand, einen kleinen Bounce einzufangen. Die Idee war, dass, wenn sich die Struktur weiterentwickelt, 1.000 US-Dollar möglich sind – und ich habe sogar darüber gesprochen, dass 5.000 langfristig eine Option sein könnten
Inzwischen ist ZEC weit über diese Levels hinausgegangen, und die Leute, die die Volatilität tatsächlich durchgehalten haben, haben den Unterschied gesehen zwischen jedem Kerzenmoment zu handeln und einer starken These Zeit zu geben, sich zu entfalten
Offensichtlich weiß niemand, wie weit dieser Zyklus ZEC noch treiben kann, aber die Bewegung von 250 US-Dollar auf die aktuellen Kurse zeigt, warum ich es vorziehe, auf das große Ganze zu schauen, statt mich nur auf den heutigen Preis zu konzentrieren
#ZECUSDT #FedSEPProjects2026RateAt4.1%
Ich habe ZEC immer wieder ins Spiel gebracht, weil die größere These nie nur darin bestand, einen kleinen Bounce einzufangen. Die Idee war, dass, wenn sich die Struktur weiterentwickelt, 1.000 US-Dollar möglich sind – und ich habe sogar darüber gesprochen, dass 5.000 langfristig eine Option sein könnten
Inzwischen ist ZEC weit über diese Levels hinausgegangen, und die Leute, die die Volatilität tatsächlich durchgehalten haben, haben den Unterschied gesehen zwischen jedem Kerzenmoment zu handeln und einer starken These Zeit zu geben, sich zu entfalten
Offensichtlich weiß niemand, wie weit dieser Zyklus ZEC noch treiben kann, aber die Bewegung von 250 US-Dollar auf die aktuellen Kurse zeigt, warum ich es vorziehe, auf das große Ganze zu schauen, statt mich nur auf den heutigen Preis zu konzentrieren
#ZECUSDT #FedSEPProjects2026RateAt4.1%
279
·
--
Bullisch
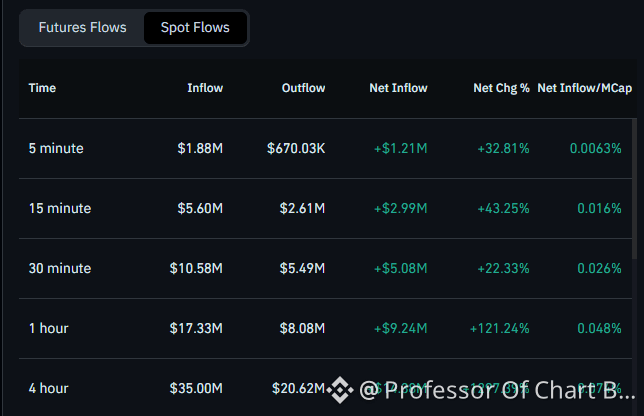
Händler bieten aggressiv $ZEC sowohl in Spot- als auch in Derivate-Orderbüchern und treiben die Nettozuflüsse auf allen Zeitrahmen ins Plus.
In den letzten 4 Stunden hat $ZEC +$25.28M an Netto-Futures-Zuflüssen absorbiert (+4472%) und +$14.38M an Netto-Spot-Zuflüssen (+1297%).
Beschleunigung auf niedrigem Zeitrahmen: Die 5-Minuten-Futures-Zuflüsse sind gerade um +$6.90M (+504%) regelrecht angesprungen, begleitet von +$1.21M bei aggressivem Spot-Kauf.
Orderbuch-Ausrichtung: Spot und Futures zeigen über die 5m-, 15m-, 30m-, 1H- und 4H-Zeitfenster hinweg einen Nettoabfluss von null.
Auswirkung auf den Preis: Anhaltende Spot-Nachfrage bei gleichzeitig schnell wachsendem Open Interest beseitigt den Verkaufswiderstand im Hintergrund und räumt den Weg für einen unmittelbaren Momentum-Schub.
#ZECUSDT
Händler bieten aggressiv $ZEC sowohl in Spot- als auch in Derivate-Orderbüchern und treiben die Nettozuflüsse auf allen Zeitrahmen ins Plus.
In den letzten 4 Stunden hat $ZEC +$25.28M an Netto-Futures-Zuflüssen absorbiert (+4472%) und +$14.38M an Netto-Spot-Zuflüssen (+1297%).
Beschleunigung auf niedrigem Zeitrahmen: Die 5-Minuten-Futures-Zuflüsse sind gerade um +$6.90M (+504%) regelrecht angesprungen, begleitet von +$1.21M bei aggressivem Spot-Kauf.
Orderbuch-Ausrichtung: Spot und Futures zeigen über die 5m-, 15m-, 30m-, 1H- und 4H-Zeitfenster hinweg einen Nettoabfluss von null.
Auswirkung auf den Preis: Anhaltende Spot-Nachfrage bei gleichzeitig schnell wachsendem Open Interest beseitigt den Verkaufswiderstand im Hintergrund und räumt den Weg für einen unmittelbaren Momentum-Schub.
#ZECUSDT
In den letzten 4 Stunden hat $ZEC +$25.28M an Netto-Futures-Zuflüssen absorbiert (+4472%) und +$14.38M an Netto-Spot-Zuflüssen (+1297%).
Beschleunigung auf niedrigem Zeitrahmen: Die 5-Minuten-Futures-Zuflüsse sind gerade um +$6.90M (+504%) regelrecht angesprungen, begleitet von +$1.21M bei aggressivem Spot-Kauf.
Orderbuch-Ausrichtung: Spot und Futures zeigen über die 5m-, 15m-, 30m-, 1H- und 4H-Zeitfenster hinweg einen Nettoabfluss von null.
Auswirkung auf den Preis: Anhaltende Spot-Nachfrage bei gleichzeitig schnell wachsendem Open Interest beseitigt den Verkaufswiderstand im Hintergrund und räumt den Weg für einen unmittelbaren Momentum-Schub.
#ZECUSDT
AngelOfCrypto_-:
nice
1
875

Übersetzung ansehen
Zcash (ZEC) is catching attention today! 🔥
ZEC has seen a strong move over the last 24 hours, with price action showing increased market activity.
📊 Pair: ZEC/USDT
📈 24H Move: ~20%+
🔥 Momentum: Strong
The big question now: Can ZEC maintain this momentum, or will traders start taking profits? 👀
Keep an eye on volume, price levels, and market reaction before making any trading decision.
Are you watching ZEC? 👇
#ZEC #Zcash #ZECUSDT #Altcoin #cryptotrading
{spot}(ZECUSDT)
Zcash (ZEC) is catching attention today! 🔥
ZEC has seen a strong move over the last 24 hours, with price action showing increased market activity.
📊 Pair: ZEC/USDT
📈 24H Move: ~20%+
🔥 Momentum: Strong
The big question now: Can ZEC maintain this momentum, or will traders start taking profits? 👀
Keep an eye on volume, price levels, and market reaction before making any trading decision.
Are you watching ZEC? 👇
#ZEC #Zcash #ZECUSDT #Altcoin #cryptotrading
ZEC has seen a strong move over the last 24 hours, with price action showing increased market activity.
📊 Pair: ZEC/USDT
📈 24H Move: ~20%+
🔥 Momentum: Strong
The big question now: Can ZEC maintain this momentum, or will traders start taking profits? 👀
Keep an eye on volume, price levels, and market reaction before making any trading decision.
Are you watching ZEC? 👇
#ZEC #Zcash #ZECUSDT #Altcoin #cryptotrading
219

Übersetzung ansehen
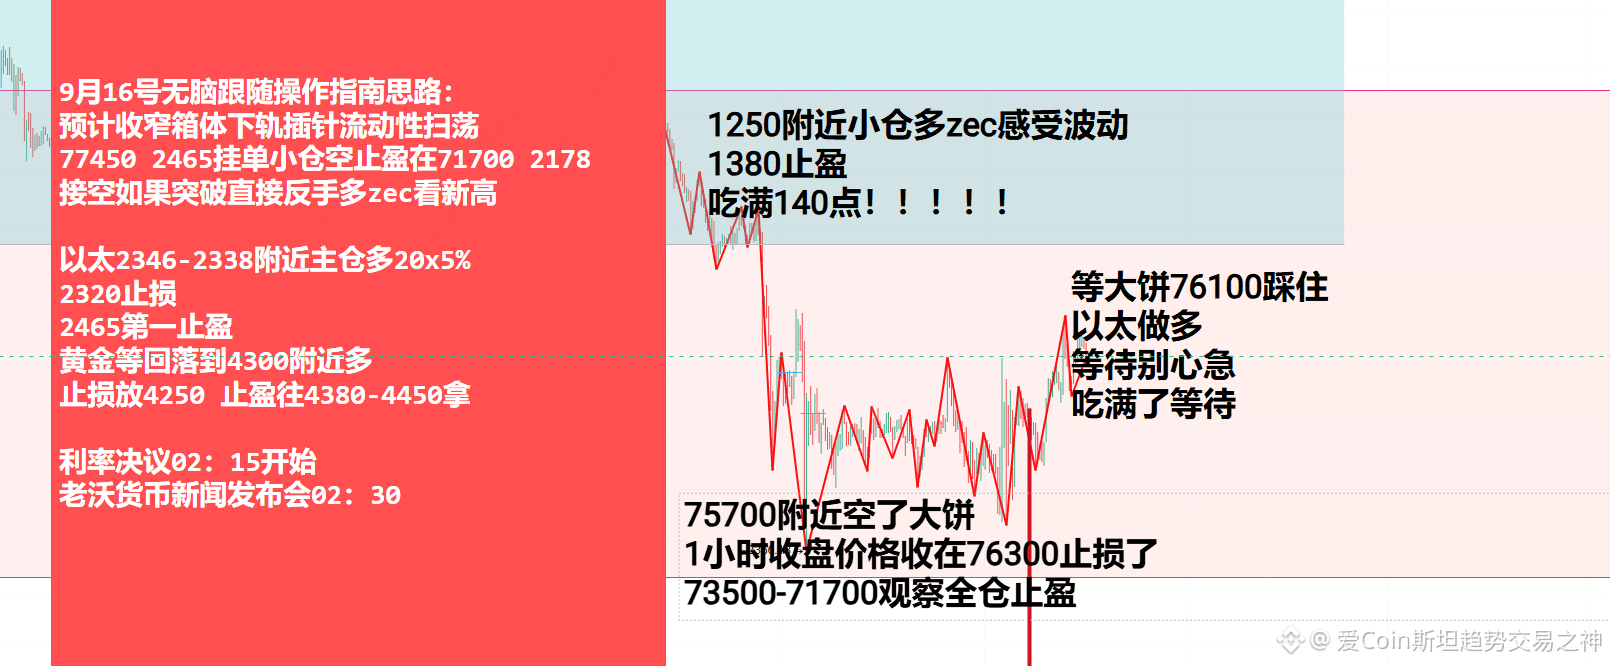
直播策略要怎么做盘面直接写出来,无脑认真阅读跟随吃肉,zec两天吃240点加一起,有没有两波都跟上搞到u的?
我写策略操作方法你执行,配合起来搞u#ZECUSDT
{future}(ZECUSDT)
直播策略要怎么做盘面直接写出来,无脑认真阅读跟随吃肉,zec两天吃240点加一起,有没有两波都跟上搞到u的?
我写策略操作方法你执行,配合起来搞u#ZECUSDT
我写策略操作方法你执行,配合起来搞u#ZECUSDT
2
981

·
--
Übersetzung ansehen
🚨 ZEC/USDT : MOUVEMENT À SURVEILLER ! 🔥
J'utilise 1$ seulement , que Dieu me garde
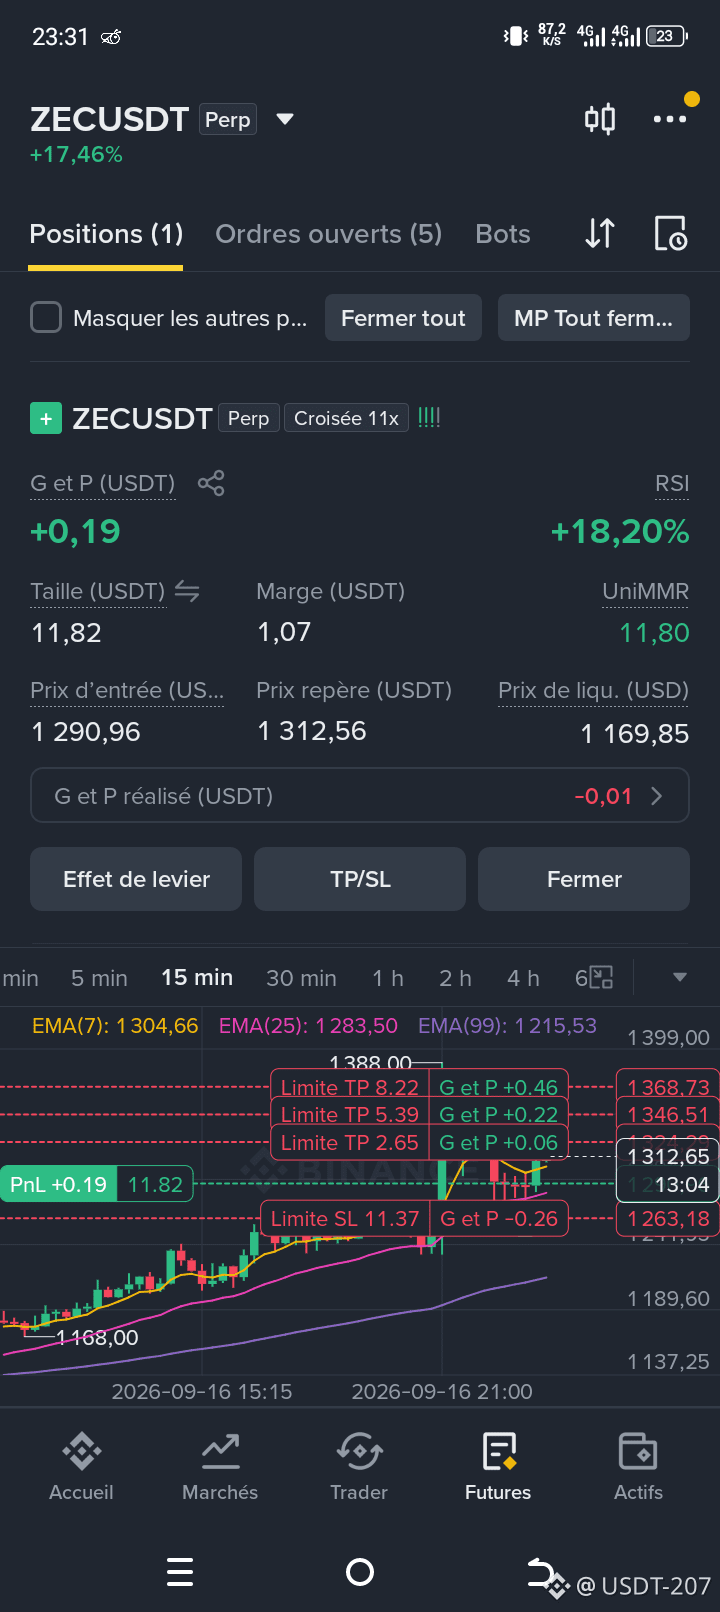
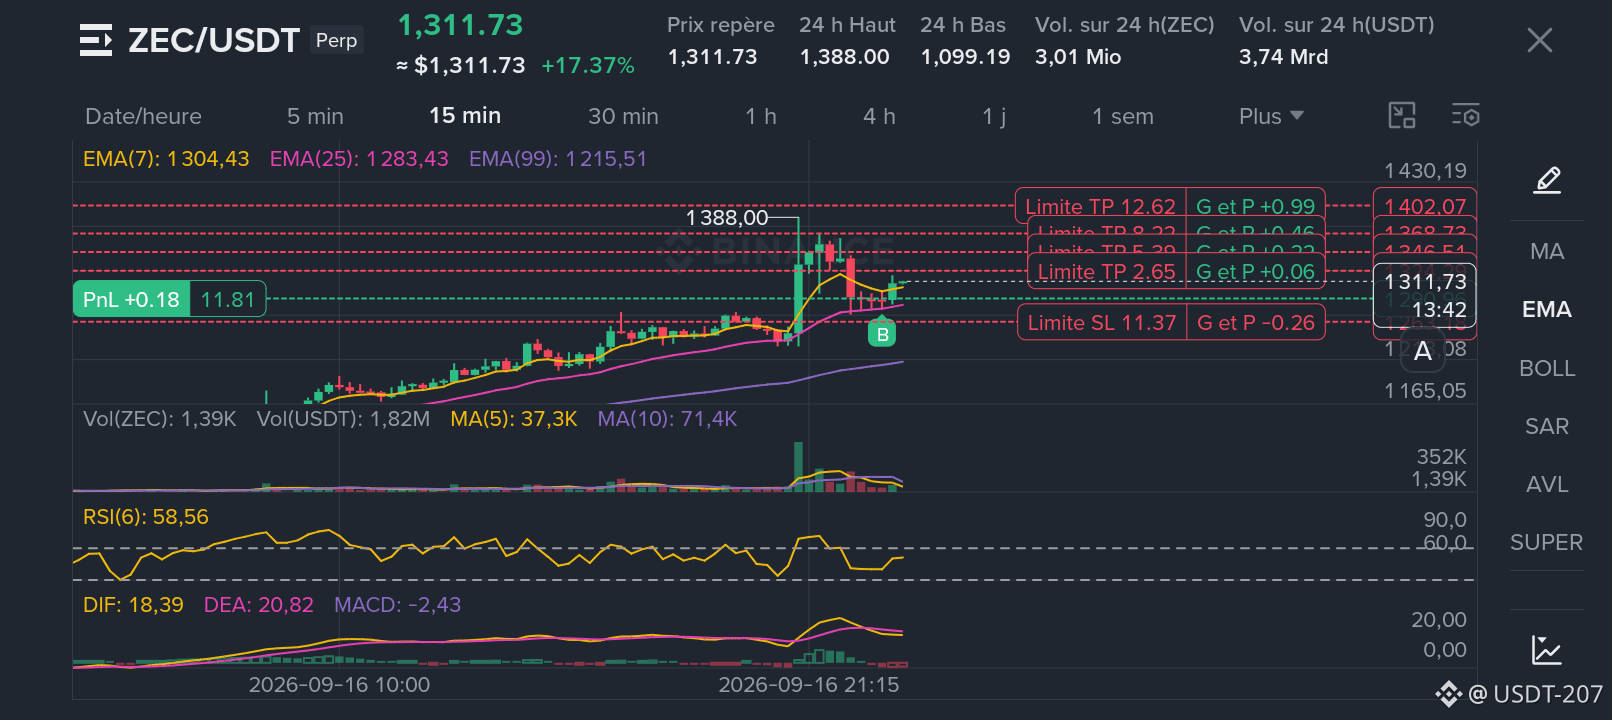
📈 ZEC vient de connaître une forte hausse. Le prix évolue actuellement autour de 1 312 USDT, après avoir atteint 1 388 USDT.
👀 Niveaux à surveiller : 🎯 1 346 USDT
🎯 1 369 USDT
🎯 1 402 USDT
⚠️ Support : autour de 1 263 USDT
📊 Le marché reste dynamique : surveillez le volume, le RSI et la réaction du prix sur ces niveaux avant de prendre une décision.
💬 Quel est ton scénario pour ZEC ? Hausse 📈 ou correction 📉 ?
👍 Like si cette analyse t’est utile.
🔔 Suis ma page pour ne pas manquer les prochaines analyses crypto.
🚀 On analyse le marché ensemble !
#zec #ZECUSDT
🚨 ZEC/USDT : MOUVEMENT À SURVEILLER ! 🔥
J'utilise 1$ seulement , que Dieu me garde
📈 ZEC vient de connaître une forte hausse. Le prix évolue actuellement autour de 1 312 USDT, après avoir atteint 1 388 USDT.
👀 Niveaux à surveiller : 🎯 1 346 USDT
🎯 1 369 USDT
🎯 1 402 USDT
⚠️ Support : autour de 1 263 USDT
📊 Le marché reste dynamique : surveillez le volume, le RSI et la réaction du prix sur ces niveaux avant de prendre une décision.
💬 Quel est ton scénario pour ZEC ? Hausse 📈 ou correction 📉 ?
👍 Like si cette analyse t’est utile.
🔔 Suis ma page pour ne pas manquer les prochaines analyses crypto.
🚀 On analyse le marché ensemble !
#zec #ZECUSDT
J'utilise 1$ seulement , que Dieu me garde
📈 ZEC vient de connaître une forte hausse. Le prix évolue actuellement autour de 1 312 USDT, après avoir atteint 1 388 USDT.
👀 Niveaux à surveiller : 🎯 1 346 USDT
🎯 1 369 USDT
🎯 1 402 USDT
⚠️ Support : autour de 1 263 USDT
📊 Le marché reste dynamique : surveillez le volume, le RSI et la réaction du prix sur ces niveaux avant de prendre une décision.
💬 Quel est ton scénario pour ZEC ? Hausse 📈 ou correction 📉 ?
👍 Like si cette analyse t’est utile.
🔔 Suis ma page pour ne pas manquer les prochaines analyses crypto.
🚀 On analyse le marché ensemble !
#zec #ZECUSDT
2
115

·
--
Bullisch
.🚀 $ZEC trotzt heute komplett der Marktschwerkraft! Massiver Ausbruch! 🔥Während der Rest des Marktes die Enge spürt, habe ich zugesehen, wie Zcash ($ZEC ) eine absolute Meisterklasse hinlegt. Es ist in den letzten 24 Stunden um +19,6% gestiegen und hat direkt die Marke von 1.337 $ durchbrochen!Hier ist meine Aufschlüsselung, warum es gerade so hart nach oben pumpt: 👇1️⃣ Das NU7- Network-Upgrade: Die Community hat eine große Governance-Abstimmung überwältigend unterstützt, um die Blockzeiten von 75 Sekunden auf 25 Sekunden zu senken. Das wird die Transaktionsgeschwindigkeiten exponentiell erhöhen, während sein strikter, Bitcoin-ähnlicher Halving-Zeitplan intakt bleibt.2️⃣ Unterstützung für Ledger-Hardware: Zcash Labs hat offiziell angekündigt, die hochsichere geschützte Pool-Integration nativerweise in Ledger-Wallets zu ermöglichen. Das ist riesig, um sowohl das Retail- als auch das institutionelle Interesse voranzutreiben.3️⃣ Extreme Knappheit: Über 80% des gesamten Angebots von 21 Millionen sind bereits im Umlauf. Die sofortige Marktliquidität trocknet schnell aus, da mehr Tokens in private Pools wandern.📈 Die Handelsvolumina sind deutlich in die Höhe geschnellt, während Käufer sich drängen. Mein nächstes wichtiges Kursziel liegt auf dem Radar bei rund 1.359 $—wenn es diesen Kanal durchbricht, könnten wir auf eine offene Startbahn in Richtung großer psychologischer Marken blicken.Wollt ihr mit dieser Privacy-Coin-Rallye fahren, oder wartet ihr auf einen Rücksetzer, um zu kaufen? Lasst mich eure Ziele unten wissen! 🕵️♂️👇
{future}(ZECUSDT)
#ZEC.24小时交易策略
#ZECUSDT #zcash
.🚀 $ZEC trotzt heute komplett der Marktschwerkraft! Massiver Ausbruch! 🔥Während der Rest des Marktes die Enge spürt, habe ich zugesehen, wie Zcash ($ZEC ) eine absolute Meisterklasse hinlegt. Es ist in den letzten 24 Stunden um +19,6% gestiegen und hat direkt die Marke von 1.337 $ durchbrochen!Hier ist meine Aufschlüsselung, warum es gerade so hart nach oben pumpt: 👇1️⃣ Das NU7- Network-Upgrade: Die Community hat eine große Governance-Abstimmung überwältigend unterstützt, um die Blockzeiten von 75 Sekunden auf 25 Sekunden zu senken. Das wird die Transaktionsgeschwindigkeiten exponentiell erhöhen, während sein strikter, Bitcoin-ähnlicher Halving-Zeitplan intakt bleibt.2️⃣ Unterstützung für Ledger-Hardware: Zcash Labs hat offiziell angekündigt, die hochsichere geschützte Pool-Integration nativerweise in Ledger-Wallets zu ermöglichen. Das ist riesig, um sowohl das Retail- als auch das institutionelle Interesse voranzutreiben.3️⃣ Extreme Knappheit: Über 80% des gesamten Angebots von 21 Millionen sind bereits im Umlauf. Die sofortige Marktliquidität trocknet schnell aus, da mehr Tokens in private Pools wandern.📈 Die Handelsvolumina sind deutlich in die Höhe geschnellt, während Käufer sich drängen. Mein nächstes wichtiges Kursziel liegt auf dem Radar bei rund 1.359 $—wenn es diesen Kanal durchbricht, könnten wir auf eine offene Startbahn in Richtung großer psychologischer Marken blicken.Wollt ihr mit dieser Privacy-Coin-Rallye fahren, oder wartet ihr auf einen Rücksetzer, um zu kaufen? Lasst mich eure Ziele unten wissen! 🕵️♂️👇
#ZEC.24小时交易策略
#ZECUSDT #zcash
#ZEC.24小时交易策略
#ZECUSDT #zcash
248

Übersetzung ansehen
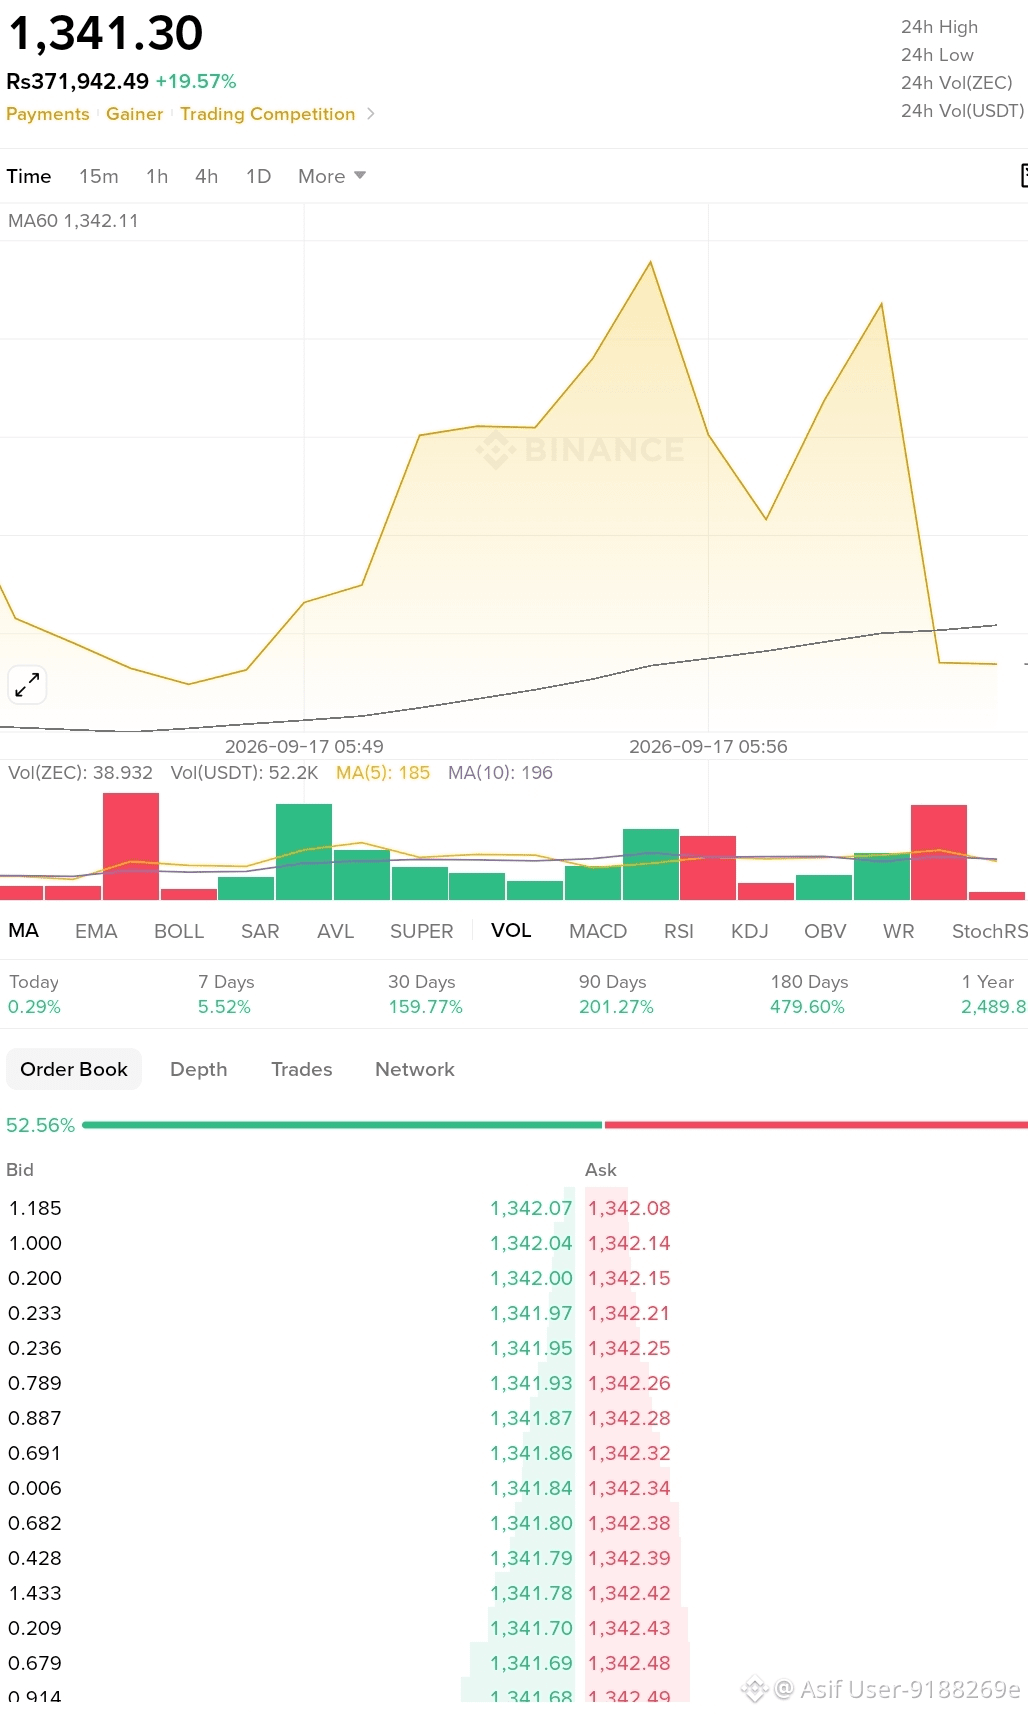
$ZEC ZEC BREAKOUT MODE?
$ZEC is showing strong momentum, trading around $1,320 after pushing to a fresh high near $1,394.
📈 Bullish: Holding above $1,300 could keep the breakout structure alive, with $1,400 as the key psychological resistance.
⚠️ Bearish: Losing $1,300 could trigger profit-taking toward $1,250–$1,200.
Volume and momentum remain elevated, but after such a sharp move, volatility can be extreme.
Are you buying the breakout or waiting for a pullback? 👀
#ZEC #Zcash #Crypto #Altcoins #ZECUSDT
$ZEC ZEC BREAKOUT MODE?
$ZEC is showing strong momentum, trading around $1,320 after pushing to a fresh high near $1,394.
📈 Bullish: Holding above $1,300 could keep the breakout structure alive, with $1,400 as the key psychological resistance.
⚠️ Bearish: Losing $1,300 could trigger profit-taking toward $1,250–$1,200.
Volume and momentum remain elevated, but after such a sharp move, volatility can be extreme.
Are you buying the breakout or waiting for a pullback? 👀
#ZEC #Zcash #Crypto #Altcoins #ZECUSDT
$ZEC is showing strong momentum, trading around $1,320 after pushing to a fresh high near $1,394.
📈 Bullish: Holding above $1,300 could keep the breakout structure alive, with $1,400 as the key psychological resistance.
⚠️ Bearish: Losing $1,300 could trigger profit-taking toward $1,250–$1,200.
Volume and momentum remain elevated, but after such a sharp move, volatility can be extreme.
Are you buying the breakout or waiting for a pullback? 👀
#ZEC #Zcash #Crypto #Altcoins #ZECUSDT
86

Übersetzung ansehen
$ZEC is flashing serious bullish momentum: up 130% in 30 days, breaking $1,300 as whales accumulate $13.65M and holders back the NU7 upgrade for 25-second blocks.
With a bullish Elliott wave pattern 🎯targeting $1,500, ZEC is outpacing Bitcoin while the broader market bleeds.
{spot}(ZECUSDT)
#FedRateWatch #ZECUSDT
#zec
$ZEC is flashing serious bullish momentum: up 130% in 30 days, breaking $1,300 as whales accumulate $13.65M and holders back the NU7 upgrade for 25-second blocks.
With a bullish Elliott wave pattern 🎯targeting $1,500, ZEC is outpacing Bitcoin while the broader market bleeds.
#FedRateWatch #ZECUSDT
#zec
With a bullish Elliott wave pattern 🎯targeting $1,500, ZEC is outpacing Bitcoin while the broader market bleeds.
#FedRateWatch #ZECUSDT
#zec
403
Anmelden und weiter Inhalte entdecken
Krypto-Nutzer weltweit auf Binance Square kennenlernen
⚡️ Bleib in Sachen Krypto stets am Puls.
💬 Die weltgrößte Kryptobörse vertraut darauf.
👍 Erhalte verlässliche Einblicke von verifizierten Creators.
E-Mail-Adresse/Telefonnummer
Trendthemen
1
#MemeLaunchpads82%OfArcDayOneVolume
2,111 Aufrufe
98 Kommentare
2
#OstiumLoanDisputeHearingSetInNYFederalCourt
3,439 Aufrufe
109 Kommentare
3
#SKPoliceRefer18PolymarketUsersToProsecutors
4,268 Aufrufe
170 Kommentare
4
#FedSEPProjects2026RateAt4.1%
10,779 Aufrufe
256 Kommentare
5
#USHouseAdvancesBitcoinReserveBill
6,159 Aufrufe
192 Kommentare
6
#AmazonGetsWarrantsToBuyGeneracStock
6,886 Aufrufe
200 Kommentare
7
#DotPlotSignalsOneMoreHikeIn2026
28,727 Aufrufe
569 Kommentare
8
#RobinhoodToSupportCircleArcNetwork
10,184 Aufrufe
204 Kommentare
9
#FedHikes25BpsUSStocksClose
41,591 Aufrufe
482 Kommentare
10
#AaveToLaunchRWAMarketOnAvalanche
9,818 Aufrufe
199 Kommentare