

#tutusdc
tutusdc
7,526 Aufrufe
57 Kommentare
Hot
Zuletzt

·
--
Bullisch
$TUT
{future}(TUTUSDT)
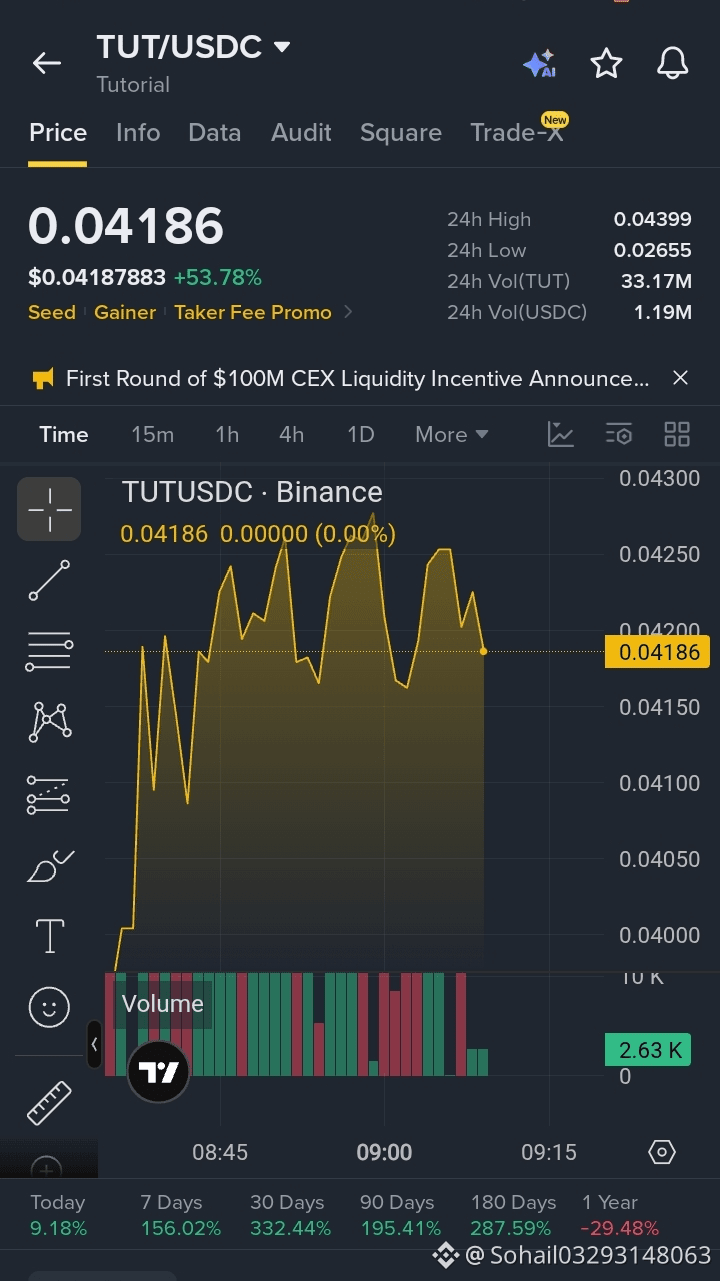
#TUTUSDC Das TUT/USDC-Handelspaar verzeichnet derzeit eine hohe bullische Volatilität und handelt nahe 0,0383 $ USDC, nachdem es in den letzten 24 Stunden einen massiven Anstieg von 49,8 % gegeben hat. Gestützt durch einen jüngsten Wochengewinn von 139 % und hohe Handelsvolumina an großen Börsen wie Binance Spot deutet die kurzfristige Marktstruktur auf starke Dynamik hin.
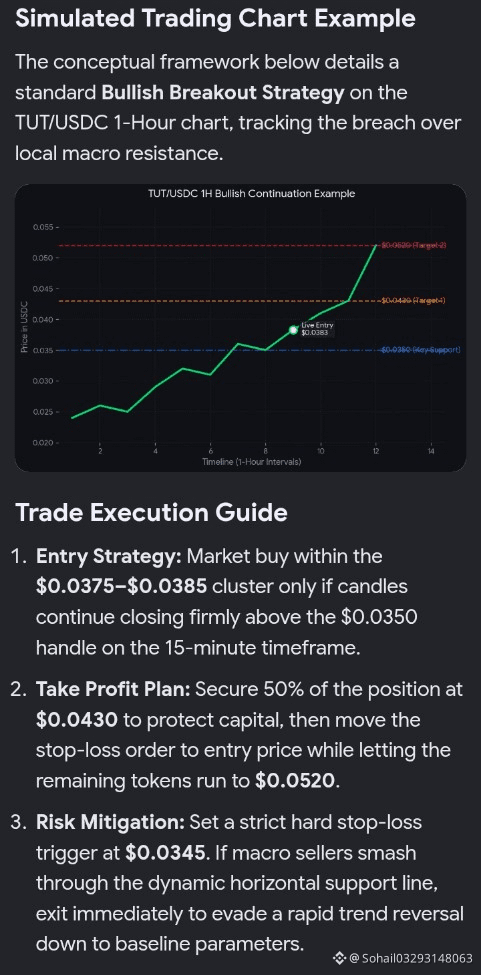
Wichtige Kursziele für heute
Unmittelbarer Support (Stop-Loss-Zone): 0,0350 $ USDC — Wichtige psychologische Marke und wichtige Kursziele für heute
Unmittelbarer Support (Stop-Loss-Zone): 0,0350 $ USDC — Wichtige psychologische Marke und vorherige Konsolidierungszone.
Aktuelle Einstiegsspanne: 0,0375 – 0,0385 $ USDC — Ideal für Momentum-Käufer, die den aktiven Ausbruch beobachten.
Ziel 1 (Intraday-Widerstand): 0,0430 $ USDC — Nahegelegenes lokales Hoch und psychologische Barriere.
Ziel 2 (Großes Ausbruchsziel): 0,0520 $ USDC — Abgeleitet aus der Standard-Erweiterung des jüngsten technischen Chart-Ausbruchs.
Technische Analyse & Markttreiber
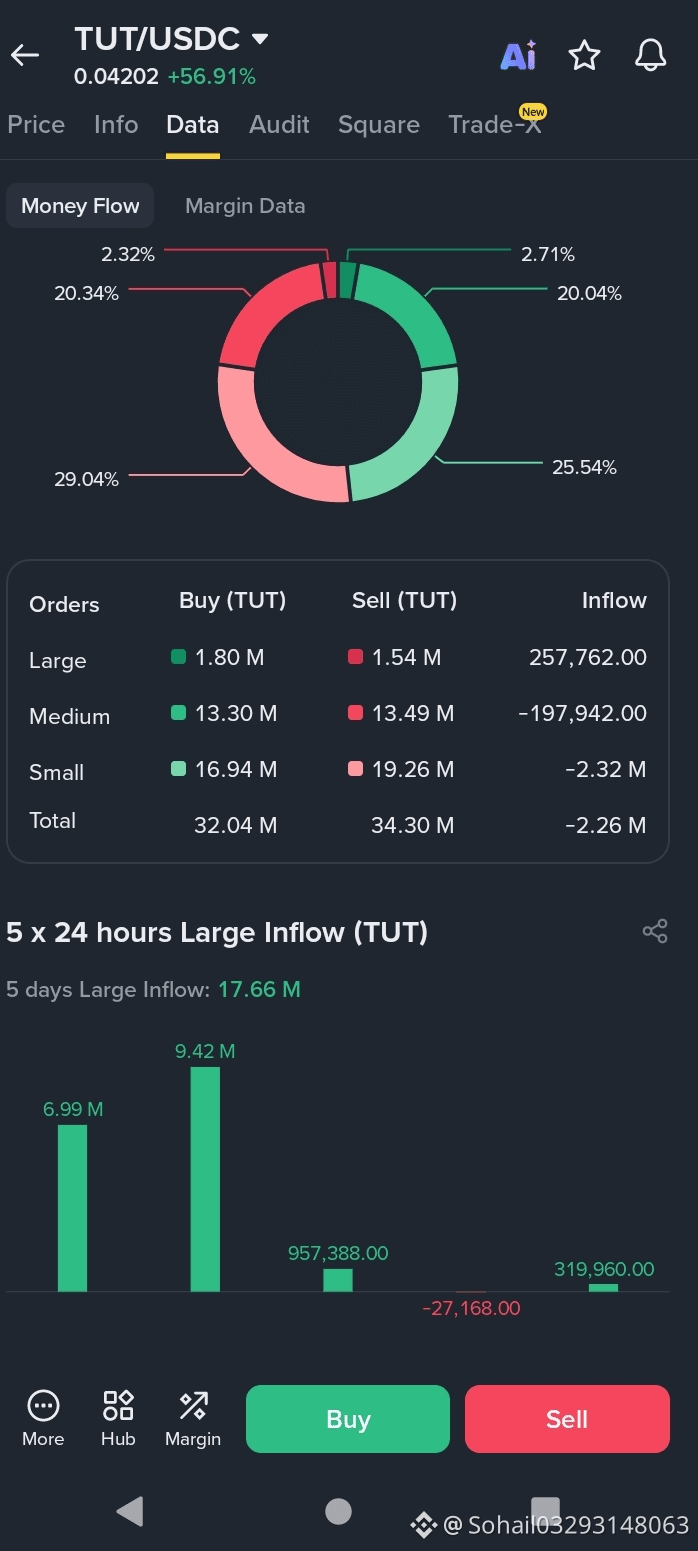
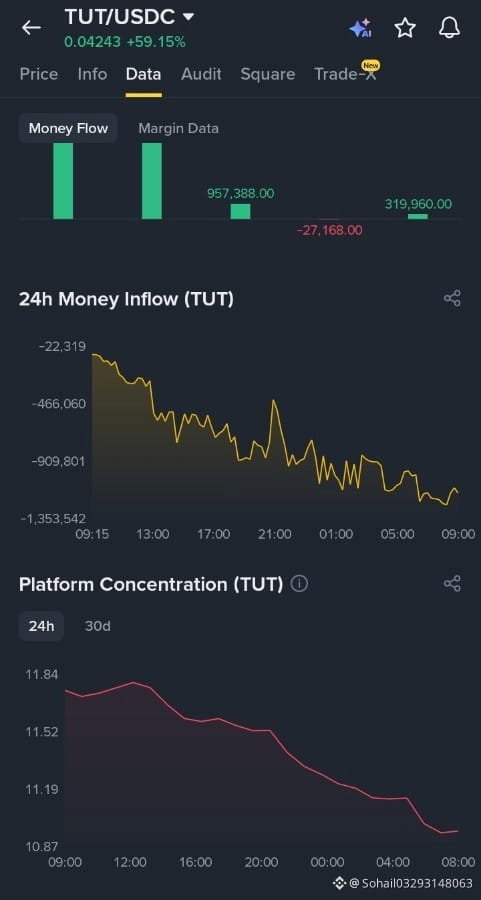
Bestätigung durch Volumen-Spike: Das 24-Stunden-Spot-Volumen von TUT lag über 37 Mio. $–58 Mio. $ und zeigt eine intensive Überzeugung institutioneller und privater Käufer, die diesen Aufwärtsimpuls unterstützt.
Rückenwind aus dem Ökosystem: Der plötzliche Kapitalzufluss rührt von massivem Retail-Interesse an AI-gestützten Blockchain-Bildungstokens her, wodurch sich TUT deutlich stärker vom seitwärts verlaufenden breiteren Krypto-Markt entkoppeln kann.
Risikohinweis: Mit einer relativ geringen Marktkapitalisierung von 31,9 Mio. $ hat TUT einen hohen Volatilitätsindex. Ein plötzlicher Bruch unter die Support-Marke von 0,0350 $ könnte die bullische These schnell neutralisieren und die Kursbewegung veranlassen, erneut die Liquiditätszone bei 0,0270 $ zu testen.
#GoldBreaksOutFromJanuaryDowntrend
#DollarSetForBestDayInTwoWeeks
#TSEPlansReReviewForMajorBusinessChanges
#USSolarStocksRisePremarket
@tutorialtoken
$TUT
#TUTUSDC Das TUT/USDC-Handelspaar verzeichnet derzeit eine hohe bullische Volatilität und handelt nahe 0,0383 $ USDC, nachdem es in den letzten 24 Stunden einen massiven Anstieg von 49,8 % gegeben hat. Gestützt durch einen jüngsten Wochengewinn von 139 % und hohe Handelsvolumina an großen Börsen wie Binance Spot deutet die kurzfristige Marktstruktur auf starke Dynamik hin.
Wichtige Kursziele für heute
Unmittelbarer Support (Stop-Loss-Zone): 0,0350 $ USDC — Wichtige psychologische Marke und wichtige Kursziele für heute
Unmittelbarer Support (Stop-Loss-Zone): 0,0350 $ USDC — Wichtige psychologische Marke und vorherige Konsolidierungszone.
Aktuelle Einstiegsspanne: 0,0375 – 0,0385 $ USDC — Ideal für Momentum-Käufer, die den aktiven Ausbruch beobachten.
Ziel 1 (Intraday-Widerstand): 0,0430 $ USDC — Nahegelegenes lokales Hoch und psychologische Barriere.
Ziel 2 (Großes Ausbruchsziel): 0,0520 $ USDC — Abgeleitet aus der Standard-Erweiterung des jüngsten technischen Chart-Ausbruchs.
Technische Analyse & Markttreiber
Bestätigung durch Volumen-Spike: Das 24-Stunden-Spot-Volumen von TUT lag über 37 Mio. $–58 Mio. $ und zeigt eine intensive Überzeugung institutioneller und privater Käufer, die diesen Aufwärtsimpuls unterstützt.
Rückenwind aus dem Ökosystem: Der plötzliche Kapitalzufluss rührt von massivem Retail-Interesse an AI-gestützten Blockchain-Bildungstokens her, wodurch sich TUT deutlich stärker vom seitwärts verlaufenden breiteren Krypto-Markt entkoppeln kann.
Risikohinweis: Mit einer relativ geringen Marktkapitalisierung von 31,9 Mio. $ hat TUT einen hohen Volatilitätsindex. Ein plötzlicher Bruch unter die Support-Marke von 0,0350 $ könnte die bullische These schnell neutralisieren und die Kursbewegung veranlassen, erneut die Liquiditätszone bei 0,0270 $ zu testen.
#GoldBreaksOutFromJanuaryDowntrend
#DollarSetForBestDayInTwoWeeks
#TSEPlansReReviewForMajorBusinessChanges
#USSolarStocksRisePremarket
@tutorialtoken
#TUTUSDC Das TUT/USDC-Handelspaar verzeichnet derzeit eine hohe bullische Volatilität und handelt nahe 0,0383 $ USDC, nachdem es in den letzten 24 Stunden einen massiven Anstieg von 49,8 % gegeben hat. Gestützt durch einen jüngsten Wochengewinn von 139 % und hohe Handelsvolumina an großen Börsen wie Binance Spot deutet die kurzfristige Marktstruktur auf starke Dynamik hin.
Wichtige Kursziele für heute
Unmittelbarer Support (Stop-Loss-Zone): 0,0350 $ USDC — Wichtige psychologische Marke und wichtige Kursziele für heute
Unmittelbarer Support (Stop-Loss-Zone): 0,0350 $ USDC — Wichtige psychologische Marke und vorherige Konsolidierungszone.
Aktuelle Einstiegsspanne: 0,0375 – 0,0385 $ USDC — Ideal für Momentum-Käufer, die den aktiven Ausbruch beobachten.
Ziel 1 (Intraday-Widerstand): 0,0430 $ USDC — Nahegelegenes lokales Hoch und psychologische Barriere.
Ziel 2 (Großes Ausbruchsziel): 0,0520 $ USDC — Abgeleitet aus der Standard-Erweiterung des jüngsten technischen Chart-Ausbruchs.
Technische Analyse & Markttreiber
Bestätigung durch Volumen-Spike: Das 24-Stunden-Spot-Volumen von TUT lag über 37 Mio. $–58 Mio. $ und zeigt eine intensive Überzeugung institutioneller und privater Käufer, die diesen Aufwärtsimpuls unterstützt.
Rückenwind aus dem Ökosystem: Der plötzliche Kapitalzufluss rührt von massivem Retail-Interesse an AI-gestützten Blockchain-Bildungstokens her, wodurch sich TUT deutlich stärker vom seitwärts verlaufenden breiteren Krypto-Markt entkoppeln kann.
Risikohinweis: Mit einer relativ geringen Marktkapitalisierung von 31,9 Mio. $ hat TUT einen hohen Volatilitätsindex. Ein plötzlicher Bruch unter die Support-Marke von 0,0350 $ könnte die bullische These schnell neutralisieren und die Kursbewegung veranlassen, erneut die Liquiditätszone bei 0,0270 $ zu testen.
#GoldBreaksOutFromJanuaryDowntrend
#DollarSetForBestDayInTwoWeeks
#TSEPlansReReviewForMajorBusinessChanges
#USSolarStocksRisePremarket
@tutorialtoken
1
152
·
--
Bullisch
$TUT
{future}(TUTUSDT)
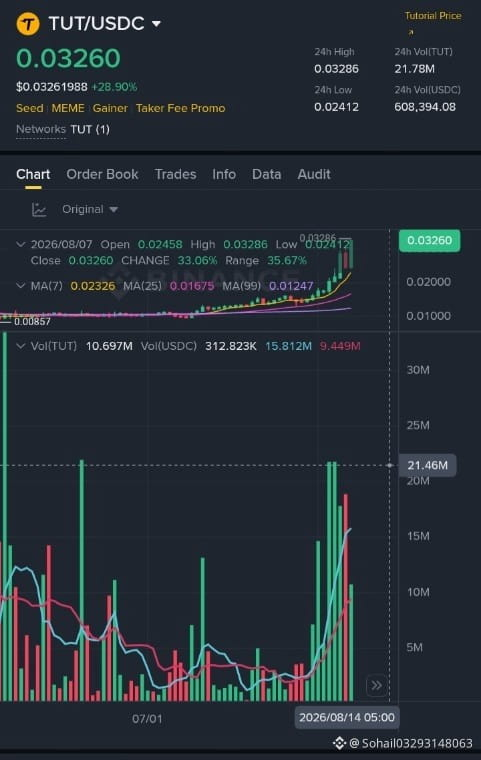
#TUTUSDC wird derzeit bei etwa 0,03260 USDC gehandelt, was einem Anstieg von rund 26,2 % gegenüber den letzten 24 Stunden entspricht. Der heutige Handelsspanne reicht von 0,02412–0,03286 USDC, sodass es bereits nahe am oberen Bereich der Session liegt.
Kurzfazit für heute:
Momentum: starkes kurzfristiges Aufwärtsmomentum, da der Kurs deutlich vom 24h-Start bei 0,02584 auf 0,03260 gestiegen ist.
Kurzfristiger Widerstandsbereich: etwa 0,03286 – das ist das heutige Hoch. Wenn der Kurs diesen Bereich weiter testet und sich dort hält, könnte das Momentum stark bleiben; wenn er dort scheitert, steigt das Risiko für einen kurzfristigen Rücksetzer.
Kurzfristiger Unterstützungsbereich: etwa 0,030–0,031 als nahe Reaktionszone, wobei es eine tiefere Unterstützung näher bei 0,02584 und anschließend bei 0,02412 gibt.
Risikohinweis: Da TUT wie ein kleinerer Token mit höherer Volatilität aussieht, können die Schwankungen intraday stark ausfallen. Ein starker Anstieg kann sich fortsetzen, kann sich aber auch schnell umkehren, wenn das Handelsvolumen nachlässt.
Zu den Trade-Zielen kann ich dir keinen pauschalen „erfolgreichen Zielwert“ geben und auch nicht exakt sagen, wo du heute kaufen/verkaufen solltest. Besser ist es, es so zu rahmen:
Wenn du kurzfristig tradest, beobachte, ob der Kurs oberhalb des jüngsten Ausbruchbereichs gehalten werden kann und ob er das heutige Hoch mit Stärke erneut testen kann.
Wenn du bereits im Plus bist, solltest du möglicherweise deine eigene Exit-Strategie festlegen – basierend auf deiner Risikotoleranz, deinem Zeithorizont und dem maximal akzeptierten Drawdown.
Wenn du einen Einstieg erwägst, ist es sicherer, entweder auf eine Bestätigung der Stärke oder auf einen kontrollierten Pullback zu warten, anstatt einem schnellen Move blind hinterherzulaufen.
Hier ist die Live-Spot-Chart-Karte für TUT/USDC:
#DowFalls464Points
#SenateTalksDelayCLARITYActVote
#USSenateNoClarityActVoteBeforeAugustBreak
#GoldBreaksOutFromJanuaryDowntrend
$TUT
#TUTUSDC wird derzeit bei etwa 0,03260 USDC gehandelt, was einem Anstieg von rund 26,2 % gegenüber den letzten 24 Stunden entspricht. Der heutige Handelsspanne reicht von 0,02412–0,03286 USDC, sodass es bereits nahe am oberen Bereich der Session liegt.
Kurzfazit für heute:
Momentum: starkes kurzfristiges Aufwärtsmomentum, da der Kurs deutlich vom 24h-Start bei 0,02584 auf 0,03260 gestiegen ist.
Kurzfristiger Widerstandsbereich: etwa 0,03286 – das ist das heutige Hoch. Wenn der Kurs diesen Bereich weiter testet und sich dort hält, könnte das Momentum stark bleiben; wenn er dort scheitert, steigt das Risiko für einen kurzfristigen Rücksetzer.
Kurzfristiger Unterstützungsbereich: etwa 0,030–0,031 als nahe Reaktionszone, wobei es eine tiefere Unterstützung näher bei 0,02584 und anschließend bei 0,02412 gibt.
Risikohinweis: Da TUT wie ein kleinerer Token mit höherer Volatilität aussieht, können die Schwankungen intraday stark ausfallen. Ein starker Anstieg kann sich fortsetzen, kann sich aber auch schnell umkehren, wenn das Handelsvolumen nachlässt.
Zu den Trade-Zielen kann ich dir keinen pauschalen „erfolgreichen Zielwert“ geben und auch nicht exakt sagen, wo du heute kaufen/verkaufen solltest. Besser ist es, es so zu rahmen:
Wenn du kurzfristig tradest, beobachte, ob der Kurs oberhalb des jüngsten Ausbruchbereichs gehalten werden kann und ob er das heutige Hoch mit Stärke erneut testen kann.
Wenn du bereits im Plus bist, solltest du möglicherweise deine eigene Exit-Strategie festlegen – basierend auf deiner Risikotoleranz, deinem Zeithorizont und dem maximal akzeptierten Drawdown.
Wenn du einen Einstieg erwägst, ist es sicherer, entweder auf eine Bestätigung der Stärke oder auf einen kontrollierten Pullback zu warten, anstatt einem schnellen Move blind hinterherzulaufen.
Hier ist die Live-Spot-Chart-Karte für TUT/USDC:
#DowFalls464Points
#SenateTalksDelayCLARITYActVote
#USSenateNoClarityActVoteBeforeAugustBreak
#GoldBreaksOutFromJanuaryDowntrend
#TUTUSDC wird derzeit bei etwa 0,03260 USDC gehandelt, was einem Anstieg von rund 26,2 % gegenüber den letzten 24 Stunden entspricht. Der heutige Handelsspanne reicht von 0,02412–0,03286 USDC, sodass es bereits nahe am oberen Bereich der Session liegt.
Kurzfazit für heute:
Momentum: starkes kurzfristiges Aufwärtsmomentum, da der Kurs deutlich vom 24h-Start bei 0,02584 auf 0,03260 gestiegen ist.
Kurzfristiger Widerstandsbereich: etwa 0,03286 – das ist das heutige Hoch. Wenn der Kurs diesen Bereich weiter testet und sich dort hält, könnte das Momentum stark bleiben; wenn er dort scheitert, steigt das Risiko für einen kurzfristigen Rücksetzer.
Kurzfristiger Unterstützungsbereich: etwa 0,030–0,031 als nahe Reaktionszone, wobei es eine tiefere Unterstützung näher bei 0,02584 und anschließend bei 0,02412 gibt.
Risikohinweis: Da TUT wie ein kleinerer Token mit höherer Volatilität aussieht, können die Schwankungen intraday stark ausfallen. Ein starker Anstieg kann sich fortsetzen, kann sich aber auch schnell umkehren, wenn das Handelsvolumen nachlässt.
Zu den Trade-Zielen kann ich dir keinen pauschalen „erfolgreichen Zielwert“ geben und auch nicht exakt sagen, wo du heute kaufen/verkaufen solltest. Besser ist es, es so zu rahmen:
Wenn du kurzfristig tradest, beobachte, ob der Kurs oberhalb des jüngsten Ausbruchbereichs gehalten werden kann und ob er das heutige Hoch mit Stärke erneut testen kann.
Wenn du bereits im Plus bist, solltest du möglicherweise deine eigene Exit-Strategie festlegen – basierend auf deiner Risikotoleranz, deinem Zeithorizont und dem maximal akzeptierten Drawdown.
Wenn du einen Einstieg erwägst, ist es sicherer, entweder auf eine Bestätigung der Stärke oder auf einen kontrollierten Pullback zu warten, anstatt einem schnellen Move blind hinterherzulaufen.
Hier ist die Live-Spot-Chart-Karte für TUT/USDC:
#DowFalls464Points
#SenateTalksDelayCLARITYActVote
#USSenateNoClarityActVoteBeforeAugustBreak
#GoldBreaksOutFromJanuaryDowntrend
1
88



·
--
Bärisch

NIGHTEYE
·
--
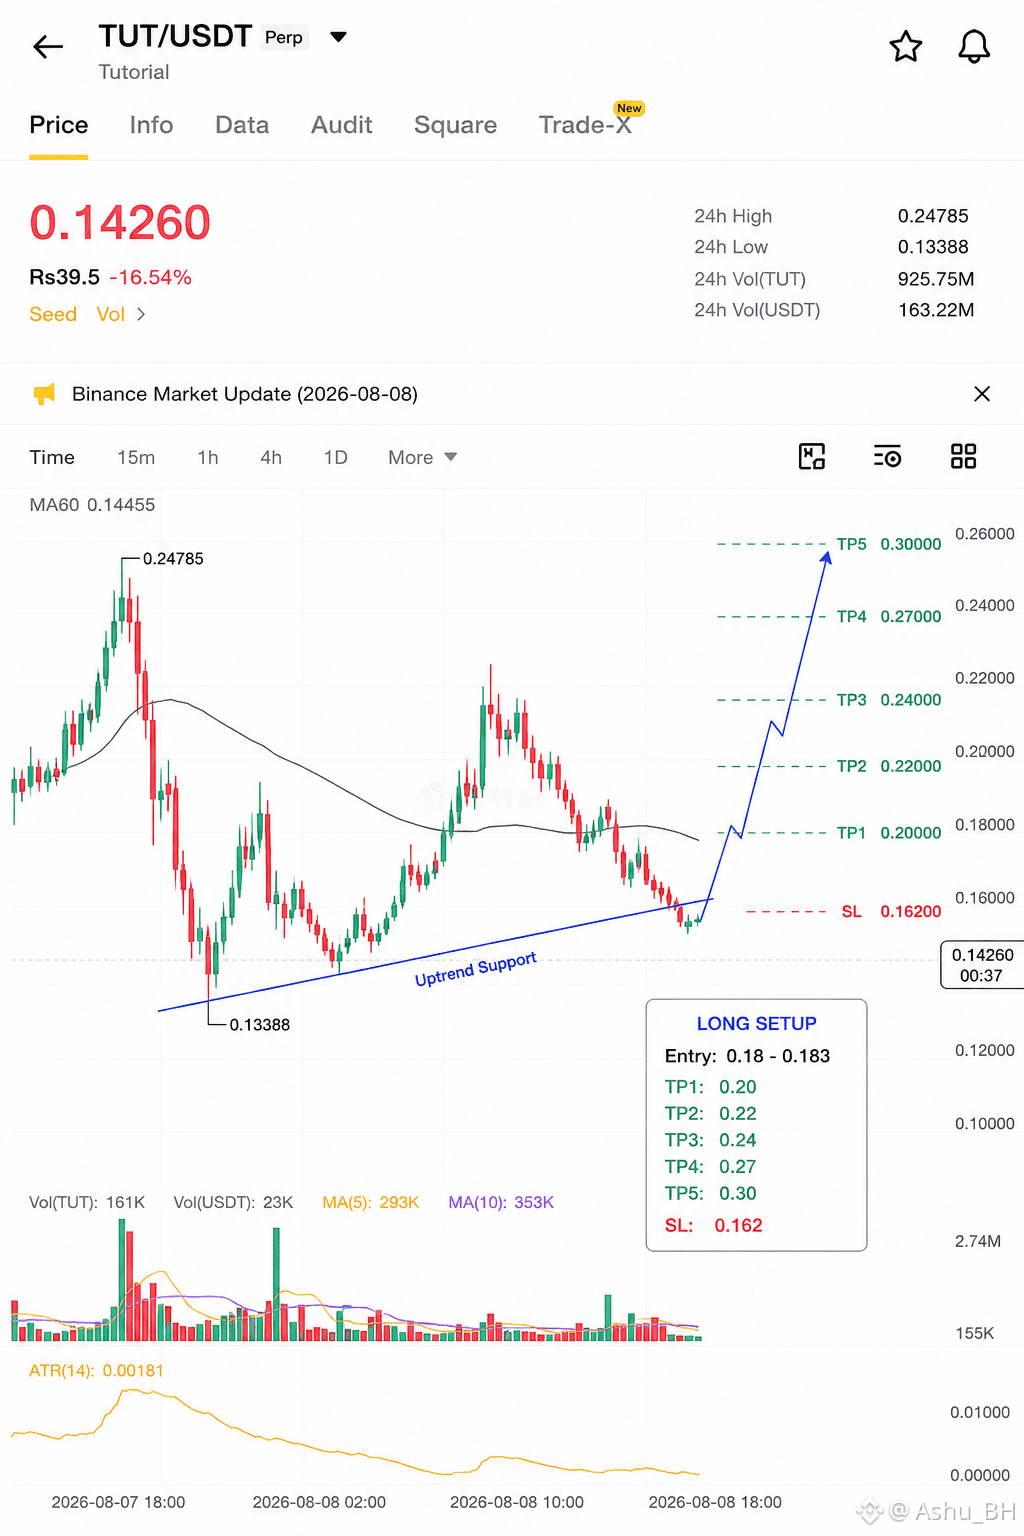
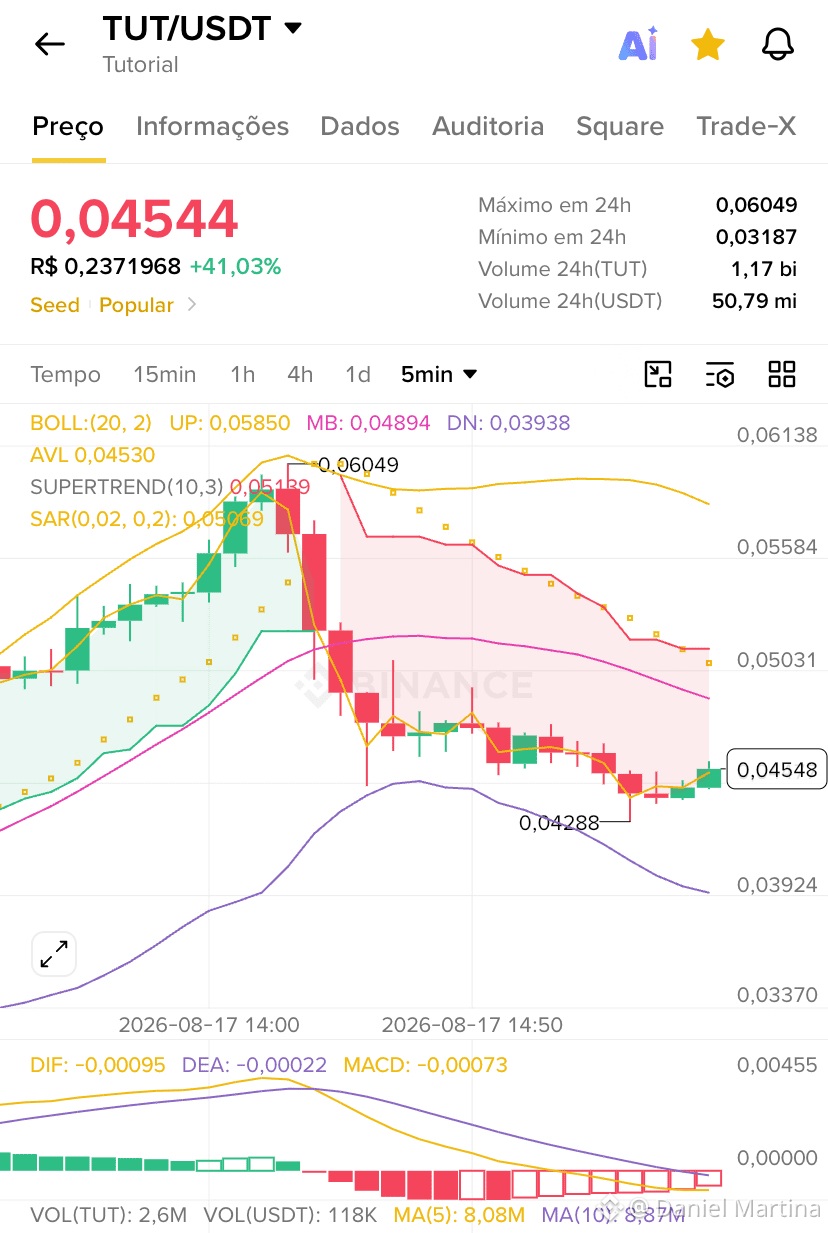
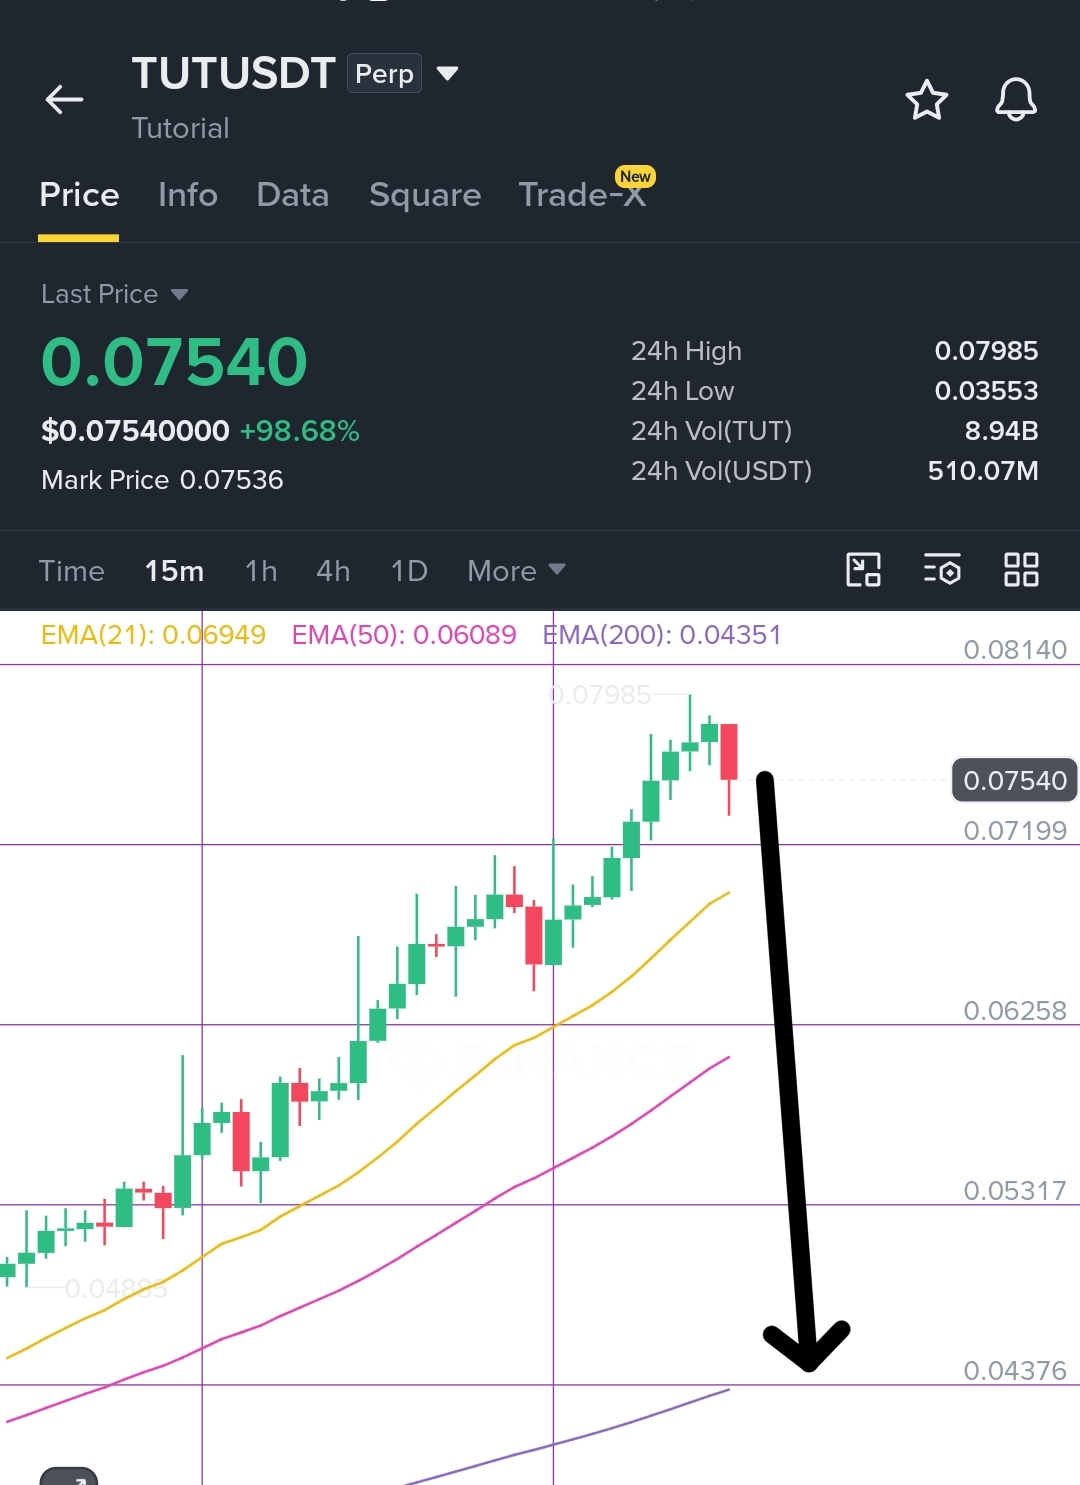
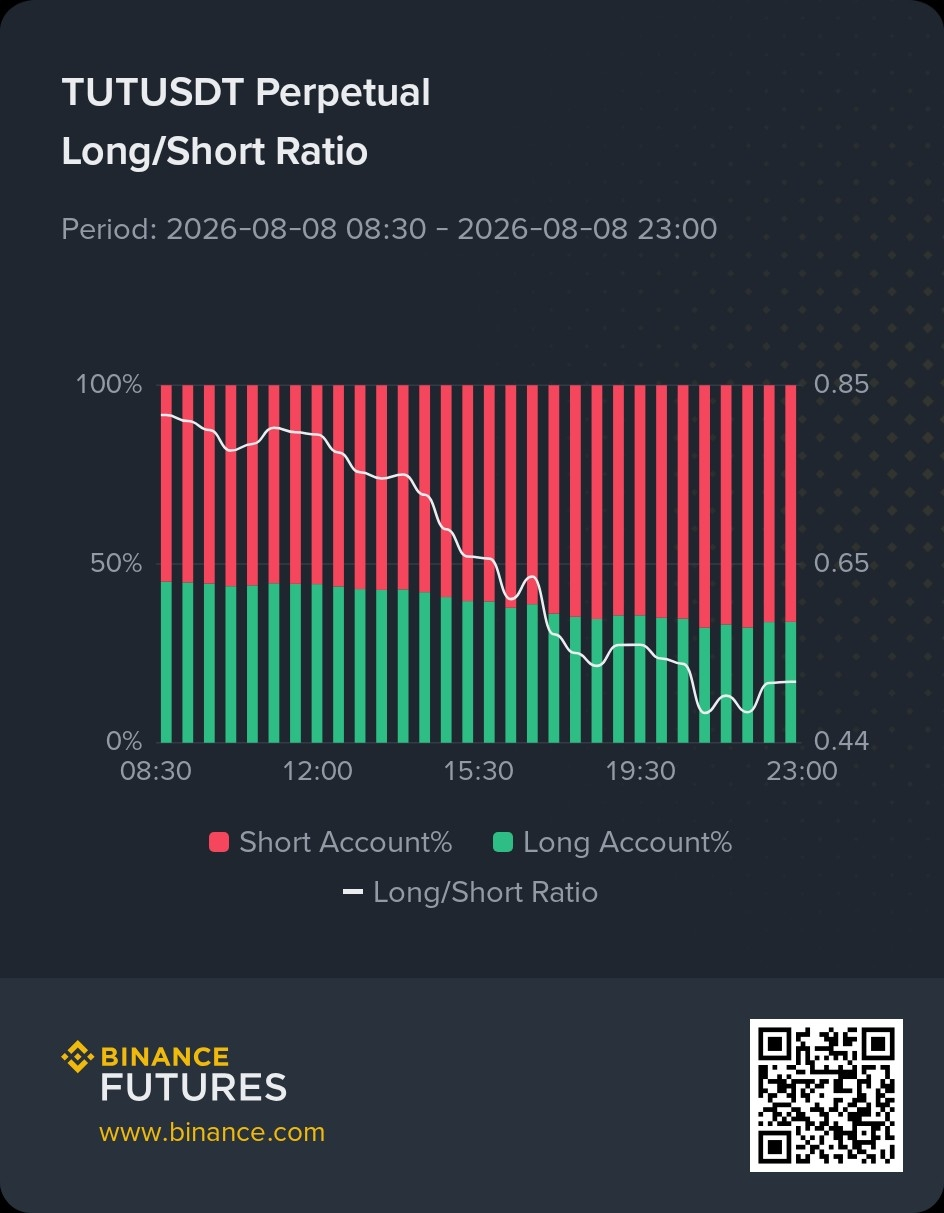
Bärisch$TUT Wale haben das schon oft genug manipuliert. Jedes Mal, wenn jemand versucht, diesen Token zu shorten, haben sie alle zerlegt. Aber jetzt denke ich, dass die Zeit für einen großen Rückgang gekommen ist, und der sollte jederzeit beginnen.
1
28
·
--
Bärisch

Mr_Trader524
·
--
Bärisch📊 $TUT USDT — Detaillierte Kurz-Analyse
Grund für das Setup:
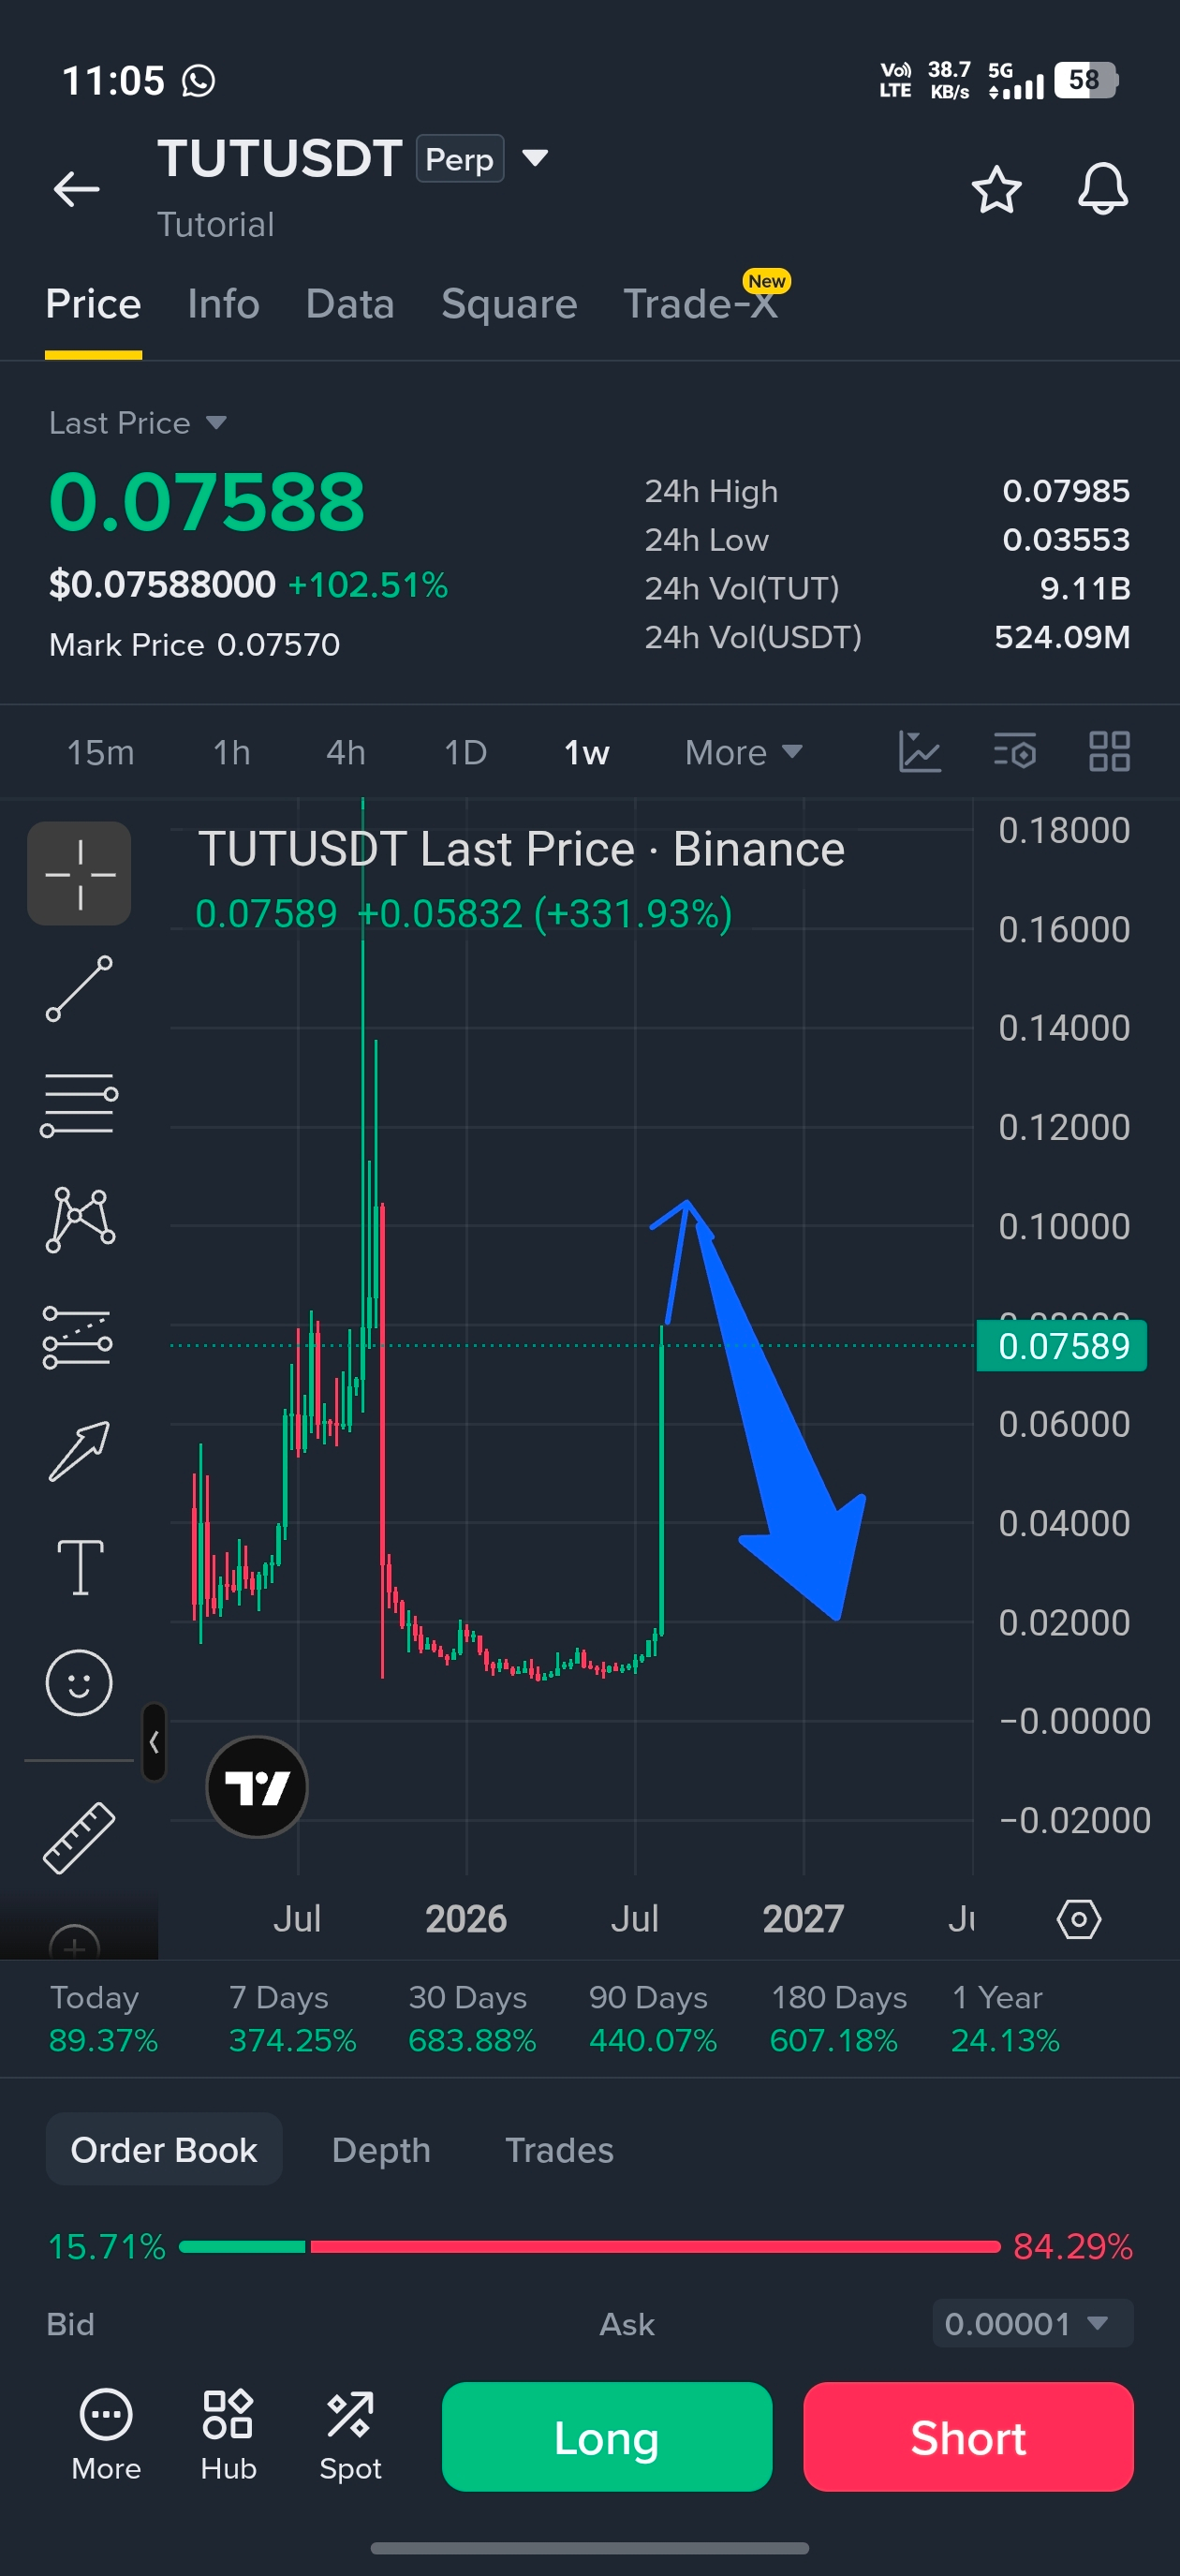
$TUT hat bereits eine extrem aggressive parabolische Rally hinter sich, bei der es in sehr kurzer Zeit von dem unteren Bereich um 0.01–0.02 auf die aktuelle 0.075+-Zone gestiegen ist. Eine solche vertikale Ausweitung deutet in der Regel darauf hin, dass der Preis sich weit von seiner vorherigen Gleichgewichtszone entfernt hat.
Die wichtigste Zone, auf die es zu achten gilt, ist 0.10–0.105, die nach diesem massiven Pump als großer psychologischer Widerstand fungiert. Wenn Käufer die Dynamik um diese Zone nicht aufrechterhalten können, könnten frühe Investoren und Momentum-Trader anfangen, Gewinne mitzunehmen, was starken Verkaufsdruck erzeugt.
Ein weiterer wichtiger Faktor ist der enorme Anstieg der Handelsaktivität, der den Pump begleitet. Wenn das Volumen nach einem bereits stark ausgedehnten Move dramatisch expandiert, kann dies häufig von Volatilität, Distribution und einem scharfen Retracement gefolgt werden, falls die frische Kaufnachfrage zu schwächeln beginnt.
Aus der dargestellten Wochenstruktur ist außerdem eine große Lücke zwischen dem aktuellen Preis und der vorherigen Konsolidierungszone ersichtlich. Eine Korrektur in Richtung dieser tieferen Unterstützungszonen wäre daher nicht ungewöhnlich.
🔥 Gesamtbias: Bearish bei Ablehnung
📍 Wichtigster Widerstand: 0.10–0.105
📉 Kerngedanke: Parabolischer Pump → Widerstandstest → Gewinnmitnahmen → mögliche Liquiditätskorrektur
Hier handeln 👇
Grund für das Setup:
$TUT hat bereits eine extrem aggressive parabolische Rally hinter sich, bei der es in sehr kurzer Zeit von dem unteren Bereich um 0.01–0.02 auf die aktuelle 0.075+-Zone gestiegen ist. Eine solche vertikale Ausweitung deutet in der Regel darauf hin, dass der Preis sich weit von seiner vorherigen Gleichgewichtszone entfernt hat.
Die wichtigste Zone, auf die es zu achten gilt, ist 0.10–0.105, die nach diesem massiven Pump als großer psychologischer Widerstand fungiert. Wenn Käufer die Dynamik um diese Zone nicht aufrechterhalten können, könnten frühe Investoren und Momentum-Trader anfangen, Gewinne mitzunehmen, was starken Verkaufsdruck erzeugt.
Ein weiterer wichtiger Faktor ist der enorme Anstieg der Handelsaktivität, der den Pump begleitet. Wenn das Volumen nach einem bereits stark ausgedehnten Move dramatisch expandiert, kann dies häufig von Volatilität, Distribution und einem scharfen Retracement gefolgt werden, falls die frische Kaufnachfrage zu schwächeln beginnt.
Aus der dargestellten Wochenstruktur ist außerdem eine große Lücke zwischen dem aktuellen Preis und der vorherigen Konsolidierungszone ersichtlich. Eine Korrektur in Richtung dieser tieferen Unterstützungszonen wäre daher nicht ungewöhnlich.
🔥 Gesamtbias: Bearish bei Ablehnung
📍 Wichtigster Widerstand: 0.10–0.105
📉 Kerngedanke: Parabolischer Pump → Widerstandstest → Gewinnmitnahmen → mögliche Liquiditätskorrektur
Hier handeln 👇
1
123


·
--
Bärisch

sasivasu
·
--
Bärisch$TUT keine Möglichkeit, es erneut zu beanspruchen. Es wird langsam nach unten gehen. Gewinne mitnehmen, Leute
214
·
--
Bärisch

AL Sadman Nibid
·
--
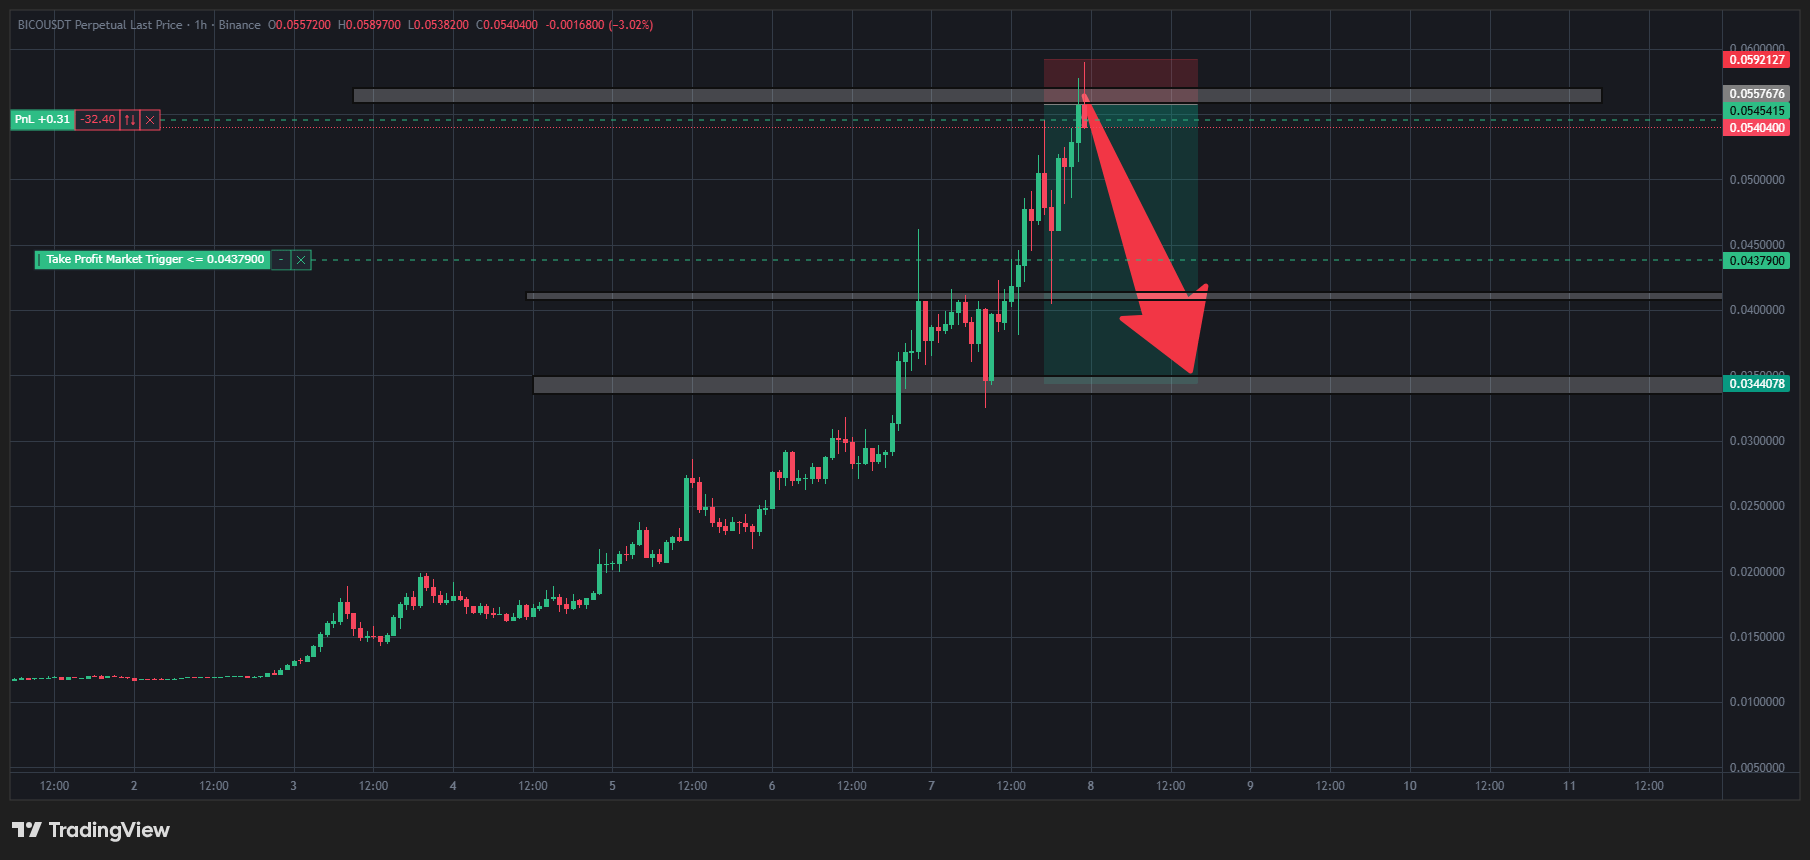
$TUT kurz davor, dass es gleich crasht 💵
zukünftiges Signal 💰
Einstieg: 0.075- 0.078
TP 1 : 0.055
TP 2 : 0.045
TP 3 : 0.035
warten auf die Ablehnung und ein profitabler Trader sein
#futuresignal #downtrend #tut #BREAKING #makemoney
zukünftiges Signal 💰
Einstieg: 0.075- 0.078
TP 1 : 0.055
TP 2 : 0.045
TP 3 : 0.035
warten auf die Ablehnung und ein profitabler Trader sein
#futuresignal #downtrend #tut #BREAKING #makemoney
1
214

·
--
Bullisch
🔥 $TUT /USDC SIGNAL — LONG 🟢
📈 LONG / KAUF
Einstieg: 0.02670 – 0.02700
🎯 TP1: 0.02755
🎯 TP2: 0.02870
🎯 TP3: 0.02995
🛑 Stop Loss: 0.02550
Analyse:
TUT hält sich über dem MA(99) im 1H-Chart, nachdem es von dem Hoch bei 0.02995 zurückgekommen ist. Der Kurs versucht, sich im Bereich 0.0267–0.0270 zu stabilisieren, der als kurzfristiger Unterstützungsbereich dienen kann.
Eine Rückeroberung von 0.02755 könnte das bullische Setup stärken und den Weg Richtung 0.02870 öffnen, während ein Ausbruch über 0.02995 auf weiteres Upside hindeuten kann.
⚠️ Risikomanagement: Der Chart ist weiterhin volatil und die kurzfristige Dynamik ist gemischt. Gehe mit korrekter Positionsgröße vor und halte den Stop-Loss ein.
#TUT #TUTUSDC #cryptosignals #longsignal #Binance
🔥 $TUT /USDC SIGNAL — LONG 🟢
📈 LONG / KAUF
Einstieg: 0.02670 – 0.02700
🎯 TP1: 0.02755
🎯 TP2: 0.02870
🎯 TP3: 0.02995
🛑 Stop Loss: 0.02550
Analyse:
TUT hält sich über dem MA(99) im 1H-Chart, nachdem es von dem Hoch bei 0.02995 zurückgekommen ist. Der Kurs versucht, sich im Bereich 0.0267–0.0270 zu stabilisieren, der als kurzfristiger Unterstützungsbereich dienen kann.
Eine Rückeroberung von 0.02755 könnte das bullische Setup stärken und den Weg Richtung 0.02870 öffnen, während ein Ausbruch über 0.02995 auf weiteres Upside hindeuten kann.
⚠️ Risikomanagement: Der Chart ist weiterhin volatil und die kurzfristige Dynamik ist gemischt. Gehe mit korrekter Positionsgröße vor und halte den Stop-Loss ein.
#TUT #TUTUSDC #cryptosignals #longsignal #Binance
📈 LONG / KAUF
Einstieg: 0.02670 – 0.02700
🎯 TP1: 0.02755
🎯 TP2: 0.02870
🎯 TP3: 0.02995
🛑 Stop Loss: 0.02550
Analyse:
TUT hält sich über dem MA(99) im 1H-Chart, nachdem es von dem Hoch bei 0.02995 zurückgekommen ist. Der Kurs versucht, sich im Bereich 0.0267–0.0270 zu stabilisieren, der als kurzfristiger Unterstützungsbereich dienen kann.
Eine Rückeroberung von 0.02755 könnte das bullische Setup stärken und den Weg Richtung 0.02870 öffnen, während ein Ausbruch über 0.02995 auf weiteres Upside hindeuten kann.
⚠️ Risikomanagement: Der Chart ist weiterhin volatil und die kurzfristige Dynamik ist gemischt. Gehe mit korrekter Positionsgröße vor und halte den Stop-Loss ein.
#TUT #TUTUSDC #cryptosignals #longsignal #Binance
2
145




·
--
Bullisch
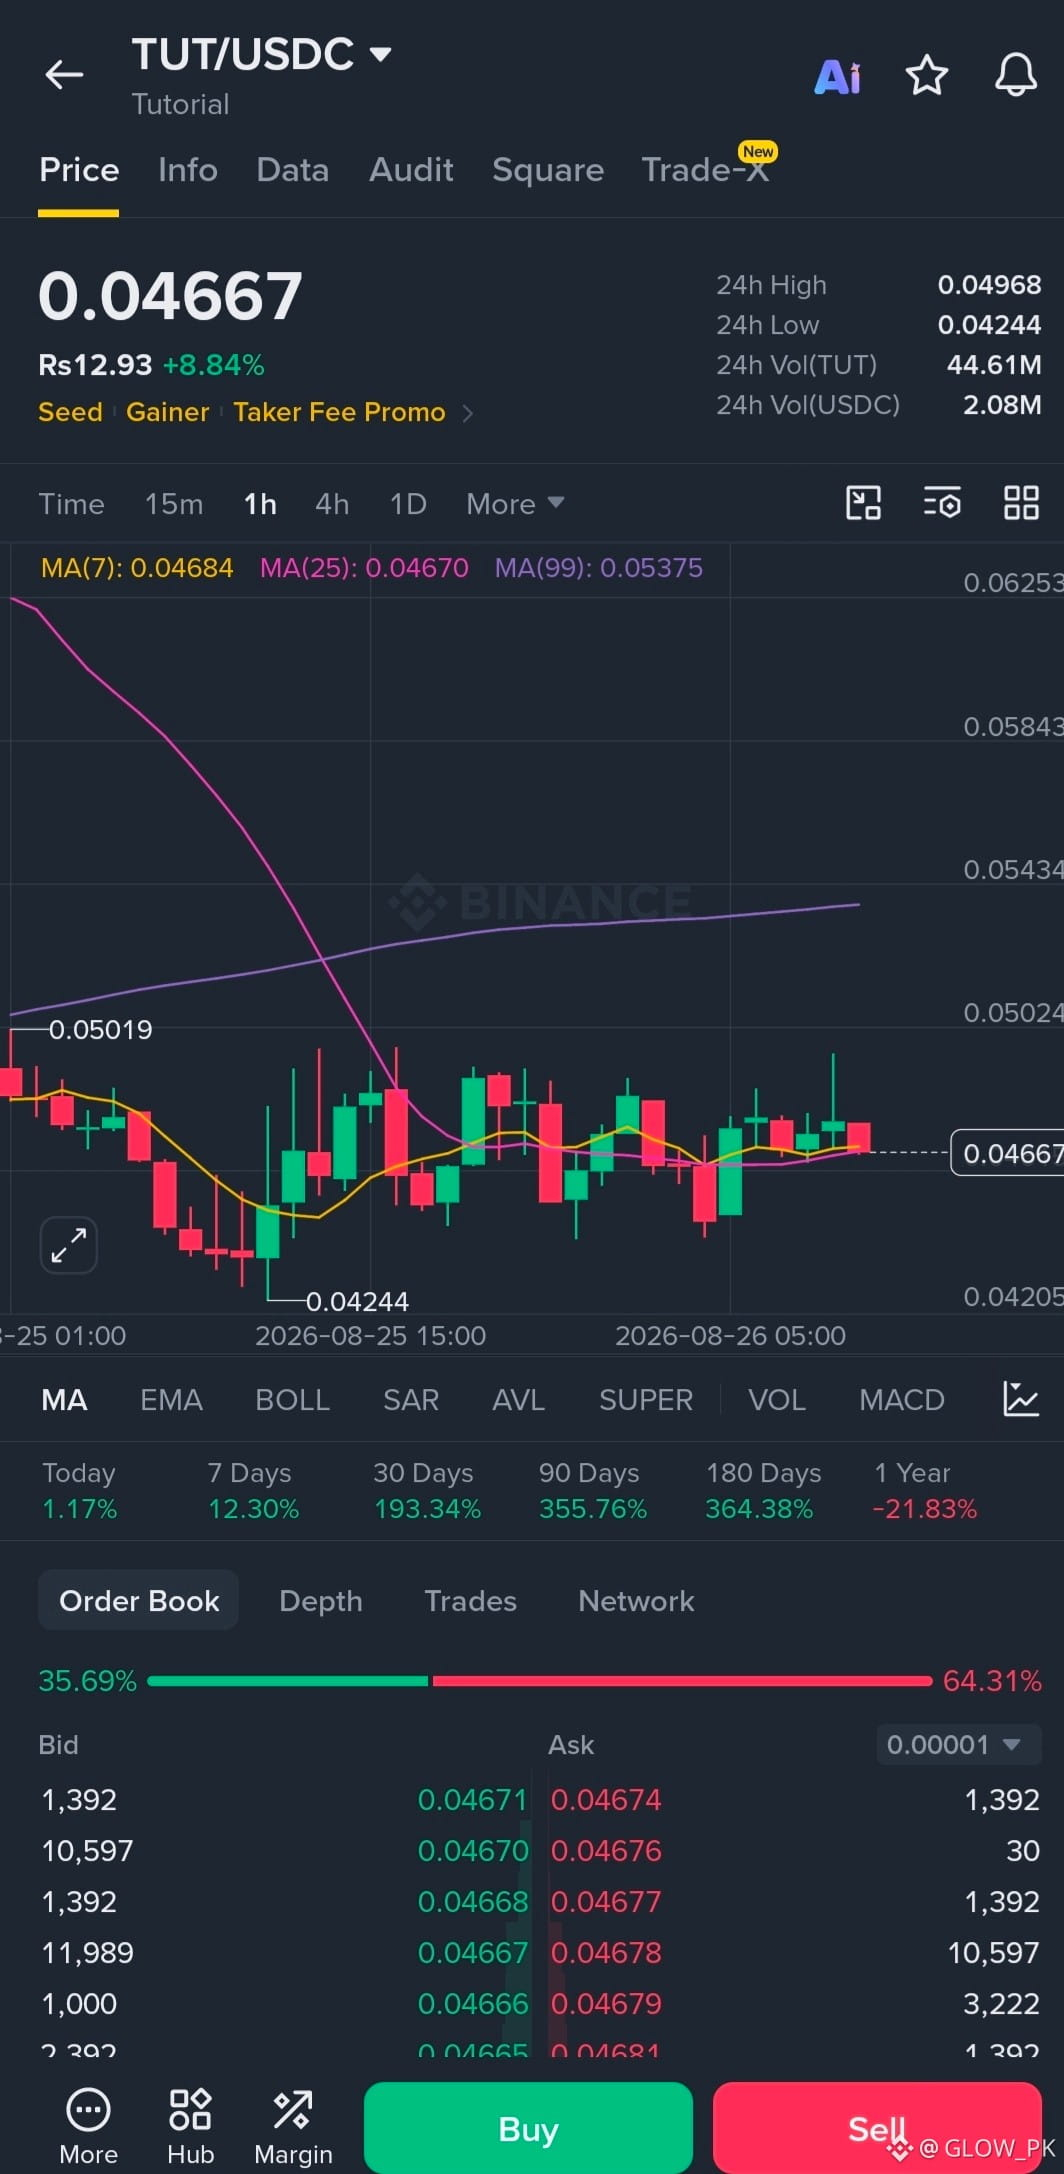
🚀 $TUT /USDC — FUTURES LONG
📍 Einstieg: 0.04620 – 0.04670
🛑 Stop Loss: 0.04480
🎯 TP1: 0.04800
🎯 TP2: 0.04970
🎯 TP3: 0.05200
📊 Der 1H-Chart konsolidiert um MA7 und MA25, nachdem die Unterstützung bei 0.04244 gehalten wurde. Ein Ausbruch über 0.04970 könnte stärkeren bullischen Schwung bestätigen.
⚠️ MA99 liegt immer noch über dem Preis, daher ist eine Bestätigung wichtig. Verfolge die Bewegung nicht; kontrolliere das Risiko sorgfältig.
{future}(TUTUSDT)
#TUT #TUTUSDC #crypto #Binance #futures
🚀 $TUT /USDC — FUTURES LONG
📍 Einstieg: 0.04620 – 0.04670
🛑 Stop Loss: 0.04480
🎯 TP1: 0.04800
🎯 TP2: 0.04970
🎯 TP3: 0.05200
📊 Der 1H-Chart konsolidiert um MA7 und MA25, nachdem die Unterstützung bei 0.04244 gehalten wurde. Ein Ausbruch über 0.04970 könnte stärkeren bullischen Schwung bestätigen.
⚠️ MA99 liegt immer noch über dem Preis, daher ist eine Bestätigung wichtig. Verfolge die Bewegung nicht; kontrolliere das Risiko sorgfältig.
#TUT #TUTUSDC #crypto #Binance #futures
📍 Einstieg: 0.04620 – 0.04670
🛑 Stop Loss: 0.04480
🎯 TP1: 0.04800
🎯 TP2: 0.04970
🎯 TP3: 0.05200
📊 Der 1H-Chart konsolidiert um MA7 und MA25, nachdem die Unterstützung bei 0.04244 gehalten wurde. Ein Ausbruch über 0.04970 könnte stärkeren bullischen Schwung bestätigen.
⚠️ MA99 liegt immer noch über dem Preis, daher ist eine Bestätigung wichtig. Verfolge die Bewegung nicht; kontrolliere das Risiko sorgfältig.
#TUT #TUTUSDC #crypto #Binance #futures
152

#TUTUSDC Was wird der Kurs in 24 Stunden sein? Bitte teile deine Erfahrungen.
#TUTUSDC Was wird der Kurs in 24 Stunden sein? Bitte teile deine Erfahrungen.
127
·
--
Bärisch

欧文兄
·
--
$TUT Das ist ja zu krass! Kaum die Antwort: ein bisschen, schon startet das Auto.
1
189



Übersetzung ansehen
#TUTUSDC TẤT cả chỉ là cú LỪA, Sọc nó ngay và luôn nếu không muốn đu đỉnh trong 2 tuần nữa.
#TUTUSDC TẤT cả chỉ là cú LỪA, Sọc nó ngay và luôn nếu không muốn đu đỉnh trong 2 tuần nữa.
1
1
3
Anmelden und weiter Inhalte entdecken
Krypto-Nutzer weltweit auf Binance Square kennenlernen
⚡️ Bleib in Sachen Krypto stets am Puls.
💬 Die weltgrößte Kryptobörse vertraut darauf.
👍 Erhalte verlässliche Einblicke von verifizierten Creators.
E-Mail-Adresse/Telefonnummer
Trendthemen
1
#GoldFallsTo$4144
1,256 Aufrufe
35 Kommentare
2
#QNTFallsOver40%FromMorningHigh
7,693 Aufrufe
285 Kommentare
3
#KospiFalls2.7%SamsungSKHynixDropOver5%
370 Aufrufe
65 Kommentare
4
#BitgetCEOConfirms$388MStolenInHack
383 Aufrufe
17 Kommentare
5
#BTCFallsBelow$83000
9,854 Aufrufe
97 Kommentare
6
#BitgetDetailsSecurityIncidentTimeline
7,280 Aufrufe
241 Kommentare
7
#BitcoinSpotETFs$2.39BWeeklyNetInflow
3,194 Aufrufe
21 Kommentare
8
#FedProposesPaymentStablecoinRules
32,567 Aufrufe
603 Kommentare
9
#ChinaMayLetAlibabaByteDanceBuyNvidiaChips
34,363 Aufrufe
642 Kommentare
10
#USChinaRelease$30BTariffCutProductLists
3,365 Aufrufe
50 Kommentare