
#turtlecoin
turtlecoin
11,348 Aufrufe
96 Kommentare
Hot
Zuletzt

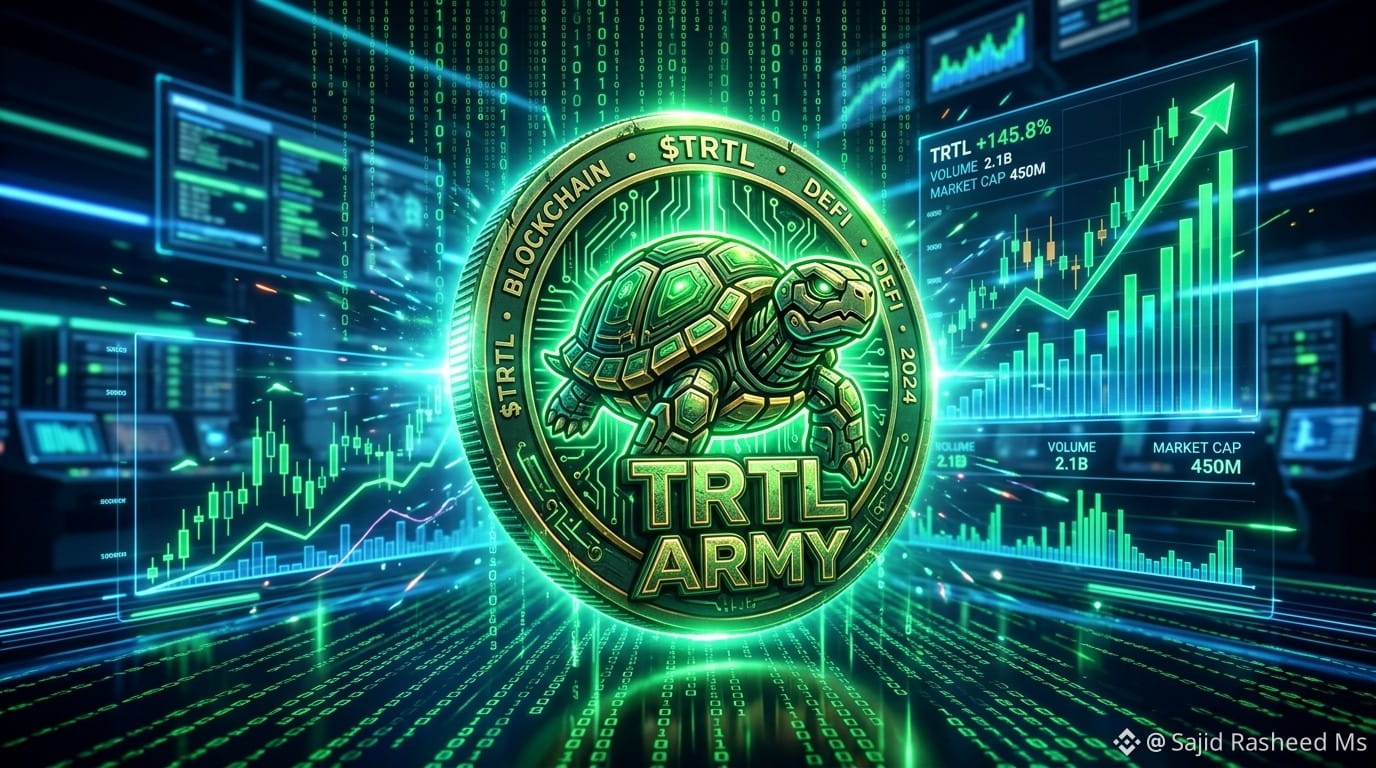
🐢 TurtleCoin ($TRTL): Langsamer & stetiger Goldrausch oder ein toter Meme? 🚀💣
In einem Krypto-Markt, der besessen davon ist, 100x-Gewinne zu jagen: Bereitet TurtleCoin still und leise eine riesige Überraschung vor – oder ist es komplett aus dem Wasser?
Hier ist die schnelle, knallharte Realität in Kürze:
📊 Die Kurz-Analyse:
Das Potenzial: Basierend auf extrem schnellen, leichten und privaten Transaktionen wurde TurtleCoin für Micropayments entwickelt – mit einer tief loyalen, memebasierten Community.
Das Risiko: Harte regulatorische Durchgreifmaßnahmen gegen Privacy Coins und Delistings von großen Börsen haben den Markt-Impuls und die Liquidität massiv abgewürgt.
Das Fazit: Es bleibt ein High-Risk-, High-Reward-Play im Micro-Cap-Bereich. Beobachte es auf deiner Watchlist, aber gehe niemals ohne striktes Risikomanagement „all in“!
👇 Wie siehst du das?
Kann $TRTL einen unerwarteten Comeback hinlegen – oder ist es für immer vorbei? Schreib deine Meinung in die Kommentare!
HASHTAGS:
#TurtleCoin #TRTL #CryptoAnalysis #Altcoins #CryptoNews
$TURTLE
$BTC
$BNB
{future}(TURTLEUSDT)
🐢 TurtleCoin ($TRTL): Langsamer & stetiger Goldrausch oder ein toter Meme? 🚀💣
In einem Krypto-Markt, der besessen davon ist, 100x-Gewinne zu jagen: Bereitet TurtleCoin still und leise eine riesige Überraschung vor – oder ist es komplett aus dem Wasser?
Hier ist die schnelle, knallharte Realität in Kürze:
📊 Die Kurz-Analyse:
Das Potenzial: Basierend auf extrem schnellen, leichten und privaten Transaktionen wurde TurtleCoin für Micropayments entwickelt – mit einer tief loyalen, memebasierten Community.
Das Risiko: Harte regulatorische Durchgreifmaßnahmen gegen Privacy Coins und Delistings von großen Börsen haben den Markt-Impuls und die Liquidität massiv abgewürgt.
Das Fazit: Es bleibt ein High-Risk-, High-Reward-Play im Micro-Cap-Bereich. Beobachte es auf deiner Watchlist, aber gehe niemals ohne striktes Risikomanagement „all in“!
👇 Wie siehst du das?
Kann $TRTL einen unerwarteten Comeback hinlegen – oder ist es für immer vorbei? Schreib deine Meinung in die Kommentare!
HASHTAGS:
#TurtleCoin #TRTL #CryptoAnalysis #Altcoins #CryptoNews
$TURTLE
$BTC
$BNB
In einem Krypto-Markt, der besessen davon ist, 100x-Gewinne zu jagen: Bereitet TurtleCoin still und leise eine riesige Überraschung vor – oder ist es komplett aus dem Wasser?
Hier ist die schnelle, knallharte Realität in Kürze:
📊 Die Kurz-Analyse:
Das Potenzial: Basierend auf extrem schnellen, leichten und privaten Transaktionen wurde TurtleCoin für Micropayments entwickelt – mit einer tief loyalen, memebasierten Community.
Das Risiko: Harte regulatorische Durchgreifmaßnahmen gegen Privacy Coins und Delistings von großen Börsen haben den Markt-Impuls und die Liquidität massiv abgewürgt.
Das Fazit: Es bleibt ein High-Risk-, High-Reward-Play im Micro-Cap-Bereich. Beobachte es auf deiner Watchlist, aber gehe niemals ohne striktes Risikomanagement „all in“!
👇 Wie siehst du das?
Kann $TRTL einen unerwarteten Comeback hinlegen – oder ist es für immer vorbei? Schreib deine Meinung in die Kommentare!
HASHTAGS:
#TurtleCoin #TRTL #CryptoAnalysis #Altcoins #CryptoNews
$TURTLE
$BTC
$BNB
146

🔥 $TURTLE / USDT: Institutional 1H Breakout-Setup & SMC-Liquidity-Rejection
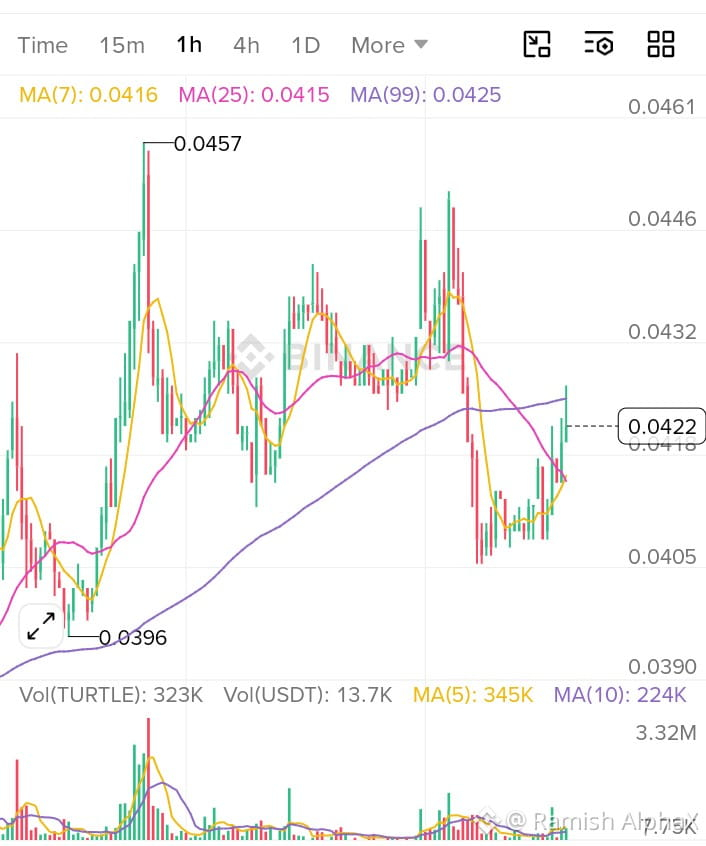
Das 1-Stunden-(1H)-Chart für $TURTLE /USDT zeigt eine aggressive bullische Reaktion aus niedriger Liquidität. Es versucht, zentrale gleitende Durchschnitte zurückzuerobern, nachdem ein scharfer Sell-Side-Sweep stattgefunden hat.
📊 Marktbias: Neutral bis Bullisch (Recovery-Phase)
Trend-Analyse: Nach einer starken Ablehnung vom lokalen Hoch bei 0.0457 $ bis 0.0405 $ bildete der Kurs eine feste Basis um 0.0405–0.0410 $. Käufer haben den Kurs zurück auf 0.0422 $ gedrückt und damit den dynamischen kurzfristigen Widerstand gebrochen. Ein anhaltendes Halten über der 1H MA(99) bestätigt einen vollständigen Wechsel der Marktstruktur.
🎯 Trade-Setup: LONG (Bei Retest / Bestätigung)
Aktion: LONG bei einem Rücksetzer in die 1H-Nachfragezone / MA-Retest.
Einstiegszone: 0.0415 – 0.0419 $ (Konfluenz mit MA(7) & MA(25) Retest)
Stop Loss (SL): 0.0403 $ (Unter dem lokalen Liquiditäts-Tief)
Take Profit 1 (TP1): 0.0435 $ (Zwischenwiderstand / FVG-Fill)
Take Profit 2 (TP2): 0.0446 $ (Letztes Hoch / Buy-Side-Liquiditäts-Pool)
Take Profit 3 (TP3): 0.0457 $ (Wichtiges Swing-High / Liquidity-Ziel)
Risiko:Ertrag (R:R): ~1:2.3 (bis TP2)
Trade-Invalidation: Ein anhaltender 1H-Candle-Schluss unter 0.0403 $ invalidiert die unmittelbare bullische Struktur.
#TURTLE #TurtlePower #TURTLEUSDT #TurtleCoin #TURTLEUSDT
🔥 $TURTLE / USDT: Institutional 1H Breakout-Setup & SMC-Liquidity-Rejection
Das 1-Stunden-(1H)-Chart für $TURTLE /USDT zeigt eine aggressive bullische Reaktion aus niedriger Liquidität. Es versucht, zentrale gleitende Durchschnitte zurückzuerobern, nachdem ein scharfer Sell-Side-Sweep stattgefunden hat.
📊 Marktbias: Neutral bis Bullisch (Recovery-Phase)
Trend-Analyse: Nach einer starken Ablehnung vom lokalen Hoch bei 0.0457 $ bis 0.0405 $ bildete der Kurs eine feste Basis um 0.0405–0.0410 $. Käufer haben den Kurs zurück auf 0.0422 $ gedrückt und damit den dynamischen kurzfristigen Widerstand gebrochen. Ein anhaltendes Halten über der 1H MA(99) bestätigt einen vollständigen Wechsel der Marktstruktur.
🎯 Trade-Setup: LONG (Bei Retest / Bestätigung)
Aktion: LONG bei einem Rücksetzer in die 1H-Nachfragezone / MA-Retest.
Einstiegszone: 0.0415 – 0.0419 $ (Konfluenz mit MA(7) & MA(25) Retest)
Stop Loss (SL): 0.0403 $ (Unter dem lokalen Liquiditäts-Tief)
Take Profit 1 (TP1): 0.0435 $ (Zwischenwiderstand / FVG-Fill)
Take Profit 2 (TP2): 0.0446 $ (Letztes Hoch / Buy-Side-Liquiditäts-Pool)
Take Profit 3 (TP3): 0.0457 $ (Wichtiges Swing-High / Liquidity-Ziel)
Risiko:Ertrag (R:R): ~1:2.3 (bis TP2)
Trade-Invalidation: Ein anhaltender 1H-Candle-Schluss unter 0.0403 $ invalidiert die unmittelbare bullische Struktur.
#TURTLE #TurtlePower #TURTLEUSDT #TurtleCoin #TURTLEUSDT
Das 1-Stunden-(1H)-Chart für $TURTLE /USDT zeigt eine aggressive bullische Reaktion aus niedriger Liquidität. Es versucht, zentrale gleitende Durchschnitte zurückzuerobern, nachdem ein scharfer Sell-Side-Sweep stattgefunden hat.
📊 Marktbias: Neutral bis Bullisch (Recovery-Phase)
Trend-Analyse: Nach einer starken Ablehnung vom lokalen Hoch bei 0.0457 $ bis 0.0405 $ bildete der Kurs eine feste Basis um 0.0405–0.0410 $. Käufer haben den Kurs zurück auf 0.0422 $ gedrückt und damit den dynamischen kurzfristigen Widerstand gebrochen. Ein anhaltendes Halten über der 1H MA(99) bestätigt einen vollständigen Wechsel der Marktstruktur.
🎯 Trade-Setup: LONG (Bei Retest / Bestätigung)
Aktion: LONG bei einem Rücksetzer in die 1H-Nachfragezone / MA-Retest.
Einstiegszone: 0.0415 – 0.0419 $ (Konfluenz mit MA(7) & MA(25) Retest)
Stop Loss (SL): 0.0403 $ (Unter dem lokalen Liquiditäts-Tief)
Take Profit 1 (TP1): 0.0435 $ (Zwischenwiderstand / FVG-Fill)
Take Profit 2 (TP2): 0.0446 $ (Letztes Hoch / Buy-Side-Liquiditäts-Pool)
Take Profit 3 (TP3): 0.0457 $ (Wichtiges Swing-High / Liquidity-Ziel)
Risiko:Ertrag (R:R): ~1:2.3 (bis TP2)
Trade-Invalidation: Ein anhaltender 1H-Candle-Schluss unter 0.0403 $ invalidiert die unmittelbare bullische Struktur.
#TURTLE #TurtlePower #TURTLEUSDT #TurtleCoin #TURTLEUSDT
98

·
--
Buchung einiger $TURTLE Wie ist deine Meinung zu #TurtleCoin Kommentiere hier!
Buchung einiger $TURTLE Wie ist deine Meinung zu #TurtleCoin Kommentiere hier!
1
91

·
--
HÖR AUF, EIN PUPPENTRÄGER DES PUMPS ZU SEIN. WIR ESSEN WALE ZUM FRÜHSTÜCK 🦈📈
$TURTLE
{spot}(TURTLEUSDT)
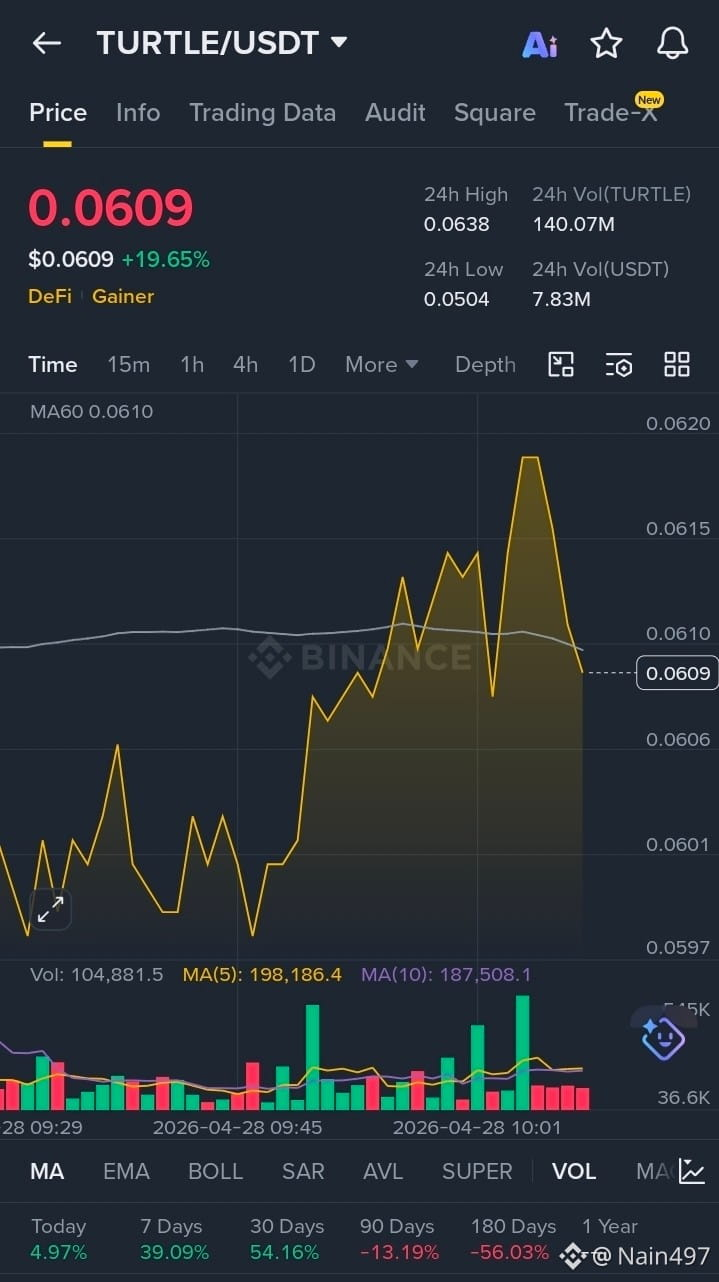
es wird gleich bluten, weil es auf eine massive Wand der Ablehnung gestoßen ist
EINSTIEG: 0.0609 - 0.0620
ZIELE: 0.055, 0.048, 0.040
SL: 0.065 HALT DICH FEST
Dieser falsche Pump hat nur die Noobs gefangen. Es gibt keine Stärke mehr und der Widerstand ist zu stark.
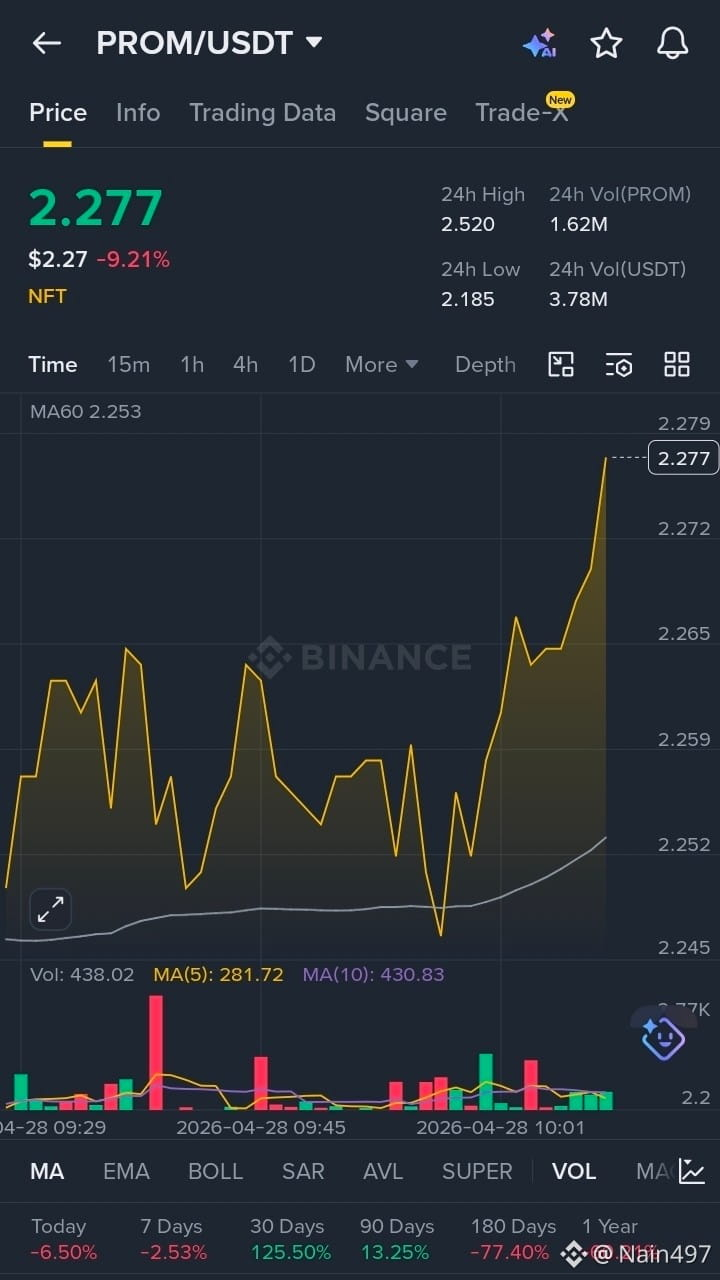
Wir haben das gleiche mit PROM gemacht und die Gewinne leicht eingestrichen.
Halte dich an den Plan und sieh zu, wie der Dump passiert.
DYOR IMMER
$PROM
{spot}(PROMUSDT)
#Crypto #Trading #TurtleCoin #ShortSignal #Bearish 📉
Hinterlasse einen Kommentar für profitable Trades
Folge mir & Folge für mehr
HÖR AUF, EIN PUPPENTRÄGER DES PUMPS ZU SEIN. WIR ESSEN WALE ZUM FRÜHSTÜCK 🦈📈
$TURTLE
es wird gleich bluten, weil es auf eine massive Wand der Ablehnung gestoßen ist
EINSTIEG: 0.0609 - 0.0620
ZIELE: 0.055, 0.048, 0.040
SL: 0.065 HALT DICH FEST
Dieser falsche Pump hat nur die Noobs gefangen. Es gibt keine Stärke mehr und der Widerstand ist zu stark.
Wir haben das gleiche mit PROM gemacht und die Gewinne leicht eingestrichen.
Halte dich an den Plan und sieh zu, wie der Dump passiert.
DYOR IMMER
$PROM
#Crypto #Trading #TurtleCoin #ShortSignal #Bearish 📉
Hinterlasse einen Kommentar für profitable Trades
Folge mir & Folge für mehr
$TURTLE
es wird gleich bluten, weil es auf eine massive Wand der Ablehnung gestoßen ist
EINSTIEG: 0.0609 - 0.0620
ZIELE: 0.055, 0.048, 0.040
SL: 0.065 HALT DICH FEST
Dieser falsche Pump hat nur die Noobs gefangen. Es gibt keine Stärke mehr und der Widerstand ist zu stark.
Wir haben das gleiche mit PROM gemacht und die Gewinne leicht eingestrichen.
Halte dich an den Plan und sieh zu, wie der Dump passiert.
DYOR IMMER
$PROM
#Crypto #Trading #TurtleCoin #ShortSignal #Bearish 📉
Hinterlasse einen Kommentar für profitable Trades
Folge mir & Folge für mehr
171

·
--
Bullisch
🐢 $TURTLE zeigt wieder Anzeichen von
Stärke!
Nach einer Phase der Konsolidierung scheint die Münze an Schwung zu gewinnen und stetige Unterstützung aufzubauen.
Die Käufer treten langsam wieder zurück ein, und die Stimmung in der Gemeinschaft wird positiv.
Wenn diese Energie anhält, könnten wir in den kommenden Minuten oder Stunden einen soliden Aufwärtsschub sehen.
Langsam und stetig — so wie der Name schon sagt — könnte die SCHILDKRÖTE sich auf einen weiteren Durchbruch vorbereiten. 🚀
$TURTLE
#bullish #Web3 #HODL #TradingCommunity #TURTLEcoin
🐢 $TURTLE zeigt wieder Anzeichen von
Stärke!
Nach einer Phase der Konsolidierung scheint die Münze an Schwung zu gewinnen und stetige Unterstützung aufzubauen.
Die Käufer treten langsam wieder zurück ein, und die Stimmung in der Gemeinschaft wird positiv.
Wenn diese Energie anhält, könnten wir in den kommenden Minuten oder Stunden einen soliden Aufwärtsschub sehen.
Langsam und stetig — so wie der Name schon sagt — könnte die SCHILDKRÖTE sich auf einen weiteren Durchbruch vorbereiten. 🚀
$TURTLE
#bullish #Web3 #HODL #TradingCommunity #TURTLEcoin
Stärke!
Nach einer Phase der Konsolidierung scheint die Münze an Schwung zu gewinnen und stetige Unterstützung aufzubauen.
Die Käufer treten langsam wieder zurück ein, und die Stimmung in der Gemeinschaft wird positiv.
Wenn diese Energie anhält, könnten wir in den kommenden Minuten oder Stunden einen soliden Aufwärtsschub sehen.
Langsam und stetig — so wie der Name schon sagt — könnte die SCHILDKRÖTE sich auf einen weiteren Durchbruch vorbereiten. 🚀
$TURTLE
#bullish #Web3 #HODL #TradingCommunity #TURTLEcoin

4
507
Anmelden und weiter Inhalte entdecken
Krypto-Nutzer weltweit auf Binance Square kennenlernen
⚡️ Bleib in Sachen Krypto stets am Puls.
💬 Die weltgrößte Kryptobörse vertraut darauf.
👍 Erhalte verlässliche Einblicke von verifizierten Creators.
E-Mail-Adresse/Telefonnummer
Trendthemen
1
#BTCBreaks80K
123,491 Aufrufe
1,928 Kommentare
2
#比特币突破8万
95,159 Aufrufe
272 Kommentare
3
#SOLJumpsAbout10%
83 Aufrufe
34 Kommentare
4
#EthereumReclaims$2600
130 Aufrufe
23 Kommentare
5
#SECReceivesAmendedInjectiveETFFiling
1,181 Aufrufe
71 Kommentare
6
#SanDiskToJoinSP100OnSep21
707 Aufrufe
58 Kommentare
7
#PolygonToDeployContractBurning100MPOL
531 Aufrufe
38 Kommentare
8
#YahooFinanceEndsPolymarketPartnership
277 Aufrufe
18 Kommentare
9
#BuffettBecomesBerkshireChairmanEmeritus
32,067 Aufrufe
647 Kommentare
10
#ZcashSpotETFTops$230MMonthlyInflow
7,370 Aufrufe
85 Kommentare