

#chartstructure
chartstructure
2,128 Aufrufe
32 Kommentare
Hot
Zuletzt

·
--
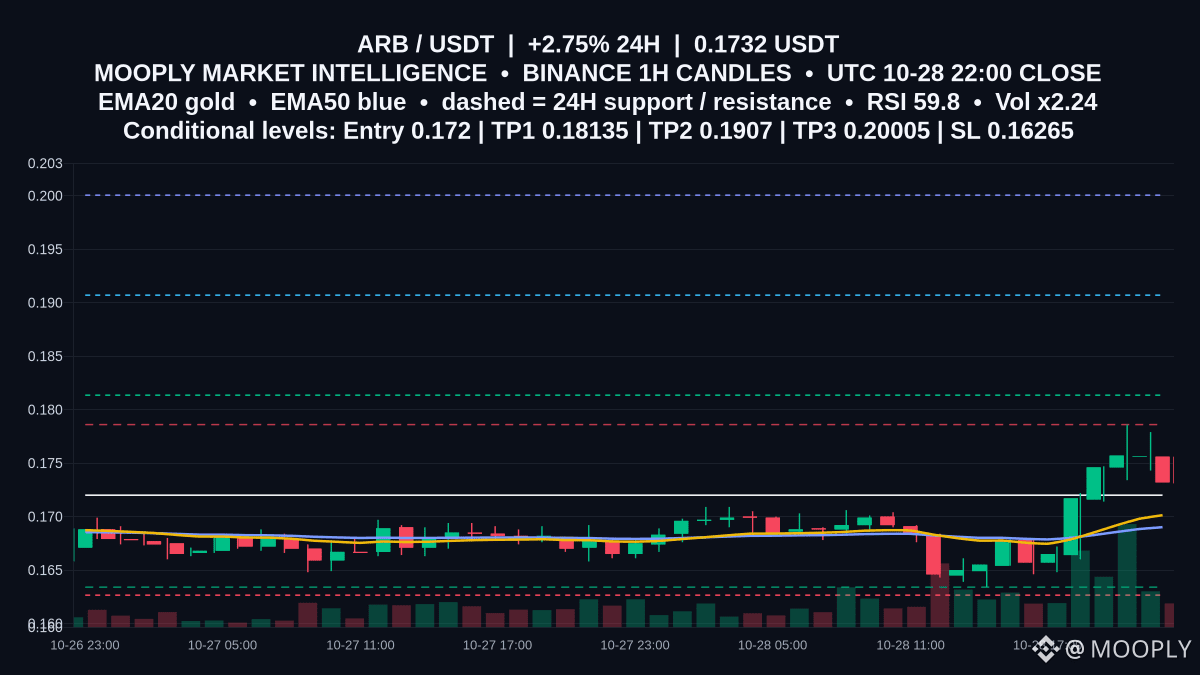
$ARB wird nach einer 24-Stunden-Bewegung von 2.75% bei 0.1732 gehandelt – ein bescheidener Ausbruchsversuch innerhalb einer volatilen Sitzung mit höherem Handelsvolumen.
EMA20 (0.17013) liegt über EMA50 (0.16901), RSI 59.82 und ein positiver MACD deuten auf eine kurzfristig bullische Tendenz hin; der ATR14 von 0.00299 gibt die typische stündliche Schwankungsbreite an und hilft bei der Festlegung des Stop-Abstands. Wichtige horizontale Linien: Unterstützung bei 0.1634 und Widerstand bei 0.1786.
📍 Möglicher Einstieg: 0.172
🎯 Ziel 1: 0.18135
🎯 Ziel 2: 0.1907
🛑 Stop / Ungültigkeit: 0.16265
Dies ist ein bedingtes bullisches Szenario: Eine Bestätigung wäre gegeben, wenn der Kurs über dem Einstieg bei 0.172 bleibt und den Widerstand bei 0.1786 angreift. Das Setup ist hinfällig, wenn der Kurs die Unterstützung bei etwa 0.1634 durchbricht und den angegebenen Stop erreicht. Möchtest du daraus einen stündlichen Alarm machen oder die Angaben im Chart markieren lassen?
Keine Finanzberatung.
#ARB #ChartStructure #Aufwärtsszenario
90
·
--
Übersetzung ansehen
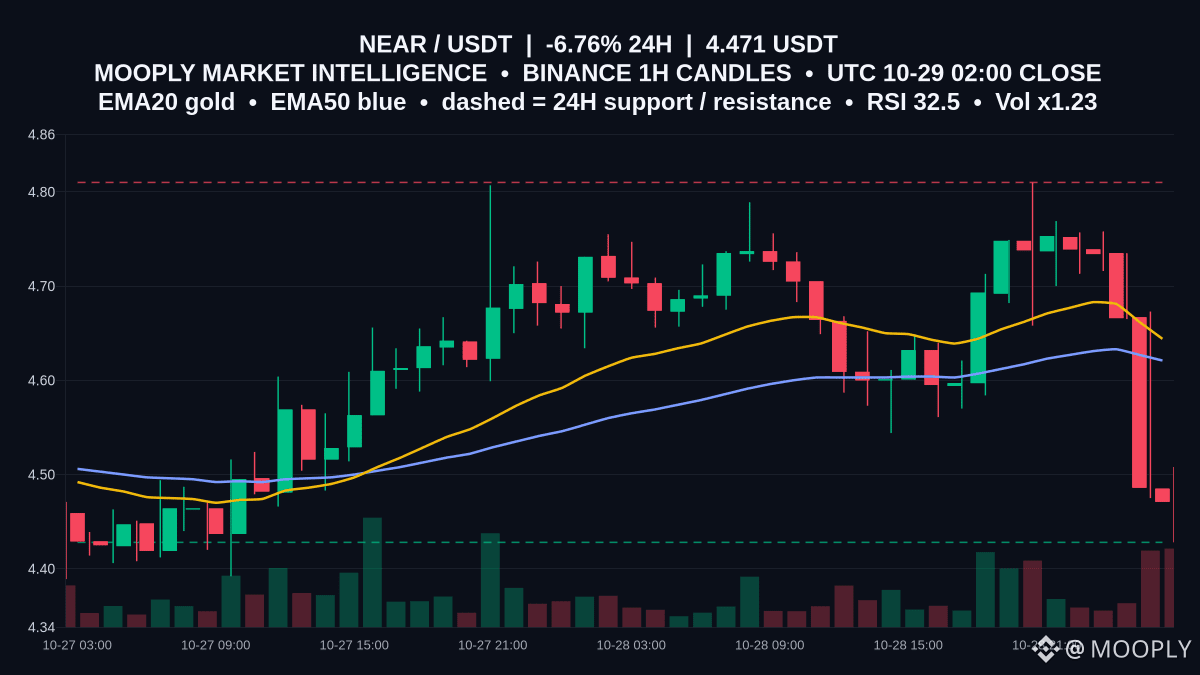
Pullback deepens for $NEAR, printing 4.471 with a -6.762% 24h slide.
RSI at 32.52 signals near-oversold, but price sits beneath EMA20 4.644 and EMA50 4.621, showing sellers in control on the 1h. With ATR 0.084 and volume around 1.23x recent, expect choppy but contained moves.
Range in play: support is 4.428 and resistance is 4.81. A 1h close below 4.428 would tip the range lower; a firm reclaim and hold above the 4.621–4.644 EMA band would ease pressure and refocus price toward 4.81 while that cap holds.
Which comes first on your radar: a defense of 4.428 or a reclaim of the EMA band near 4.62–4.64?
Not financial advice.
#NEAR #ChartStructure #RangeWatch
Pullback deepens for $NEAR , printing 4.471 with a -6.762% 24h slide.
RSI at 32.52 signals near-oversold, but price sits beneath EMA20 4.644 and EMA50 4.621, showing sellers in control on the 1h. With ATR 0.084 and volume around 1.23x recent, expect choppy but contained moves.
Range in play: support is 4.428 and resistance is 4.81. A 1h close below 4.428 would tip the range lower; a firm reclaim and hold above the 4.621–4.644 EMA band would ease pressure and refocus price toward 4.81 while that cap holds.
Which comes first on your radar: a defense of 4.428 or a reclaim of the EMA band near 4.62–4.64?
Not financial advice.
#NEAR #ChartStructure #RangeWatch
60
·
--
Übersetzung ansehen
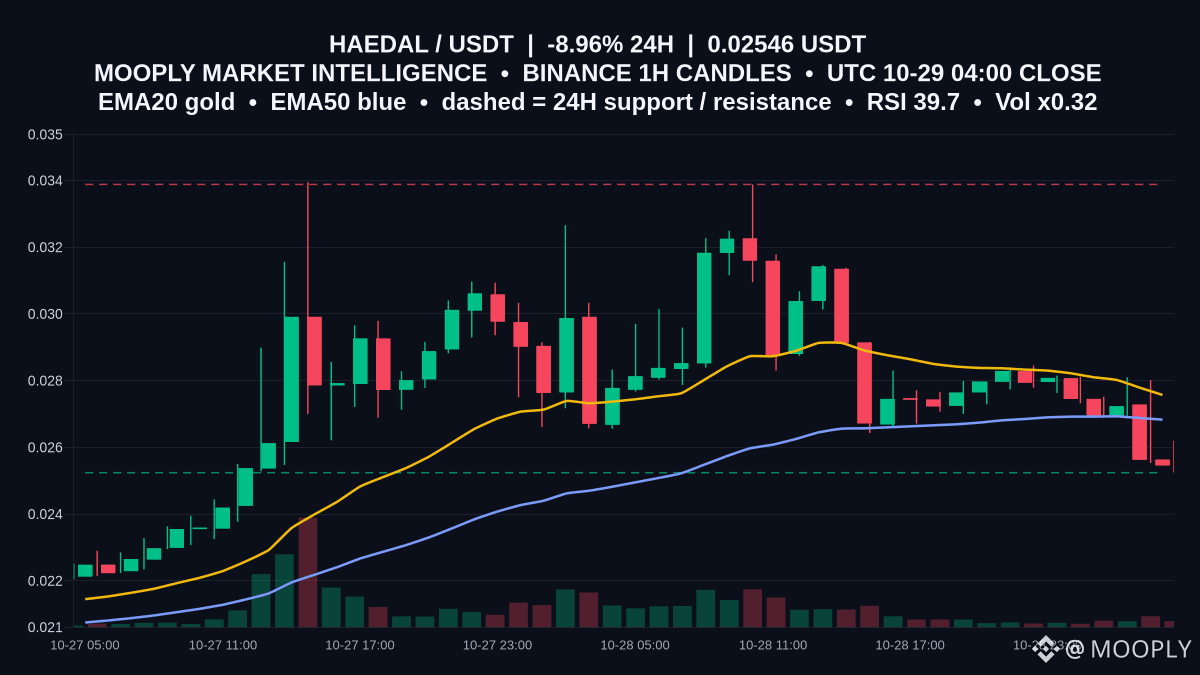
$HAEDAL slipped to 0.02546 (-8.96% 24H) as the last 1h candle closed near a make-or-break zone.
Why it matters: 0.02524 is defined support on this 1h view; with ATR14 at 0.00112 and volume running at 0.32x, whipsaws around this floor are plausible. RSI 39.7 and a negative MACD align with price trading below EMA50 0.02683 and EMA20 0.02757, keeping bias cautious.
Range outlook: support 0.02524, resistance 0.03388. Holding hourly closes above 0.02524 keeps the range intact; a rebound reclaiming 0.02683 would hint at stabilization toward 0.02757. Rejections under 0.02683 keep pressure on 0.02524, while a firm close above 0.03388 would mark a range break.
Would you like an alert on the next 1h close versus 0.02524 and 0.02683?
Not financial advice.
#HAEDAL #ChartStructure #RangeWatch
78
·
--
Übersetzung ansehen
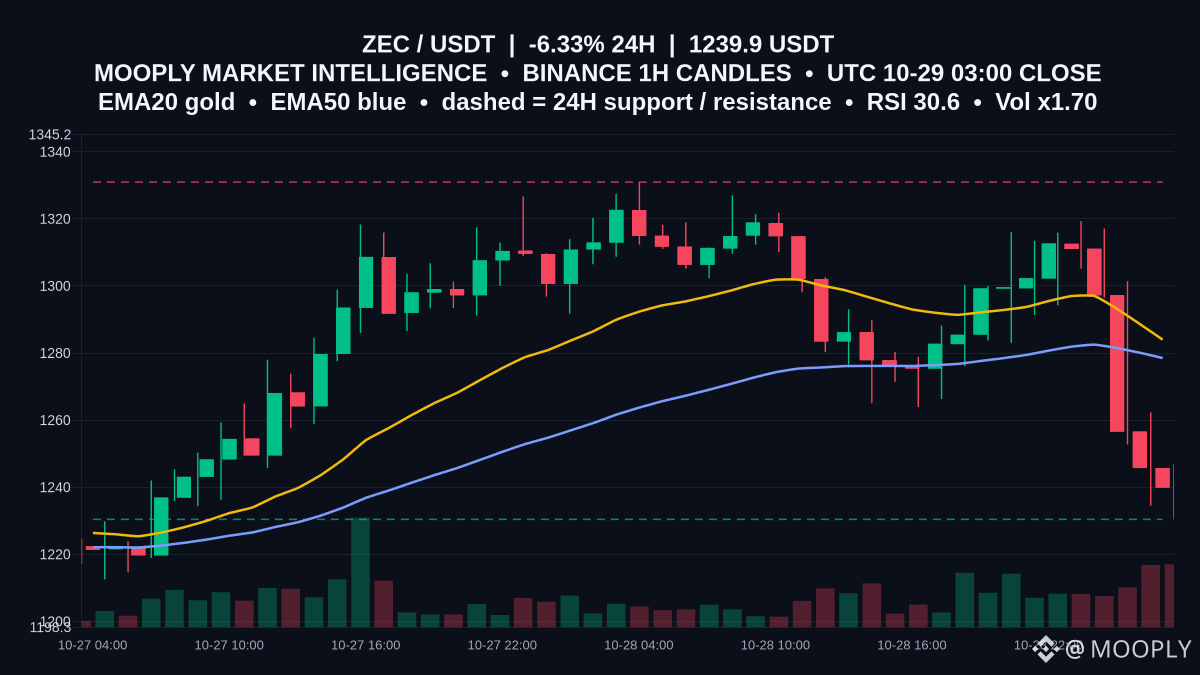
$ZEC slips to 1239.9, down -6.332% over 24h with Vol x1.70, as momentum cools.
Price is hovering just above 1230.4 support while RSI 30.6 hints at pressure without full capitulation. Both EMA20 1283.99 and EMA50 1278.5 are rolling over above price, reinforcing a cautious tone. With resistance at 1330.95, the working view is a 1230.4–1330.95 range until either the EMAs are reclaimed or the floor gives way.
For now, watch 1230.4 as the near-term line in the sand; an hourly close back above 1283.99 would refocus price toward 1330.95. Which level are you watching first: a reclaim of 1283.99 or a test of 1230.4?
Not financial advice.
#ZEC #ChartStructure #RangeWatch
1
119
·
--
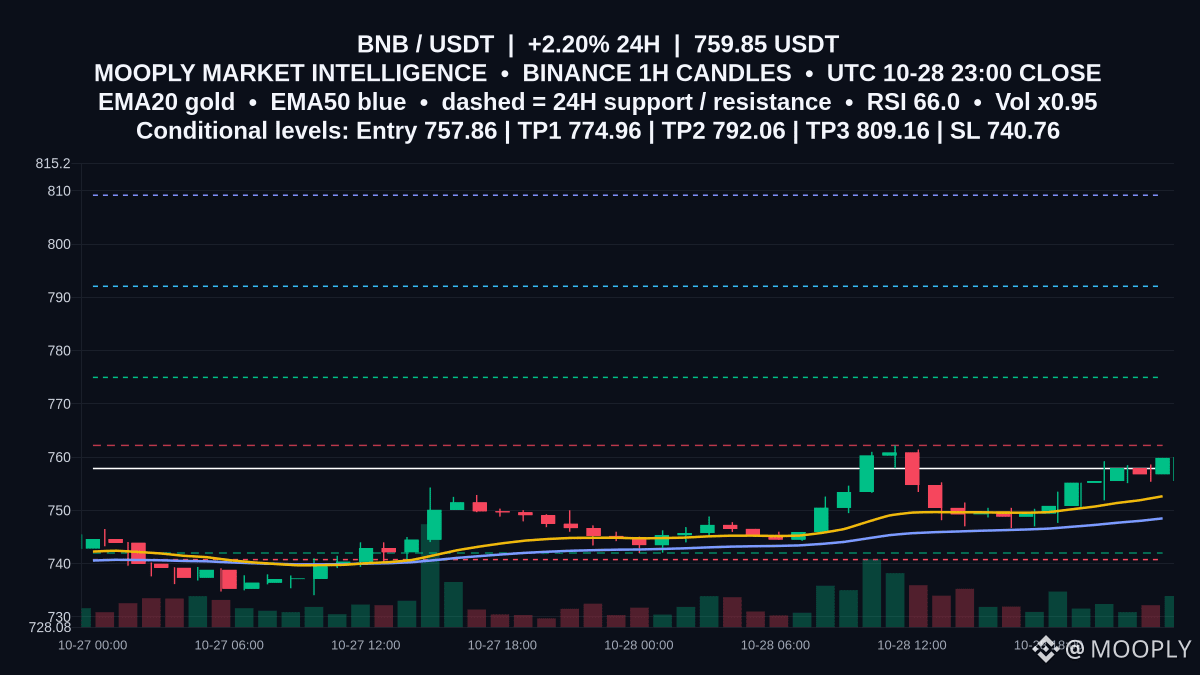
Breakout im Blick: $BNB liegt knapp unter einer klar definierten Obergrenze, während sich das Momentum festigt.
Der Kurs liegt bei 759.85 und hält sich über EMA20 752.66 und EMA50 748.5, der RSI liegt bei 65.98. Diese Konstellation rückt den Widerstand bei 762.2 in den Fokus; ein klarer Ausbruch darüber würde den Übergang von der Unterstützungsbasis bei 742 zu höheren Niveaus markieren.
📍 Möglicher Einstieg: 757.86
🎯 Ziel 1: 774.96
🎯 Ziel 2: 792.06
🛑 Stop / Invalidierung: 740.76
Eine Bestätigung wäre ein 1-h-Schlusskurs über 762.2 bei anhaltender Nachfrage oberhalb von 757.86; damit bleiben 774.96 und 792.06 im Spiel. Fällt die Unterstützung bei 742 oder schließt der Kurs unter 740.76, ist das Szenario hinfällig. Ein Kurs über EMA20 752.66 erhält die kurzfristig bullische Tendenz.
Möchtest du eine Benachrichtigung bei einem bestätigten 1-h-Schlusskurs über 762.2 oder bei einem erneuten Test von 742?
Keine Anlageberatung.
#BNB #ChartStructure #UpsideScenario
59
·
--
Übersetzung ansehen
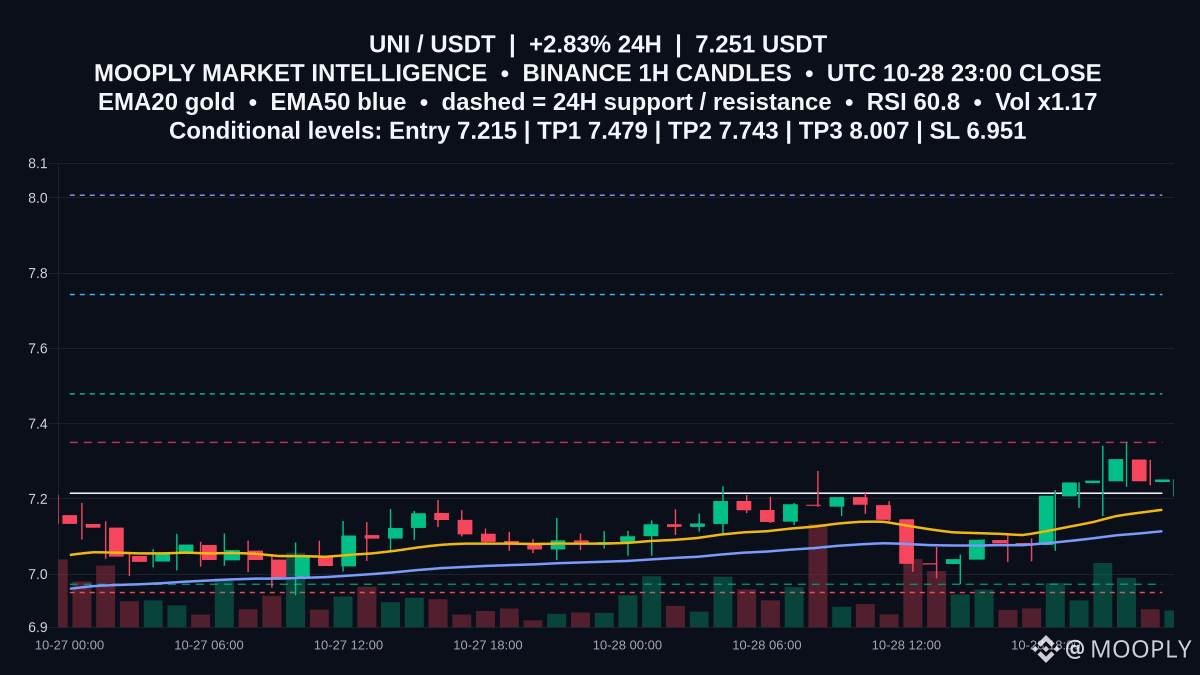
Quick read on $UNI — trading at 7.251 USDT with a 24h move of 2.833%.
EMA20 (7.171) sits above EMA50 (7.114) and MACD is positive, suggesting short-term bullish bias. The 24h resistance at 7.35 is the immediate level that would confirm momentum; ATR14 0.089 shows measured volatility, and support at 6.973 lines up near the proposed invalidation zone.
📍 Potential entry: 7.215
🎯 Target 1: 7.479
🎯 Target 2: 7.743
🛑 Stop / invalidation: 6.951
This is a conditional bullish scenario: a sustained move above resistance 7.35 would confirm momentum while a drop below 6.973 (stop at 6.951 sits just below support) would invalidate it. Entry here is a scenario based on ATR and completed 1h candles, not an execution signal.
Do you want me to track 1h closes above 7.35 and alert on a confirmed breakout?
Not financial advice.
#UNI #ChartStructure #UpsideScenario
34
·
--
Übersetzung ansehen
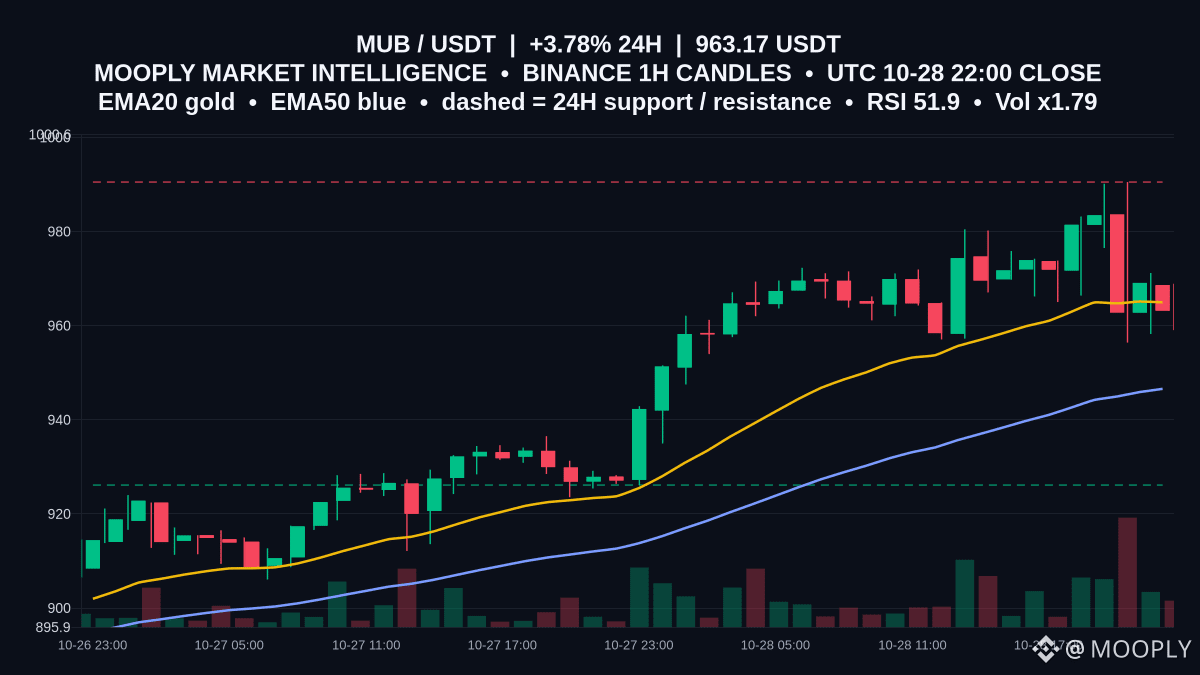
$MUB — The chart looks like a corridor more than a trend: price 963.17 sits just below EMA20 964.94 and above EMA50 946.57, inside the 24h dashed bands (support 926.12 / resistance 990.5). ATR14 = 12.63 shows modest hourly volatility, while volRatio 1.79 signals above-average activity. MACD (7.83) below its signal (10.14) hints momentum softness.
tradePlan = RANGE (confidence: wait; method: ATR14 and completed Binance 1h candles). Wait for a clear 1h close beyond 990.5 to consider a breakout confirmation, or a decisive close below 926.12 to invalidate the range—which 1h close will you watch first?
Not financial advice.
#MUB #ChartStructure #RangeWatch
23
·
--
Übersetzung ansehen
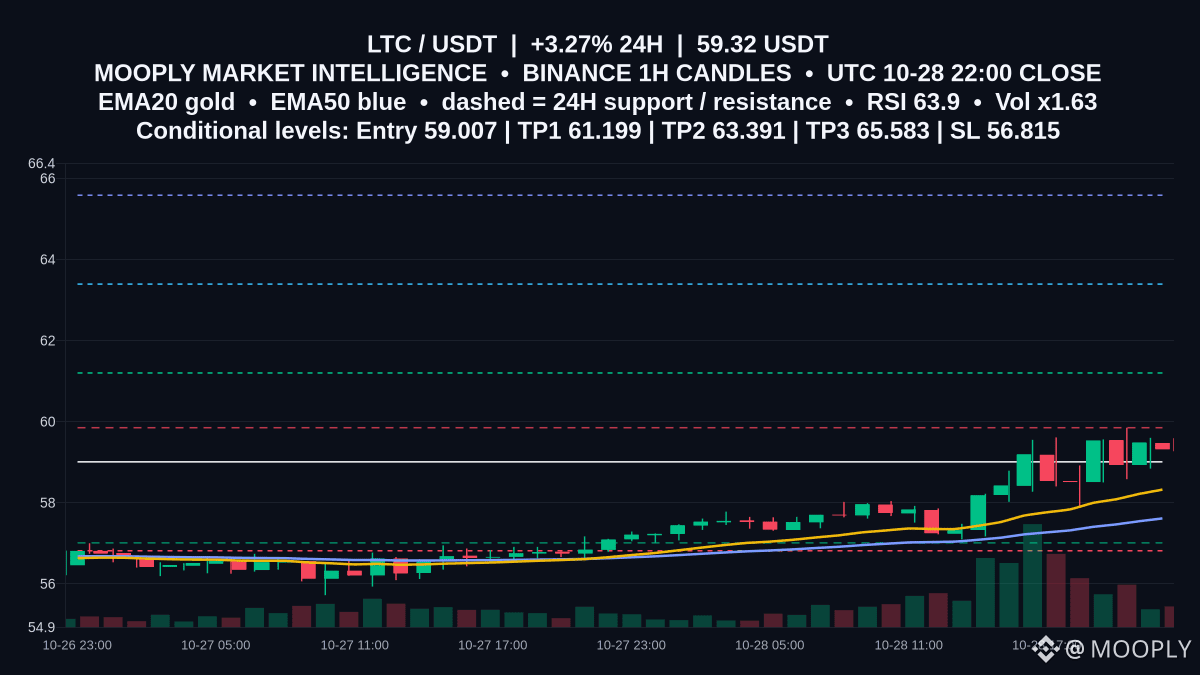
$LTC — Chart walkthrough — 1h shows the short EMAs leading the move: EMA20 58.323 over EMA50 57.613, with price at 59.32 and RSI 63.93. Volume is elevated (volRatio 1.63), so momentum has weight.
Conditional plan notes entry 59.007, SL 56.815, TP1 61.199 and TP2 63.391. Confirmation would be a sustained close above resistance 59.85 on continued volume; a breach below 56.815 or support 57.01 would invalidate. Can volume push and hold above 59.85?
Not financial advice.
#LTC #ChartStructure #UpsideScenario
38


·
--
Bullisch
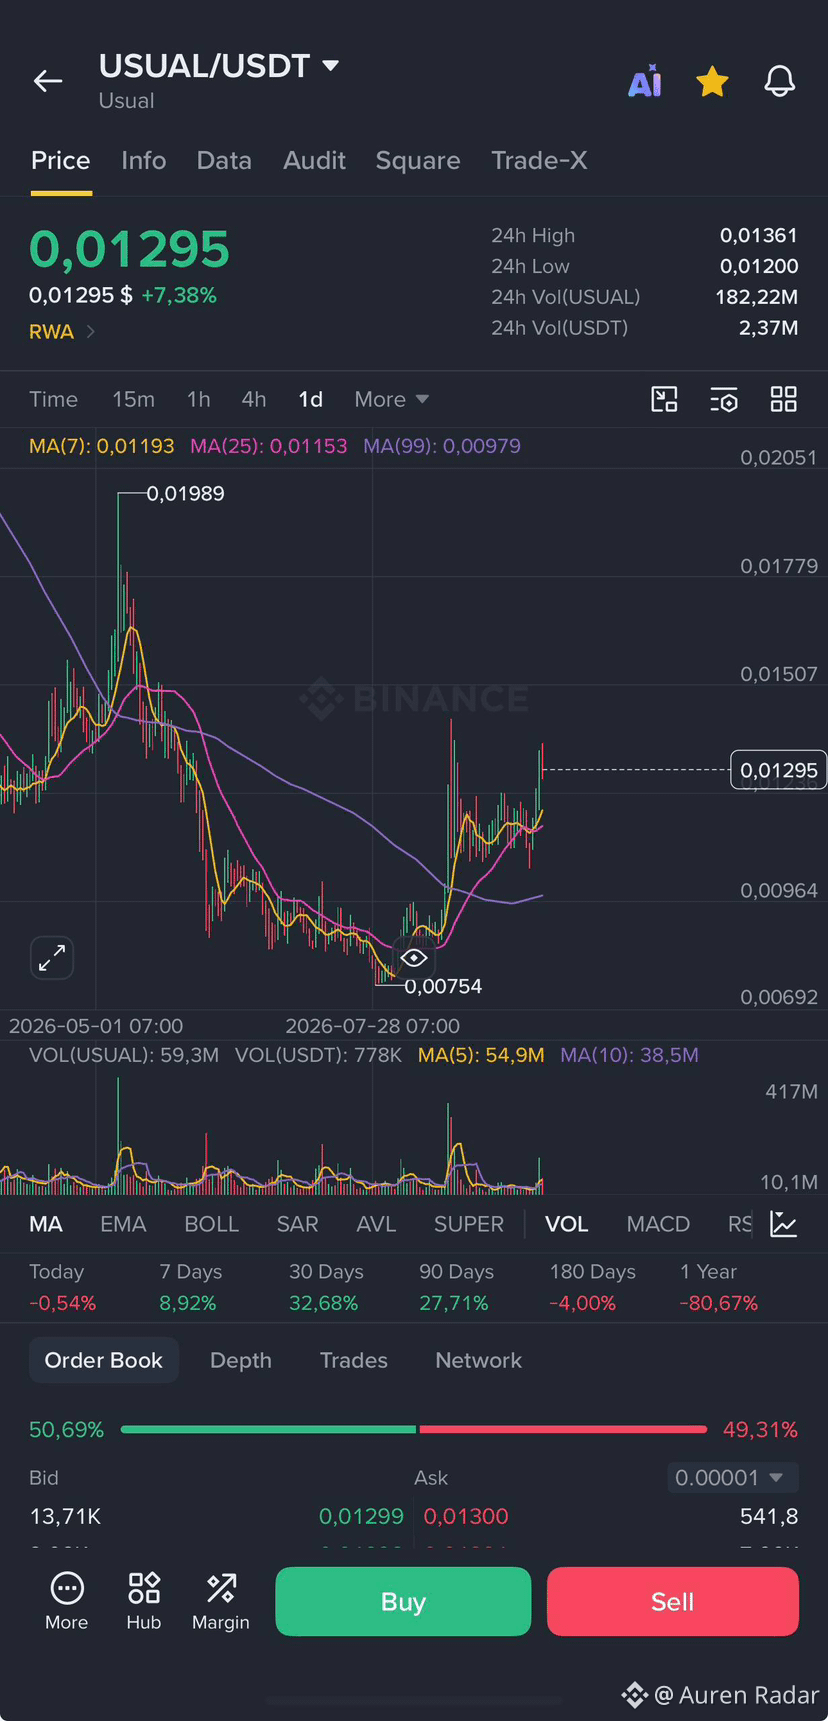
📡 $USUAL | Update
Steigt um 5% und dann Backtesting zur Bestätigung, saubere Chart-Struktur entsteht.
Unterstützung hält stark durch den Retest, das Setup bleibt solide für nachhaltiges Wachstum, während der RWA-Trend weiterläuft👀
📌 Persönliche Meinung, keine finanzielle Beratung. Informiere dich selbst (DYOR).
#USUAL #RWA #Altcoins #ChartStructure $USUAL
{future}(USUALUSDT)
📡 $USUAL | Update
Steigt um 5% und dann Backtesting zur Bestätigung, saubere Chart-Struktur entsteht.
Unterstützung hält stark durch den Retest, das Setup bleibt solide für nachhaltiges Wachstum, während der RWA-Trend weiterläuft👀
📌 Persönliche Meinung, keine finanzielle Beratung. Informiere dich selbst (DYOR).
#USUAL #RWA #Altcoins #ChartStructure $USUAL
Auren Radar
·
--
Bullisch📡 $USUAL | RWA
Chart-Ausbruch bestätigt mit Backtest, der stabil bleibt, RWA-Trend heizt sich auf, während $ONDO hart anführt.
Gleicher Sektor-Momentum, saubere Chart-Struktur, positioniert, um zu folgen, wenn die RWA-Welle sich ausdehnt👀
📌 Meine persönliche Meinung, keine finanzielle Beratung. Informier dich selbst (DYOR).
#USUAL #RWA #Altcoins #Breakout $USUAL
1
353
·
--
Übersetzung ansehen
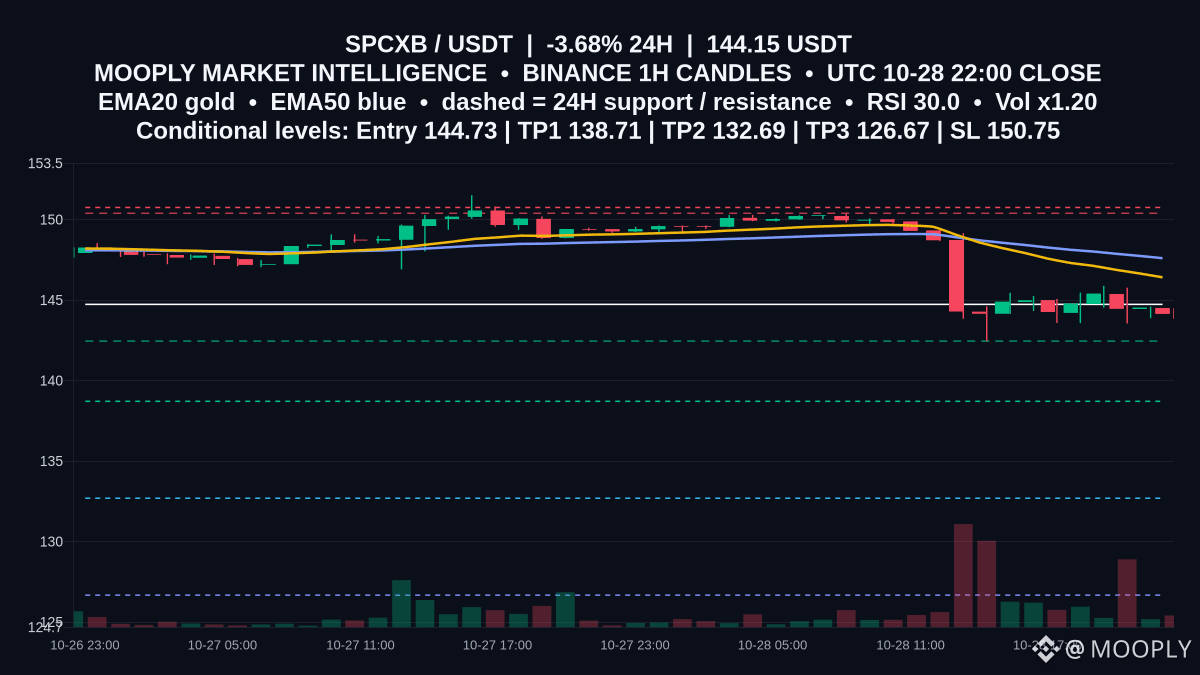
The 1h chart shows $SPCXB trading below EMA20 146.41 and EMA50 147.6, with RSI 29.99 and MACD -1.3198 vs signal -1.01097 — momentum tilted down.
MOOPLY's conditional bearish plan (ATR14 + completed 1h candles) lists Entry 144.73, StopLoss 150.75, TP1 138.71 and TP2 132.69. ATR is 1.45 and volRatio 1.2 — volume slightly elevated during the pullback.
Confirmation = a completed 1h around/below 144.73; invalidation = decisive closes above 150.75 or sustained reclaim of EMA20/50.
Will a 1h close below 144.73 target 138.71 next?
Not financial advice.
#SPCXB #ChartStructure #DownsideScenario
30
Anmelden und weiter Inhalte entdecken
Krypto-Nutzer weltweit auf Binance Square kennenlernen
⚡️ Bleib in Sachen Krypto stets am Puls.
💬 Die weltgrößte Kryptobörse vertraut darauf.
👍 Erhalte verlässliche Einblicke von verifizierten Creators.
E-Mail-Adresse/Telefonnummer
Trendthemen
1
#CanMicrosoftDeliverOnAI
604,791 Aufrufe
3,938 Kommentare
2
#CanGoogleDefindItsCore
370,955 Aufrufe
2,792 Kommentare
3
#FedWatch
16.1M Aufrufe
37,114 Kommentare
4
#BitcoinCore32.1RaisesPeerConnectionLimit
317 Aufrufe
25 Kommentare
5
#EarningsSeason
6.1M Aufrufe
30,184 Kommentare
6
#BitcoinCoreIdentifiesThreeVulnerabilities
10,330 Aufrufe
201 Kommentare
7
#RippleExpects$900MAnnualizedProductRevenueRunRate
688 Aufrufe
10 Kommentare
8
#GoogleToPreviewCryptoCustodySecuritySystem
2,940 Aufrufe
81 Kommentare
9
#FedToBeginShrinkingRateSettingCalendarIn2027
4,021 Aufrufe
54 Kommentare
10
#StrategyShareholdersApproveDailyDividends
3,820 Aufrufe
75 Kommentare