
#weeklyoutlook
weeklyoutlook
13,655 Aufrufe
57 Kommentare
Hot
Zuletzt
·
--
Artikel
Übersetzung ansehen
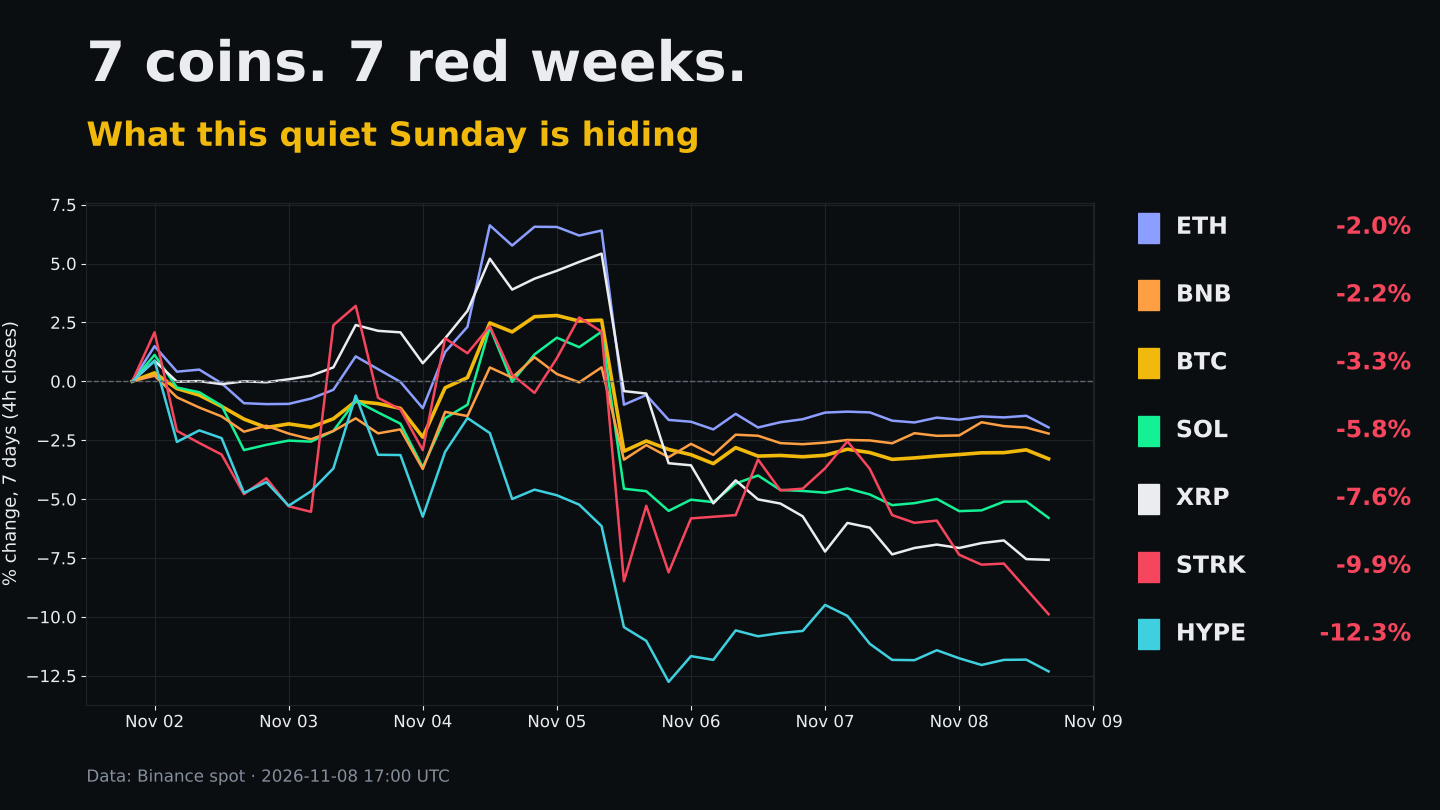
7 Coins, 7 Red Weeks: What This Quiet Sunday Is HidingSeven coins on my watchlist, and not one of them closed the week green. $BTC is the anchor at -3.3% over seven days, ETH and BNB held up best at roughly -2%, and the bottom of the table belongs to $STRK (-9.9%) and $HYPE (-12.3%). That spread says a lot about where risk appetite stands going into Monday.
What actually happened
The week had one real event, and it was Nov 4–5. BTC pushed to a weekly high of 81,196 and closed Nov 4 at 80,504. The very next day it printed a 75,208 low and closed at 76,088, giving back the whole move in one session. Everything else followed: ETH tagged 2,450 before sliding back to the 2,230 area, XRP dropped from 1.34 to 1.15.
Since then, nothing. BTC's last two daily ranges have been tiny: the past 24h ran from 75,571 to 76,200, a band of less than 1%. Price sits at 75,776, near the bottom of its 7-day range (74,888 to 81,196).
The quiet is the story
Volume tells you how little conviction is left. Yesterday BTC traded about 35% of its 7-day average daily volume, and today is tracking similarly thin. ETH, SOL and HYPE show the same picture. Weekend volume is always lighter, but this is low even by Sunday standards.
Why that matters: compression after a failed breakout usually doesn't last. When ranges this tight finally break, the first move tends to be fast because few orders sit in between. The direction is the open question, and the chart doesn't answer it yet.
Where each coin sits right now
Measured against its own 7-day high/low range:
• BNB is the strongest, about 38% of the way up its range at 696.9
• BTC around 14%, ETH around 10%
• SOL near 8% at 89.06
• HYPE around 6% at 77.03
• XRP and STRK basically on their weekly lows (XRP 1.156 vs a 1.15 low, STRK 0.0386 vs 0.03844)
Coins sitting on their lows into a low-volume weekend are the ones most exposed if Monday opens weak. STRK is also down about 47% over 30 days and lost 4.1% in the last 24h alone, so treat it as high risk. HYPE took the hardest hit this week; small and mid caps tend to fall faster than BTC when sentiment cools.
What I'm watching this week
1. BTC 74,888, the weekly low. A clean daily close below it would turn the Nov 5 dump from a "shakeout" into a trend.
2. BTC 78,000–78,900, where the Nov 1–3 candles spent most of their time. Reclaiming that zone would suggest the dip got bought.
3. ETH 2,206, its weekly low, only about 1% below current price.
4. Relative strength. If BNB and ETH keep outperforming while HYPE and STRK keep sliding, the market is rotating toward safety, not getting ready to rip.
5. Monday volume. A break from this range on volume above the 7-day average means more than any intraday wick on a thin Sunday.
Bottom line
It was a red week for all seven, with a failed push above 80k in the middle and almost no activity since. The market is coiled. I'd rather wait for the break and the volume confirming it than guess the direction inside a 1% box.
Which side do you think breaks first: 74.9k or 78k?
Not financial advice.
#WeeklyOutlook #CryptoMarket #Bitcoin
7 Coins, 7 Red Weeks: What This Quiet Sunday Is Hiding
Seven coins on my watchlist, and not one of them closed the week green. $BTC is the anchor at -3.3% over seven days, ETH and BNB held up best at roughly -2%, and the bottom of the table belongs to $STRK (-9.9%) and $HYPE (-12.3%). That spread says a lot about where risk appetite stands going into Monday.
What actually happened
The week had one real event, and it was Nov 4–5. BTC pushed to a weekly high of 81,196 and closed Nov 4 at 80,504. The very next day it printed a 75,208 low and closed at 76,088, giving back the whole move in one session. Everything else followed: ETH tagged 2,450 before sliding back to the 2,230 area, XRP dropped from 1.34 to 1.15.
Since then, nothing. BTC's last two daily ranges have been tiny: the past 24h ran from 75,571 to 76,200, a band of less than 1%. Price sits at 75,776, near the bottom of its 7-day range (74,888 to 81,196).
The quiet is the story
Volume tells you how little conviction is left. Yesterday BTC traded about 35% of its 7-day average daily volume, and today is tracking similarly thin. ETH, SOL and HYPE show the same picture. Weekend volume is always lighter, but this is low even by Sunday standards.
Why that matters: compression after a failed breakout usually doesn't last. When ranges this tight finally break, the first move tends to be fast because few orders sit in between. The direction is the open question, and the chart doesn't answer it yet.
Where each coin sits right now
Measured against its own 7-day high/low range:
• BNB is the strongest, about 38% of the way up its range at 696.9
• BTC around 14%, ETH around 10%
• SOL near 8% at 89.06
• HYPE around 6% at 77.03
• XRP and STRK basically on their weekly lows (XRP 1.156 vs a 1.15 low, STRK 0.0386 vs 0.03844)
Coins sitting on their lows into a low-volume weekend are the ones most exposed if Monday opens weak. STRK is also down about 47% over 30 days and lost 4.1% in the last 24h alone, so treat it as high risk. HYPE took the hardest hit this week; small and mid caps tend to fall faster than BTC when sentiment cools.
What I'm watching this week
1. BTC 74,888, the weekly low. A clean daily close below it would turn the Nov 5 dump from a "shakeout" into a trend.
2. BTC 78,000–78,900, where the Nov 1–3 candles spent most of their time. Reclaiming that zone would suggest the dip got bought.
3. ETH 2,206, its weekly low, only about 1% below current price.
4. Relative strength. If BNB and ETH keep outperforming while HYPE and STRK keep sliding, the market is rotating toward safety, not getting ready to rip.
5. Monday volume. A break from this range on volume above the 7-day average means more than any intraday wick on a thin Sunday.
Bottom line
It was a red week for all seven, with a failed push above 80k in the middle and almost no activity since. The market is coiled. I'd rather wait for the break and the volume confirming it than guess the direction inside a 1% box.
Which side do you think breaks first: 74.9k or 78k?
Not financial advice.
#WeeklyOutlook #CryptoMarket #Bitcoin
What actually happened
The week had one real event, and it was Nov 4–5. BTC pushed to a weekly high of 81,196 and closed Nov 4 at 80,504. The very next day it printed a 75,208 low and closed at 76,088, giving back the whole move in one session. Everything else followed: ETH tagged 2,450 before sliding back to the 2,230 area, XRP dropped from 1.34 to 1.15.
Since then, nothing. BTC's last two daily ranges have been tiny: the past 24h ran from 75,571 to 76,200, a band of less than 1%. Price sits at 75,776, near the bottom of its 7-day range (74,888 to 81,196).
The quiet is the story
Volume tells you how little conviction is left. Yesterday BTC traded about 35% of its 7-day average daily volume, and today is tracking similarly thin. ETH, SOL and HYPE show the same picture. Weekend volume is always lighter, but this is low even by Sunday standards.
Why that matters: compression after a failed breakout usually doesn't last. When ranges this tight finally break, the first move tends to be fast because few orders sit in between. The direction is the open question, and the chart doesn't answer it yet.
Where each coin sits right now
Measured against its own 7-day high/low range:
• BNB is the strongest, about 38% of the way up its range at 696.9
• BTC around 14%, ETH around 10%
• SOL near 8% at 89.06
• HYPE around 6% at 77.03
• XRP and STRK basically on their weekly lows (XRP 1.156 vs a 1.15 low, STRK 0.0386 vs 0.03844)
Coins sitting on their lows into a low-volume weekend are the ones most exposed if Monday opens weak. STRK is also down about 47% over 30 days and lost 4.1% in the last 24h alone, so treat it as high risk. HYPE took the hardest hit this week; small and mid caps tend to fall faster than BTC when sentiment cools.
What I'm watching this week
1. BTC 74,888, the weekly low. A clean daily close below it would turn the Nov 5 dump from a "shakeout" into a trend.
2. BTC 78,000–78,900, where the Nov 1–3 candles spent most of their time. Reclaiming that zone would suggest the dip got bought.
3. ETH 2,206, its weekly low, only about 1% below current price.
4. Relative strength. If BNB and ETH keep outperforming while HYPE and STRK keep sliding, the market is rotating toward safety, not getting ready to rip.
5. Monday volume. A break from this range on volume above the 7-day average means more than any intraday wick on a thin Sunday.
Bottom line
It was a red week for all seven, with a failed push above 80k in the middle and almost no activity since. The market is coiled. I'd rather wait for the break and the volume confirming it than guess the direction inside a 1% box.
Which side do you think breaks first: 74.9k or 78k?
Not financial advice.
#WeeklyOutlook #CryptoMarket #Bitcoin
·
--
Artikel
Übersetzung ansehen
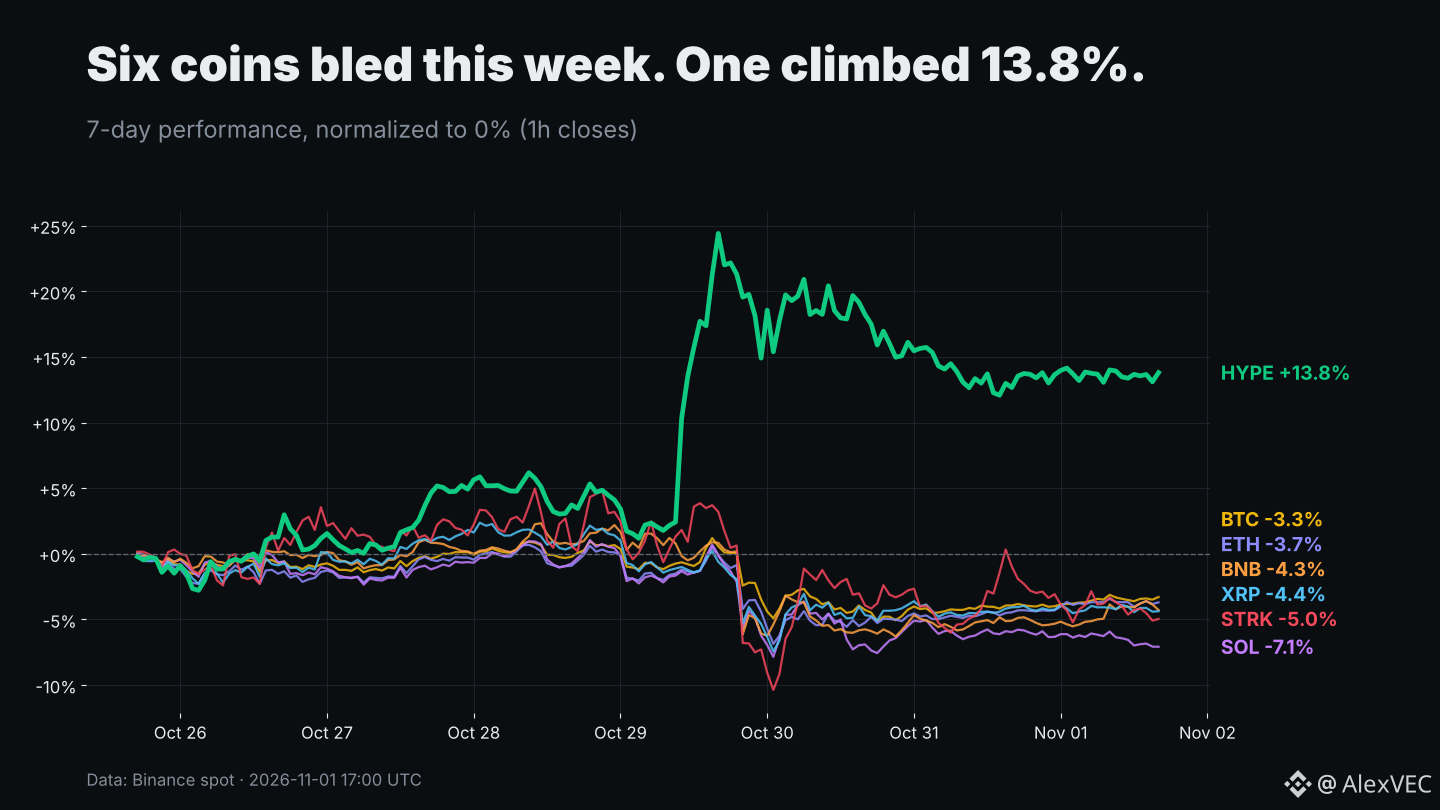
Six coins bled this week. One climbed 13.8%: the November outlookSix of the seven majors I track closed the week in the red. The seventh, $HYPE, is up 13.8% over the same 168 hours. If you only watched the big caps this week, you missed the most interesting chart on the board.
Here's the weekly outlook going into November, built only on Binance spot data pulled today (Nov 1, ~17:00 UTC).
The scoreboard (7 days)
HYPE +13.8%
BTC -3.3%
ETH -3.7%
BNB -4.3%
XRP -4.4%
STRK -5.0%
SOL -7.1%
What actually happened
The whole week turned on one day. On Oct 29 the market got hit hard: on daily closes $BTC went from 81,343 to 77,992 (-4.1%), BNB dropped from 759.85 to 698.46 (-8.1%), SOL from 102.44 to 95.64 (-6.6%). Since then nothing has reclaimed those levels. BTC's 7-day high is 81,971 and it's now sitting at 78,150, closer to the 76,326 weekly low than to the top.
HYPE did the opposite. It ripped from the 80s to a weekly high of 97.74 on Oct 29, then gave back part of it and is now holding around 88.20. Even after that pullback, it's the only line on the chart above zero.
The detail I find most useful: on hourly returns over the past week, HYPE's correlation with BTC was just 0.42. ETH sat at 0.90, SOL at 0.89, XRP at 0.86. In plain words, most of the board is moving as one trade on BTC, while HYPE has been trading its own story. That cuts both ways: it didn't follow the dump, but it won't necessarily follow a recovery either.
The 30-day view is harsher
Zoom out and the picture gets worse for the alts. Over 30 daily candles: BTC -7.5%, BNB -7.4%, ETH -14.9%, XRP -15.8%, SOL -20.1%. Two outliers again: STRK is roughly flat (+0.9%) and HYPE -1.0%. ETH/BTC barely moved on the week (0.0292 to 0.0290), so there is no rotation signal into ETH yet.
The weekend is quiet, maybe too quiet
Volume in the last 24h is thin everywhere: BTC traded about 0.42x its average daily volume of the week, ETH 0.36x, SOL 0.32x, XRP 0.30x. Ranges are tight too: BTC's 24h range is 77,450 to 78,285, barely 1%. Low-volume weekends after a sharp drop often resolve with a bigger move once Monday liquidity shows up. Direction is the open question.
What I'm watching this week
1. BTC: 76,326 (weekly low) below, 81,343 to 81,971 (pre-dump close and weekly high) above. A daily close outside that box probably sets the tone for the whole board, given how tightly everything is correlated.
2. SOL: the weakest major on both 7d and 30d. The weekly low of 92.34 is less than 3% away from today's 94.77. If it breaks, the laggard may keep lagging.
3. HYPE: 97.74 is the level that matters on the upside, the high-70s base (weekly low 74.99) on the downside. Hourly volatility here is roughly 2.7x BTC's, so position size should reflect that.
4. STRK: down 4.1% today on just $2.2M of 24h spot volume. Thin books mean sharp wicks both ways.
5. Macro: US midterm elections fall on Tuesday, Nov 3. Event weeks tend to bring headline-driven volatility, so I'd expect the weekend calm not to last.
Bottom line
The market is in a "prove it" week. BTC has to defend the 76k area, and most alts are just leveraged versions of whatever BTC does. HYPE is the exception worth studying, not because it's guaranteed to keep going (it isn't), but because it shows what decorrelated strength looks like when everything else is red.
Which side of the BTC box breaks first, 76k or 82k?
Not financial advice.
#WeeklyOutlook #CryptoMarket #Hyperliquid
Six coins bled this week. One climbed 13.8%: the November outlook
Six of the seven majors I track closed the week in the red. The seventh, $HYPE , is up 13.8% over the same 168 hours. If you only watched the big caps this week, you missed the most interesting chart on the board.
Here's the weekly outlook going into November, built only on Binance spot data pulled today (Nov 1, ~17:00 UTC).
The scoreboard (7 days)
HYPE +13.8%
BTC -3.3%
ETH -3.7%
BNB -4.3%
XRP -4.4%
STRK -5.0%
SOL -7.1%
What actually happened
The whole week turned on one day. On Oct 29 the market got hit hard: on daily closes $BTC went from 81,343 to 77,992 (-4.1%), BNB dropped from 759.85 to 698.46 (-8.1%), SOL from 102.44 to 95.64 (-6.6%). Since then nothing has reclaimed those levels. BTC's 7-day high is 81,971 and it's now sitting at 78,150, closer to the 76,326 weekly low than to the top.
HYPE did the opposite. It ripped from the 80s to a weekly high of 97.74 on Oct 29, then gave back part of it and is now holding around 88.20. Even after that pullback, it's the only line on the chart above zero.
The detail I find most useful: on hourly returns over the past week, HYPE's correlation with BTC was just 0.42. ETH sat at 0.90, SOL at 0.89, XRP at 0.86. In plain words, most of the board is moving as one trade on BTC, while HYPE has been trading its own story. That cuts both ways: it didn't follow the dump, but it won't necessarily follow a recovery either.
The 30-day view is harsher
Zoom out and the picture gets worse for the alts. Over 30 daily candles: BTC -7.5%, BNB -7.4%, ETH -14.9%, XRP -15.8%, SOL -20.1%. Two outliers again: STRK is roughly flat (+0.9%) and HYPE -1.0%. ETH/BTC barely moved on the week (0.0292 to 0.0290), so there is no rotation signal into ETH yet.
The weekend is quiet, maybe too quiet
Volume in the last 24h is thin everywhere: BTC traded about 0.42x its average daily volume of the week, ETH 0.36x, SOL 0.32x, XRP 0.30x. Ranges are tight too: BTC's 24h range is 77,450 to 78,285, barely 1%. Low-volume weekends after a sharp drop often resolve with a bigger move once Monday liquidity shows up. Direction is the open question.
What I'm watching this week
1. BTC: 76,326 (weekly low) below, 81,343 to 81,971 (pre-dump close and weekly high) above. A daily close outside that box probably sets the tone for the whole board, given how tightly everything is correlated.
2. SOL: the weakest major on both 7d and 30d. The weekly low of 92.34 is less than 3% away from today's 94.77. If it breaks, the laggard may keep lagging.
3. HYPE: 97.74 is the level that matters on the upside, the high-70s base (weekly low 74.99) on the downside. Hourly volatility here is roughly 2.7x BTC's, so position size should reflect that.
4. STRK: down 4.1% today on just $2.2M of 24h spot volume. Thin books mean sharp wicks both ways.
5. Macro: US midterm elections fall on Tuesday, Nov 3. Event weeks tend to bring headline-driven volatility, so I'd expect the weekend calm not to last.
Bottom line
The market is in a "prove it" week. BTC has to defend the 76k area, and most alts are just leveraged versions of whatever BTC does. HYPE is the exception worth studying, not because it's guaranteed to keep going (it isn't), but because it shows what decorrelated strength looks like when everything else is red.
Which side of the BTC box breaks first, 76k or 82k?
Not financial advice.
#WeeklyOutlook #CryptoMarket #Hyperliquid
Here's the weekly outlook going into November, built only on Binance spot data pulled today (Nov 1, ~17:00 UTC).
The scoreboard (7 days)
HYPE +13.8%
BTC -3.3%
ETH -3.7%
BNB -4.3%
XRP -4.4%
STRK -5.0%
SOL -7.1%
What actually happened
The whole week turned on one day. On Oct 29 the market got hit hard: on daily closes $BTC went from 81,343 to 77,992 (-4.1%), BNB dropped from 759.85 to 698.46 (-8.1%), SOL from 102.44 to 95.64 (-6.6%). Since then nothing has reclaimed those levels. BTC's 7-day high is 81,971 and it's now sitting at 78,150, closer to the 76,326 weekly low than to the top.
HYPE did the opposite. It ripped from the 80s to a weekly high of 97.74 on Oct 29, then gave back part of it and is now holding around 88.20. Even after that pullback, it's the only line on the chart above zero.
The detail I find most useful: on hourly returns over the past week, HYPE's correlation with BTC was just 0.42. ETH sat at 0.90, SOL at 0.89, XRP at 0.86. In plain words, most of the board is moving as one trade on BTC, while HYPE has been trading its own story. That cuts both ways: it didn't follow the dump, but it won't necessarily follow a recovery either.
The 30-day view is harsher
Zoom out and the picture gets worse for the alts. Over 30 daily candles: BTC -7.5%, BNB -7.4%, ETH -14.9%, XRP -15.8%, SOL -20.1%. Two outliers again: STRK is roughly flat (+0.9%) and HYPE -1.0%. ETH/BTC barely moved on the week (0.0292 to 0.0290), so there is no rotation signal into ETH yet.
The weekend is quiet, maybe too quiet
Volume in the last 24h is thin everywhere: BTC traded about 0.42x its average daily volume of the week, ETH 0.36x, SOL 0.32x, XRP 0.30x. Ranges are tight too: BTC's 24h range is 77,450 to 78,285, barely 1%. Low-volume weekends after a sharp drop often resolve with a bigger move once Monday liquidity shows up. Direction is the open question.
What I'm watching this week
1. BTC: 76,326 (weekly low) below, 81,343 to 81,971 (pre-dump close and weekly high) above. A daily close outside that box probably sets the tone for the whole board, given how tightly everything is correlated.
2. SOL: the weakest major on both 7d and 30d. The weekly low of 92.34 is less than 3% away from today's 94.77. If it breaks, the laggard may keep lagging.
3. HYPE: 97.74 is the level that matters on the upside, the high-70s base (weekly low 74.99) on the downside. Hourly volatility here is roughly 2.7x BTC's, so position size should reflect that.
4. STRK: down 4.1% today on just $2.2M of 24h spot volume. Thin books mean sharp wicks both ways.
5. Macro: US midterm elections fall on Tuesday, Nov 3. Event weeks tend to bring headline-driven volatility, so I'd expect the weekend calm not to last.
Bottom line
The market is in a "prove it" week. BTC has to defend the 76k area, and most alts are just leveraged versions of whatever BTC does. HYPE is the exception worth studying, not because it's guaranteed to keep going (it isn't), but because it shows what decorrelated strength looks like when everything else is red.
Which side of the BTC box breaks first, 76k or 82k?
Not financial advice.
#WeeklyOutlook #CryptoMarket #Hyperliquid
6

·
--
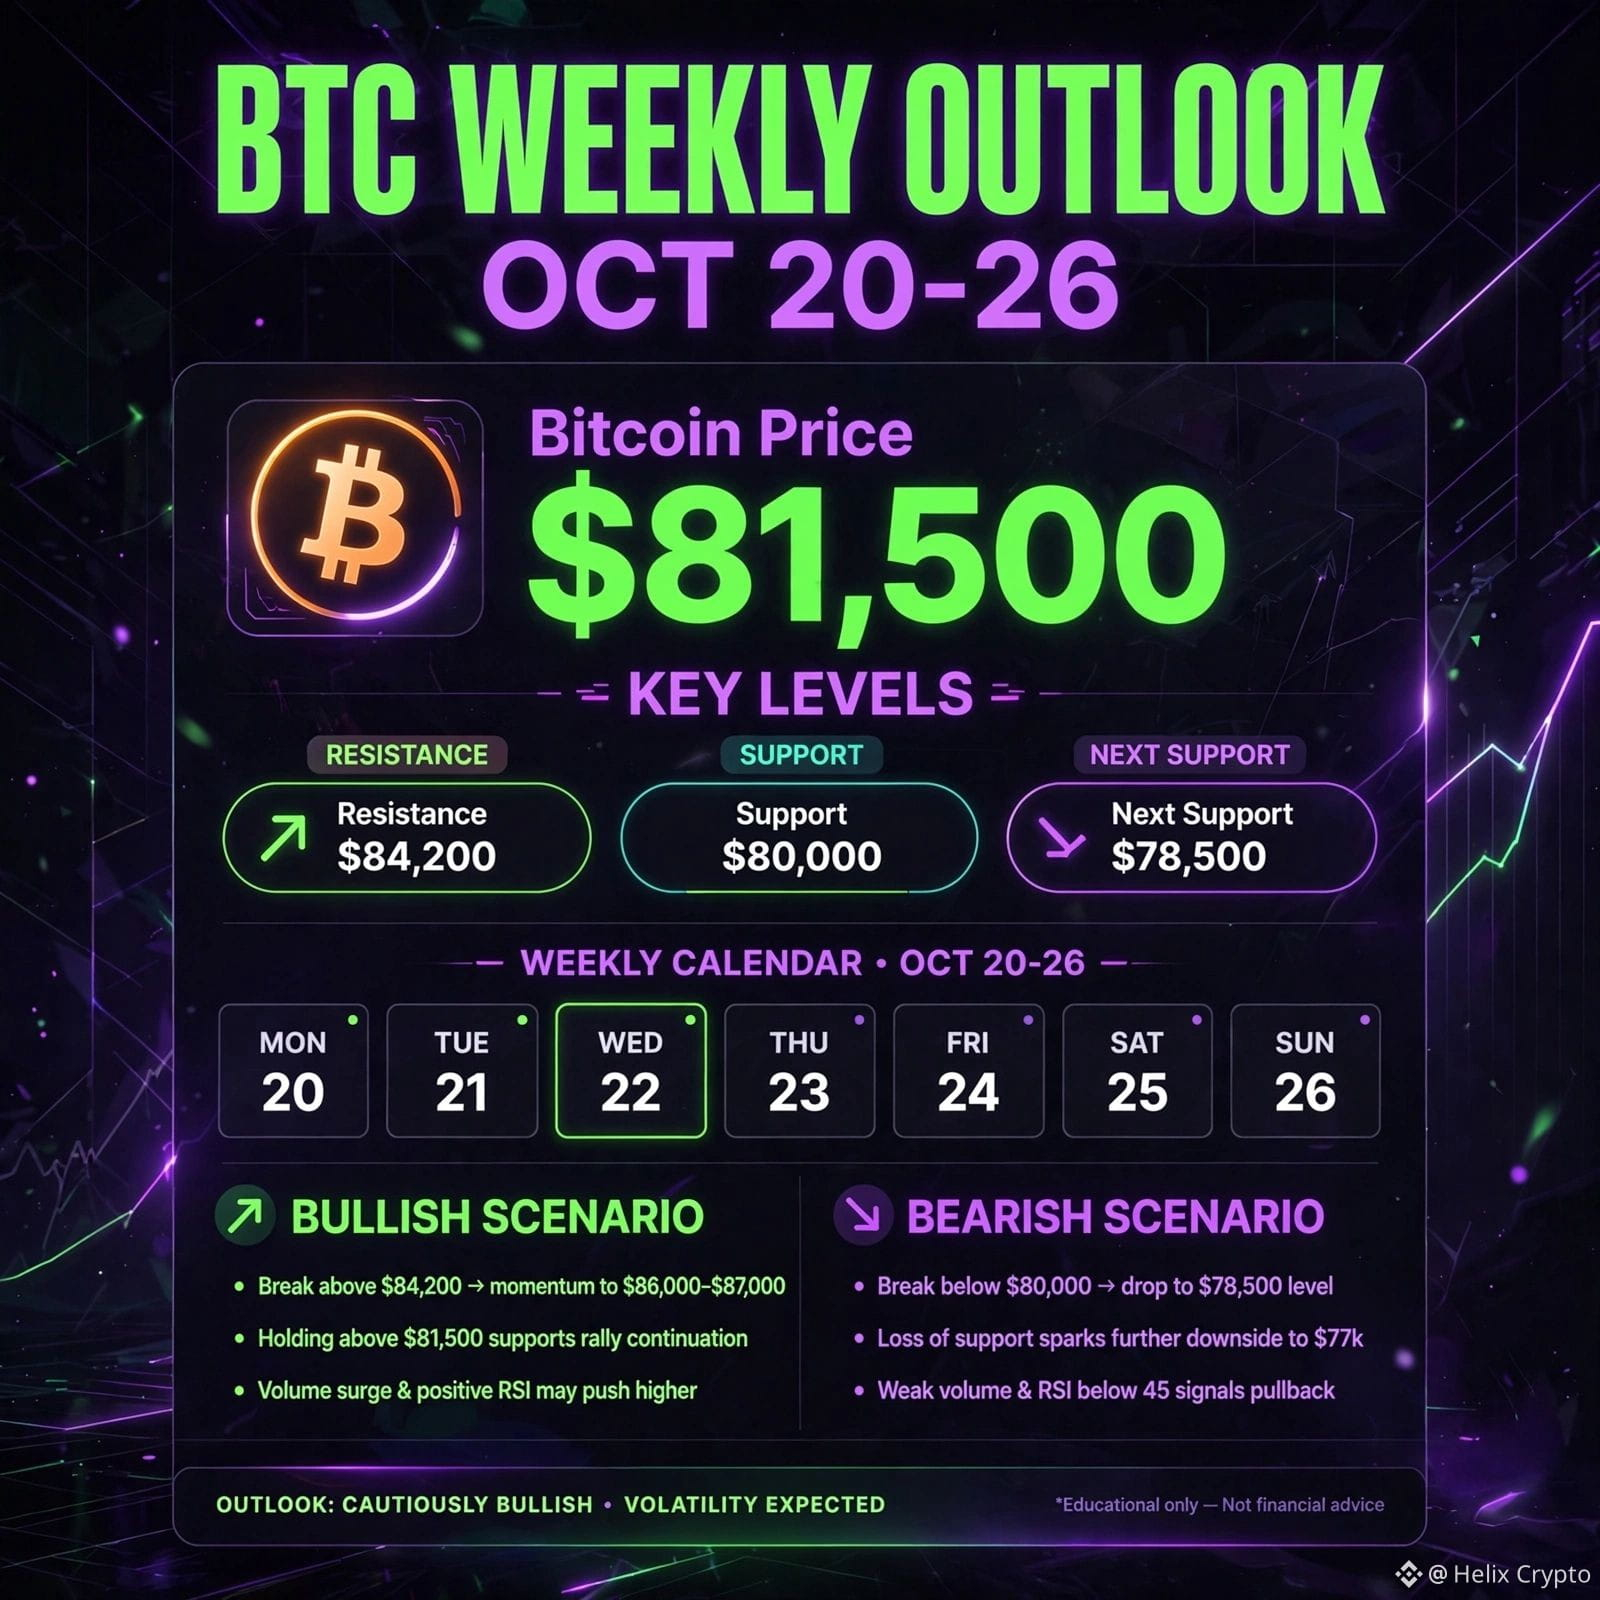
$BTC $ETH BTC-WOCHENAUSBLICK – 20.–26. Okt. 📊
Bitcoin hält sich über 80.000 $. Diese Woche wird die nächste große Bewegung entscheiden.
📍 WICHTIGE KURSE:
Widerstand: 84.200 $
Unterstützung: 80.000 $
Nächste Unterstützung: 78.500 $
🟢 BULLISCHES SZENARIO:
Anstieg über 84.200 $ = Aufwärtsdynamik bis 86.000–87.000 $
Ein Halten über 81.500 $ unterstützt die Fortsetzung der Rally
🔴 BÄRISCHES SZENARIO:
Fall unter 80.000 $ = Rückgang auf 78.500 $
Ein Verlust der Unterstützung könnte den Kurs auf 77.000 $ drücken
✅ Meine Einschätzung: Vorsichtig bullisch
- Keine FOMO-Käufe in der Mitte
- In Unterstützungsnähe kaufen, in Widerstandsnähe Gewinne mitnehmen
- Vor dem FOMC am 28. Okt. das Risiko niedrig halten
Wie ist eure Einschätzung für diese Woche? Bullisch oder bärisch? Kommentiert 👇
#BTC #bitcoin #WeeklyOutlook #cryptotrading
{spot}(ETHUSDT)
$BTC $ETH BTC-WOCHENAUSBLICK – 20.–26. Okt. 📊
Bitcoin hält sich über 80.000 $. Diese Woche wird die nächste große Bewegung entscheiden.
📍 WICHTIGE KURSE:
Widerstand: 84.200 $
Unterstützung: 80.000 $
Nächste Unterstützung: 78.500 $
🟢 BULLISCHES SZENARIO:
Anstieg über 84.200 $ = Aufwärtsdynamik bis 86.000–87.000 $
Ein Halten über 81.500 $ unterstützt die Fortsetzung der Rally
🔴 BÄRISCHES SZENARIO:
Fall unter 80.000 $ = Rückgang auf 78.500 $
Ein Verlust der Unterstützung könnte den Kurs auf 77.000 $ drücken
✅ Meine Einschätzung: Vorsichtig bullisch
- Keine FOMO-Käufe in der Mitte
- In Unterstützungsnähe kaufen, in Widerstandsnähe Gewinne mitnehmen
- Vor dem FOMC am 28. Okt. das Risiko niedrig halten
Wie ist eure Einschätzung für diese Woche? Bullisch oder bärisch? Kommentiert 👇
#BTC #bitcoin #WeeklyOutlook #cryptotrading
Bitcoin hält sich über 80.000 $. Diese Woche wird die nächste große Bewegung entscheiden.
📍 WICHTIGE KURSE:
Widerstand: 84.200 $
Unterstützung: 80.000 $
Nächste Unterstützung: 78.500 $
🟢 BULLISCHES SZENARIO:
Anstieg über 84.200 $ = Aufwärtsdynamik bis 86.000–87.000 $
Ein Halten über 81.500 $ unterstützt die Fortsetzung der Rally
🔴 BÄRISCHES SZENARIO:
Fall unter 80.000 $ = Rückgang auf 78.500 $
Ein Verlust der Unterstützung könnte den Kurs auf 77.000 $ drücken
✅ Meine Einschätzung: Vorsichtig bullisch
- Keine FOMO-Käufe in der Mitte
- In Unterstützungsnähe kaufen, in Widerstandsnähe Gewinne mitnehmen
- Vor dem FOMC am 28. Okt. das Risiko niedrig halten
Wie ist eure Einschätzung für diese Woche? Bullisch oder bärisch? Kommentiert 👇
#BTC #bitcoin #WeeklyOutlook #cryptotrading
76

$BTC — Tot oder Lebendig? Die Woche voraus 👀📊
Bitcoin steht gerade an einem kritischen Entscheidungspunkt. Diese Woche könnte die nächste große Richtung bestimmen.
Die große Frage:
📈 Springt BTC auf $90,000?
📉 Oder fällt BTC auf $70,000?
Beide Szenarien sind möglich. Hier ist, was die Daten sagen.
Bullisches Szenario — $90,000:
✅ Wichtige Unterstützungslevels halten bisher
✅ Signale für Walfang-Akkumulation erscheinen
✅ ETF-Zuflüsse bleiben positiv
✅ Angst- und Gier-Index bei extremer Angst = historisch bullish
🎯 Ausbruch über $82,800 = bullische Struktur bestätigt
Bärisches Szenario — $70,000:
⚠️ Makro-Ungewissheit mit neuem Fed-Vorsitzenden
⚠️ Zinserhöhungswahrscheinlichkeit über 70% bis zum Jahresende
⚠️ Verbraucherstimmung auf Allzeittief
⚠️ Bärische Struktur bleibt auf dem Tageschart intakt
🔴 Verlieren der Unterstützung bei $74,000 = Zone um $70,000 öffnet sich
Wichtige Levels diese Woche:
🟢 Muss halten: $74,000 — $75,000
🔴 Widerstand: $78,500 — $81,000
✅ Bullische Bestätigung: sauberer Ausbruch über $82,800
📉 Bärische Bestätigung: täglicher Schlusskurs unter $74,000
Die ehrliche Wahrheit:
Niemand weiß, in welche Richtung BTC diese Woche geht. Aber die beiden Szenarien zu verstehen und einen Plan für jedes zu haben, trennt die vorbereiteten Trader von den reaktiven. 🧠
Beobachte die Eröffnung am Montag genau. 👀
DYOR — Keine Finanzberatung! 🙏
#Bitcoin #BTC #CryptoAnalysis #WeeklyOutlook #dyor
$BTC — Tot oder Lebendig? Die Woche voraus 👀📊
Bitcoin steht gerade an einem kritischen Entscheidungspunkt. Diese Woche könnte die nächste große Richtung bestimmen.
Die große Frage:
📈 Springt BTC auf $90,000?
📉 Oder fällt BTC auf $70,000?
Beide Szenarien sind möglich. Hier ist, was die Daten sagen.
Bullisches Szenario — $90,000:
✅ Wichtige Unterstützungslevels halten bisher
✅ Signale für Walfang-Akkumulation erscheinen
✅ ETF-Zuflüsse bleiben positiv
✅ Angst- und Gier-Index bei extremer Angst = historisch bullish
🎯 Ausbruch über $82,800 = bullische Struktur bestätigt
Bärisches Szenario — $70,000:
⚠️ Makro-Ungewissheit mit neuem Fed-Vorsitzenden
⚠️ Zinserhöhungswahrscheinlichkeit über 70% bis zum Jahresende
⚠️ Verbraucherstimmung auf Allzeittief
⚠️ Bärische Struktur bleibt auf dem Tageschart intakt
🔴 Verlieren der Unterstützung bei $74,000 = Zone um $70,000 öffnet sich
Wichtige Levels diese Woche:
🟢 Muss halten: $74,000 — $75,000
🔴 Widerstand: $78,500 — $81,000
✅ Bullische Bestätigung: sauberer Ausbruch über $82,800
📉 Bärische Bestätigung: täglicher Schlusskurs unter $74,000
Die ehrliche Wahrheit:
Niemand weiß, in welche Richtung BTC diese Woche geht. Aber die beiden Szenarien zu verstehen und einen Plan für jedes zu haben, trennt die vorbereiteten Trader von den reaktiven. 🧠
Beobachte die Eröffnung am Montag genau. 👀
DYOR — Keine Finanzberatung! 🙏
#Bitcoin #BTC #CryptoAnalysis #WeeklyOutlook #dyor
Bitcoin steht gerade an einem kritischen Entscheidungspunkt. Diese Woche könnte die nächste große Richtung bestimmen.
Die große Frage:
📈 Springt BTC auf $90,000?
📉 Oder fällt BTC auf $70,000?
Beide Szenarien sind möglich. Hier ist, was die Daten sagen.
Bullisches Szenario — $90,000:
✅ Wichtige Unterstützungslevels halten bisher
✅ Signale für Walfang-Akkumulation erscheinen
✅ ETF-Zuflüsse bleiben positiv
✅ Angst- und Gier-Index bei extremer Angst = historisch bullish
🎯 Ausbruch über $82,800 = bullische Struktur bestätigt
Bärisches Szenario — $70,000:
⚠️ Makro-Ungewissheit mit neuem Fed-Vorsitzenden
⚠️ Zinserhöhungswahrscheinlichkeit über 70% bis zum Jahresende
⚠️ Verbraucherstimmung auf Allzeittief
⚠️ Bärische Struktur bleibt auf dem Tageschart intakt
🔴 Verlieren der Unterstützung bei $74,000 = Zone um $70,000 öffnet sich
Wichtige Levels diese Woche:
🟢 Muss halten: $74,000 — $75,000
🔴 Widerstand: $78,500 — $81,000
✅ Bullische Bestätigung: sauberer Ausbruch über $82,800
📉 Bärische Bestätigung: täglicher Schlusskurs unter $74,000
Die ehrliche Wahrheit:
Niemand weiß, in welche Richtung BTC diese Woche geht. Aber die beiden Szenarien zu verstehen und einen Plan für jedes zu haben, trennt die vorbereiteten Trader von den reaktiven. 🧠
Beobachte die Eröffnung am Montag genau. 👀
DYOR — Keine Finanzberatung! 🙏
#Bitcoin #BTC #CryptoAnalysis #WeeklyOutlook #dyor

35

Strittig
Eine weitere wöchentliche Kerze steht kurz vor dem Schluss… und es ist Zeit, das Markt-Sentiment zu checken 👀
Wenn wir uns das wöchentliche Chart anschauen, hält Bitcoin immer noch über dem MA20 — ein positives Zeichen für das große Ganze. 📈
Allerdings, wenn wir uns die EMAs ansehen, könnte die nächste große Unterstützungszone bei etwa $69K liegen.
Bisher verteidigen die Bullen noch die Struktur, aber die Volatilität nimmt zu, je näher der wöchentliche Schluss kommt.
Jetzt ist die echte Frage:
Glaubst du, dass die nächste Woche grün oder rot wird? 🟢🔴
$BTC
{spot}(BTCUSDT)
$BNB
{spot}(BNBUSDT)
$GENIUS
{spot}(GENIUSUSDT)
#btc #weeklyoutlook #BitcoinRisesOnIranPeaceDeal
Eine weitere wöchentliche Kerze steht kurz vor dem Schluss… und es ist Zeit, das Markt-Sentiment zu checken 👀
Wenn wir uns das wöchentliche Chart anschauen, hält Bitcoin immer noch über dem MA20 — ein positives Zeichen für das große Ganze. 📈
Allerdings, wenn wir uns die EMAs ansehen, könnte die nächste große Unterstützungszone bei etwa $69K liegen.
Bisher verteidigen die Bullen noch die Struktur, aber die Volatilität nimmt zu, je näher der wöchentliche Schluss kommt.
Jetzt ist die echte Frage:
Glaubst du, dass die nächste Woche grün oder rot wird? 🟢🔴
$BTC
$BNB
$GENIUS
#btc #weeklyoutlook #BitcoinRisesOnIranPeaceDeal
Wenn wir uns das wöchentliche Chart anschauen, hält Bitcoin immer noch über dem MA20 — ein positives Zeichen für das große Ganze. 📈
Allerdings, wenn wir uns die EMAs ansehen, könnte die nächste große Unterstützungszone bei etwa $69K liegen.
Bisher verteidigen die Bullen noch die Struktur, aber die Volatilität nimmt zu, je näher der wöchentliche Schluss kommt.
Jetzt ist die echte Frage:
Glaubst du, dass die nächste Woche grün oder rot wird? 🟢🔴
$BTC
$BNB
$GENIUS
#btc #weeklyoutlook #BitcoinRisesOnIranPeaceDeal
Green Week 🟩
62%
Red Week 🟥
38%
52 Stimmen • Abstimmung beendet
1
1
1.3k

$BTC hat die Woche über $105.000 abgeschlossen – und der Markt ist noch nicht fertig.
Die meisten Leute haben diese Woche die Candlesticks beobachtet.
Die smarten Trader haben die Struktur im Blick behalten.
Hier ist, was diese Woche tatsächlich passiert ist:
📊 Bitcoin hat seine wichtige Unterstützungszone um $100K nach einem kurzen Rücksetzer Mitte der Woche gehalten.
📊 Käufer sind schnell eingestiegen – das zeigt, dass die Nachfrage auf diesen Niveaus nach wie vor stark ist.
📊 $ETH folgte mit relativer Stärke und konsolidierte über seiner eigenen wichtigen Unterstützung.
Was du nächste Woche beobachten solltest 👇
Wenn $BTC über $107K zurückerobert und hält – wird das nächste Ziel eröffnet. Wenn es nicht höher ausbricht – erwarte einen weiteren Test der $100K Unterstützung. Der makroökonomische Kalender ist leicht, was bedeutet, dass die Preisbewegungen von crypto-nativen Flüssen getrieben werden.
Der Trend ist immer noch bullish. Die Volatilität ist niedrig, was normalerweise bedeutet, dass eine große Bewegung im Aufbau ist. Richtung? Das hängt vom Wochenabschluss ab.
Bleib geduldig. Trade die Level, nicht die Emotionen.
Wie ist deine $BTC Prognose diese Woche – nach oben, nach unten oder seitwärts? Lass es uns unten wissen 👇
#BTC #CryptoAnalysis #WeeklyOutlook #BinanceSquare
$BTC hat die Woche über $105.000 abgeschlossen – und der Markt ist noch nicht fertig.
Die meisten Leute haben diese Woche die Candlesticks beobachtet.
Die smarten Trader haben die Struktur im Blick behalten.
Hier ist, was diese Woche tatsächlich passiert ist:
📊 Bitcoin hat seine wichtige Unterstützungszone um $100K nach einem kurzen Rücksetzer Mitte der Woche gehalten.
📊 Käufer sind schnell eingestiegen – das zeigt, dass die Nachfrage auf diesen Niveaus nach wie vor stark ist.
📊 $ETH folgte mit relativer Stärke und konsolidierte über seiner eigenen wichtigen Unterstützung.
Was du nächste Woche beobachten solltest 👇
Wenn $BTC über $107K zurückerobert und hält – wird das nächste Ziel eröffnet. Wenn es nicht höher ausbricht – erwarte einen weiteren Test der $100K Unterstützung. Der makroökonomische Kalender ist leicht, was bedeutet, dass die Preisbewegungen von crypto-nativen Flüssen getrieben werden.
Der Trend ist immer noch bullish. Die Volatilität ist niedrig, was normalerweise bedeutet, dass eine große Bewegung im Aufbau ist. Richtung? Das hängt vom Wochenabschluss ab.
Bleib geduldig. Trade die Level, nicht die Emotionen.
Wie ist deine $BTC Prognose diese Woche – nach oben, nach unten oder seitwärts? Lass es uns unten wissen 👇
#BTC #CryptoAnalysis #WeeklyOutlook #BinanceSquare
Die meisten Leute haben diese Woche die Candlesticks beobachtet.
Die smarten Trader haben die Struktur im Blick behalten.
Hier ist, was diese Woche tatsächlich passiert ist:
📊 Bitcoin hat seine wichtige Unterstützungszone um $100K nach einem kurzen Rücksetzer Mitte der Woche gehalten.
📊 Käufer sind schnell eingestiegen – das zeigt, dass die Nachfrage auf diesen Niveaus nach wie vor stark ist.
📊 $ETH folgte mit relativer Stärke und konsolidierte über seiner eigenen wichtigen Unterstützung.
Was du nächste Woche beobachten solltest 👇
Wenn $BTC über $107K zurückerobert und hält – wird das nächste Ziel eröffnet. Wenn es nicht höher ausbricht – erwarte einen weiteren Test der $100K Unterstützung. Der makroökonomische Kalender ist leicht, was bedeutet, dass die Preisbewegungen von crypto-nativen Flüssen getrieben werden.
Der Trend ist immer noch bullish. Die Volatilität ist niedrig, was normalerweise bedeutet, dass eine große Bewegung im Aufbau ist. Richtung? Das hängt vom Wochenabschluss ab.
Bleib geduldig. Trade die Level, nicht die Emotionen.
Wie ist deine $BTC Prognose diese Woche – nach oben, nach unten oder seitwärts? Lass es uns unten wissen 👇
#BTC #CryptoAnalysis #WeeklyOutlook #BinanceSquare
110

·
--
📊 Wöchentlicher Rückblick auf den Krypto-Markt + Ausblick auf die nächste Woche 🚀
Der Kryptomarkt beendete die Woche mit gemischtem Momentum. Bitcoin hielt weiterhin wichtige Unterstützungsniveaus, während Ethereum trotz kurzfristiger Volatilität Widerstandsfähigkeit zeigte. Mehrere Altcoins schnitten besser ab als der breitere Markt – ein Zeichen dafür, dass Anleger Kapital selektiv in Projekte mit hohem Potenzial umlenken, statt jedem Rallye hinterherzulaufen.
🔍 Highlights dieser Woche
✅ Bitcoin blieb relativ stabil über den wichtigen Unterstützungszonen.
✅ Ethereum hielt die bullische Struktur.
✅ KI- und DeFi-Token zogen wieder verstärkt Aufmerksamkeit auf sich.
✅ Die Marktstimmung verbesserte sich, als die Kaufkraft zunahm.
👀 Worauf du nächste Woche achten solltest
🔸 Bitcoins Reaktion rund um wichtige Widerstandsniveaus.
🔸 Ethiereums Fähigkeit, den Aufwärtstrend aufrechtzuerhalten.
🔸 Makroökonomische Nachrichten und Updates zur Liquidität. 🔸 Mögliche Ausbruchschancen bei hochwertigen Altcoins.
📌 Hinweis: Märkte belohnen Disziplin, nicht Emotionen. Bleib bei deinem Trading-Plan, steuere das Risiko und vermeide FOMO bei plötzlichen Kursbewegungen.
💬 Was erwartest du nächste Woche? Bullisch 📈 oder bärisch 📉? Teile deine Gedanken unten!
#Bitcoin #MarketRecap #WeeklyOutlook #Investing #trending
📊 Wöchentlicher Rückblick auf den Krypto-Markt + Ausblick auf die nächste Woche 🚀
Der Kryptomarkt beendete die Woche mit gemischtem Momentum. Bitcoin hielt weiterhin wichtige Unterstützungsniveaus, während Ethereum trotz kurzfristiger Volatilität Widerstandsfähigkeit zeigte. Mehrere Altcoins schnitten besser ab als der breitere Markt – ein Zeichen dafür, dass Anleger Kapital selektiv in Projekte mit hohem Potenzial umlenken, statt jedem Rallye hinterherzulaufen.
🔍 Highlights dieser Woche
✅ Bitcoin blieb relativ stabil über den wichtigen Unterstützungszonen.
✅ Ethereum hielt die bullische Struktur.
✅ KI- und DeFi-Token zogen wieder verstärkt Aufmerksamkeit auf sich.
✅ Die Marktstimmung verbesserte sich, als die Kaufkraft zunahm.
👀 Worauf du nächste Woche achten solltest
🔸 Bitcoins Reaktion rund um wichtige Widerstandsniveaus.
🔸 Ethiereums Fähigkeit, den Aufwärtstrend aufrechtzuerhalten.
🔸 Makroökonomische Nachrichten und Updates zur Liquidität. 🔸 Mögliche Ausbruchschancen bei hochwertigen Altcoins.
📌 Hinweis: Märkte belohnen Disziplin, nicht Emotionen. Bleib bei deinem Trading-Plan, steuere das Risiko und vermeide FOMO bei plötzlichen Kursbewegungen.
💬 Was erwartest du nächste Woche? Bullisch 📈 oder bärisch 📉? Teile deine Gedanken unten!
#Bitcoin #MarketRecap #WeeklyOutlook #Investing #trending
Der Kryptomarkt beendete die Woche mit gemischtem Momentum. Bitcoin hielt weiterhin wichtige Unterstützungsniveaus, während Ethereum trotz kurzfristiger Volatilität Widerstandsfähigkeit zeigte. Mehrere Altcoins schnitten besser ab als der breitere Markt – ein Zeichen dafür, dass Anleger Kapital selektiv in Projekte mit hohem Potenzial umlenken, statt jedem Rallye hinterherzulaufen.
🔍 Highlights dieser Woche
✅ Bitcoin blieb relativ stabil über den wichtigen Unterstützungszonen.
✅ Ethereum hielt die bullische Struktur.
✅ KI- und DeFi-Token zogen wieder verstärkt Aufmerksamkeit auf sich.
✅ Die Marktstimmung verbesserte sich, als die Kaufkraft zunahm.
👀 Worauf du nächste Woche achten solltest
🔸 Bitcoins Reaktion rund um wichtige Widerstandsniveaus.
🔸 Ethiereums Fähigkeit, den Aufwärtstrend aufrechtzuerhalten.
🔸 Makroökonomische Nachrichten und Updates zur Liquidität. 🔸 Mögliche Ausbruchschancen bei hochwertigen Altcoins.
📌 Hinweis: Märkte belohnen Disziplin, nicht Emotionen. Bleib bei deinem Trading-Plan, steuere das Risiko und vermeide FOMO bei plötzlichen Kursbewegungen.
💬 Was erwartest du nächste Woche? Bullisch 📈 oder bärisch 📉? Teile deine Gedanken unten!
#Bitcoin #MarketRecap #WeeklyOutlook #Investing #trending
1
73

·
--
📅 SCHLÜSSEL-NIVEAUS, DIE DIESER WOCHE ZU BEOBACHTEN SIND 📅
Check-in am Montagabend! Das zählt diese Woche:
🔴 BTC - 62 904$
━━━━━━━━━━━━━━━━━
📈 Bullisch über : 63 500$
📉 Bärisch unter : 62 000$
🎯 Wochenziel : 65 000$
⚠️ Wöchentlicher Support : 60 000$
💡 STRATEGIE : Rücksetzer bei 62K kaufen, Anstiege bei 65K verkaufen
━━━━━━━━━━━━━━━━━
━━━━━━━━━━━━━━━━━
🔥 3 COINS, DIE DIESER WOCHE ZU BEOBACHTEN SIND :
1️⃣ $BNB - 581$
→ Ausbruch über 585 = Rally Richtung 600$
→ Solide Fundamentaldaten, regelmäßiges Pumpen
2️⃣ $SOL - 80$
→ Support bei 78$ hält
→ Ausbruch über 82 = Rückkehr zu 88$
3️⃣ $ETH - 1 767$
→ Konsolidierung läuft gut
→ Ausbruch über 1 800 = 1 900 in Sicht
━━━━━━━━━━━━━━━━━
⚠️ RISIKEN DIESER WOCHE :
- US-Wirtschaftsdaten am Mittwoch
- Volatilität von BTC rund um 63K
- Kein FOMO bei den Pumps
✅ MEIN WOCHENPLAN :
- Long-Scalps auf Rücksetzern
- Gewinne an Widerstand mitnehmen
- SL eng halten (5%)
📌 Speichere diesen Post für die Woche!
WAS IST DEIN GRÖSSTER TRADE DIESE WOCHE? Antworte in den Kommentaren! 👇
#bitcoin.” #CryptoTrends2024 #WeeklyOutlook
📅 SCHLÜSSEL-NIVEAUS, DIE DIESER WOCHE ZU BEOBACHTEN SIND 📅
Check-in am Montagabend! Das zählt diese Woche:
🔴 BTC - 62 904$
━━━━━━━━━━━━━━━━━
📈 Bullisch über : 63 500$
📉 Bärisch unter : 62 000$
🎯 Wochenziel : 65 000$
⚠️ Wöchentlicher Support : 60 000$
💡 STRATEGIE : Rücksetzer bei 62K kaufen, Anstiege bei 65K verkaufen
━━━━━━━━━━━━━━━━━
━━━━━━━━━━━━━━━━━
🔥 3 COINS, DIE DIESER WOCHE ZU BEOBACHTEN SIND :
1️⃣ $BNB - 581$
→ Ausbruch über 585 = Rally Richtung 600$
→ Solide Fundamentaldaten, regelmäßiges Pumpen
2️⃣ $SOL - 80$
→ Support bei 78$ hält
→ Ausbruch über 82 = Rückkehr zu 88$
3️⃣ $ETH - 1 767$
→ Konsolidierung läuft gut
→ Ausbruch über 1 800 = 1 900 in Sicht
━━━━━━━━━━━━━━━━━
⚠️ RISIKEN DIESER WOCHE :
- US-Wirtschaftsdaten am Mittwoch
- Volatilität von BTC rund um 63K
- Kein FOMO bei den Pumps
✅ MEIN WOCHENPLAN :
- Long-Scalps auf Rücksetzern
- Gewinne an Widerstand mitnehmen
- SL eng halten (5%)
📌 Speichere diesen Post für die Woche!
WAS IST DEIN GRÖSSTER TRADE DIESE WOCHE? Antworte in den Kommentaren! 👇
#bitcoin.” #CryptoTrends2024 #WeeklyOutlook
Check-in am Montagabend! Das zählt diese Woche:
🔴 BTC - 62 904$
━━━━━━━━━━━━━━━━━
📈 Bullisch über : 63 500$
📉 Bärisch unter : 62 000$
🎯 Wochenziel : 65 000$
⚠️ Wöchentlicher Support : 60 000$
💡 STRATEGIE : Rücksetzer bei 62K kaufen, Anstiege bei 65K verkaufen
━━━━━━━━━━━━━━━━━
━━━━━━━━━━━━━━━━━
🔥 3 COINS, DIE DIESER WOCHE ZU BEOBACHTEN SIND :
1️⃣ $BNB - 581$
→ Ausbruch über 585 = Rally Richtung 600$
→ Solide Fundamentaldaten, regelmäßiges Pumpen
2️⃣ $SOL - 80$
→ Support bei 78$ hält
→ Ausbruch über 82 = Rückkehr zu 88$
3️⃣ $ETH - 1 767$
→ Konsolidierung läuft gut
→ Ausbruch über 1 800 = 1 900 in Sicht
━━━━━━━━━━━━━━━━━
⚠️ RISIKEN DIESER WOCHE :
- US-Wirtschaftsdaten am Mittwoch
- Volatilität von BTC rund um 63K
- Kein FOMO bei den Pumps
✅ MEIN WOCHENPLAN :
- Long-Scalps auf Rücksetzern
- Gewinne an Widerstand mitnehmen
- SL eng halten (5%)
📌 Speichere diesen Post für die Woche!
WAS IST DEIN GRÖSSTER TRADE DIESE WOCHE? Antworte in den Kommentaren! 👇
#bitcoin.” #CryptoTrends2024 #WeeklyOutlook

39

·
--
Bullisch
📅 WICHTIGE KEY-LEVELS DIESER WOCHE, DIE DU IM BLICK BEHALTEN SOLLTEST 📅
Montagabend-Check-in! Das ist diese Woche wichtig:
🔴 BTC - 62.904 $
━━━━━━━━━━━━━━━━━
📈 Bullisch über: 63.500 $
📉 Bärisch unter: 62.000 $
🎯 Wöchentliches Ziel: 65.000 $
⚠️ Wöchentliches Support-Level: 60.000 $
💡 STRATEGIE: Kaufe Rücksetzer auf 62K, verkaufe Rallys bis 65K
━━━━━━━━━━━━━━━━━
🔥 3 COINS, DIE DIESEN WOCHE IM FOKUS SIND:
1️⃣ $BNB - 581 $
→ Bricht über 585 aus = Rally bis 600
→ Starke Fundamentaldaten, gleichmäßiger Pump
2️⃣ $SOL - 80 $
→ Hält die Unterstützung bei 78 $
→ Bricht über 82 = Zurück zu 88
3️⃣ $ETH - 1.767 $
→ Stabilisiert sich schön
→ Bricht über 1.800 aus = 1.900 in Sicht
━━━━━━━━━━━━━━━━━
⚠️ DIE RISIKEN DIESER WOCHE:
- US-Wirtschaftsdaten am Mittwoch
- BTC-Volatilität rund um 63K
- Kein FOMO bei Pumps
✅ MEIN WOCHENPLAN:
- Scalp Longs bei Dips
- Gewinne an Widerstand mitnehmen
- SL eng halten (5%)
📌 Speichere diesen Post für die Woche!
Was ist DEIN größter Trade diese Woche? Schreib unten in die Kommentare! 👇
#Bitcoin #crypto #WeeklyOutlook #trading
📅 WICHTIGE KEY-LEVELS DIESER WOCHE, DIE DU IM BLICK BEHALTEN SOLLTEST 📅
Montagabend-Check-in! Das ist diese Woche wichtig:
🔴 BTC - 62.904 $
━━━━━━━━━━━━━━━━━
📈 Bullisch über: 63.500 $
📉 Bärisch unter: 62.000 $
🎯 Wöchentliches Ziel: 65.000 $
⚠️ Wöchentliches Support-Level: 60.000 $
💡 STRATEGIE: Kaufe Rücksetzer auf 62K, verkaufe Rallys bis 65K
━━━━━━━━━━━━━━━━━
🔥 3 COINS, DIE DIESEN WOCHE IM FOKUS SIND:
1️⃣ $BNB - 581 $
→ Bricht über 585 aus = Rally bis 600
→ Starke Fundamentaldaten, gleichmäßiger Pump
2️⃣ $SOL - 80 $
→ Hält die Unterstützung bei 78 $
→ Bricht über 82 = Zurück zu 88
3️⃣ $ETH - 1.767 $
→ Stabilisiert sich schön
→ Bricht über 1.800 aus = 1.900 in Sicht
━━━━━━━━━━━━━━━━━
⚠️ DIE RISIKEN DIESER WOCHE:
- US-Wirtschaftsdaten am Mittwoch
- BTC-Volatilität rund um 63K
- Kein FOMO bei Pumps
✅ MEIN WOCHENPLAN:
- Scalp Longs bei Dips
- Gewinne an Widerstand mitnehmen
- SL eng halten (5%)
📌 Speichere diesen Post für die Woche!
Was ist DEIN größter Trade diese Woche? Schreib unten in die Kommentare! 👇
#Bitcoin #crypto #WeeklyOutlook #trading
Montagabend-Check-in! Das ist diese Woche wichtig:
🔴 BTC - 62.904 $
━━━━━━━━━━━━━━━━━
📈 Bullisch über: 63.500 $
📉 Bärisch unter: 62.000 $
🎯 Wöchentliches Ziel: 65.000 $
⚠️ Wöchentliches Support-Level: 60.000 $
💡 STRATEGIE: Kaufe Rücksetzer auf 62K, verkaufe Rallys bis 65K
━━━━━━━━━━━━━━━━━
🔥 3 COINS, DIE DIESEN WOCHE IM FOKUS SIND:
1️⃣ $BNB - 581 $
→ Bricht über 585 aus = Rally bis 600
→ Starke Fundamentaldaten, gleichmäßiger Pump
2️⃣ $SOL - 80 $
→ Hält die Unterstützung bei 78 $
→ Bricht über 82 = Zurück zu 88
3️⃣ $ETH - 1.767 $
→ Stabilisiert sich schön
→ Bricht über 1.800 aus = 1.900 in Sicht
━━━━━━━━━━━━━━━━━
⚠️ DIE RISIKEN DIESER WOCHE:
- US-Wirtschaftsdaten am Mittwoch
- BTC-Volatilität rund um 63K
- Kein FOMO bei Pumps
✅ MEIN WOCHENPLAN:
- Scalp Longs bei Dips
- Gewinne an Widerstand mitnehmen
- SL eng halten (5%)
📌 Speichere diesen Post für die Woche!
Was ist DEIN größter Trade diese Woche? Schreib unten in die Kommentare! 👇
#Bitcoin #crypto #WeeklyOutlook #trading

3
2.5k

·
--
Bullisch
🔥 WÖCHENTLICHE AUSSICHT: $UTK Rockets +16%! Erwacht der Riese? 🚀
$UTK hat heute einen fantastischen +16% Pump geliefert und dabei den wichtigen Widerstand wie Butter durchbrochen. Genau diese Art von Momentum lieben wir in der Altseason! 🌊
🟢 WÖCHENTLICHE BIAS: BULLISCH 📈
Drei Gründe, warum ich bei $UTK long bleibe:
⚡ Sauberer Breakout über den Widerstand von $0.0075 mit solider Volumenbestätigung.
💪 Starker Bounce vom Tief bei $0.0068 zeigt, dass eifrige Käufer bereitstehen.
🌍 Makro-Windverhältnisse, da Zahlungstoken ernsthaft an Fahrt gewinnen.
🎯 WICHTIGE LEVEL ZUM BEOBACHTEN
🛑 Widerstand: $0.0095 (Nächste große Hürde zu überwinden)
🛡️ Unterstützung: $0.0070 (Kritische Zone, die die Bullen halten müssen)
👀 ALTCOINS AUF MEINEM RADAR
💜 MATIC — zieht sich eng zusammen für einen weiteren potenziellen Anstieg.
💙 $LRC — das zkRollup-Narrativ gewinnt wieder an Fahrt.
⚠️ Erinnerung: Wir navigieren immer noch durch volatile Gewässer. Risikomanagement ist alles. Dimensioniere deine Positionen entsprechend und jage niemals den grünen Kerzen nach. 🛑
🕯️ Der wöchentliche Schluss wird entscheidend für UTKs nächsten makroökonomischen Move sein. Die Bullen müssen die aktuellen Levels um jeden Preis verteidigen.
👇 Folge für tägliche Krypto-Einblicke und Premium-Trade-Setups! ✨
#CryptoTrading #AltcoinSeason #TechnicalAnalysis #Weeklyoutlook
🔥 WÖCHENTLICHE AUSSICHT: $UTK Rockets +16%! Erwacht der Riese? 🚀
$UTK hat heute einen fantastischen +16% Pump geliefert und dabei den wichtigen Widerstand wie Butter durchbrochen. Genau diese Art von Momentum lieben wir in der Altseason! 🌊
🟢 WÖCHENTLICHE BIAS: BULLISCH 📈
Drei Gründe, warum ich bei $UTK long bleibe:
⚡ Sauberer Breakout über den Widerstand von $0.0075 mit solider Volumenbestätigung.
💪 Starker Bounce vom Tief bei $0.0068 zeigt, dass eifrige Käufer bereitstehen.
🌍 Makro-Windverhältnisse, da Zahlungstoken ernsthaft an Fahrt gewinnen.
🎯 WICHTIGE LEVEL ZUM BEOBACHTEN
🛑 Widerstand: $0.0095 (Nächste große Hürde zu überwinden)
🛡️ Unterstützung: $0.0070 (Kritische Zone, die die Bullen halten müssen)
👀 ALTCOINS AUF MEINEM RADAR
💜 MATIC — zieht sich eng zusammen für einen weiteren potenziellen Anstieg.
💙 $LRC — das zkRollup-Narrativ gewinnt wieder an Fahrt.
⚠️ Erinnerung: Wir navigieren immer noch durch volatile Gewässer. Risikomanagement ist alles. Dimensioniere deine Positionen entsprechend und jage niemals den grünen Kerzen nach. 🛑
🕯️ Der wöchentliche Schluss wird entscheidend für UTKs nächsten makroökonomischen Move sein. Die Bullen müssen die aktuellen Levels um jeden Preis verteidigen.
👇 Folge für tägliche Krypto-Einblicke und Premium-Trade-Setups! ✨
#CryptoTrading #AltcoinSeason #TechnicalAnalysis #Weeklyoutlook
$UTK hat heute einen fantastischen +16% Pump geliefert und dabei den wichtigen Widerstand wie Butter durchbrochen. Genau diese Art von Momentum lieben wir in der Altseason! 🌊
🟢 WÖCHENTLICHE BIAS: BULLISCH 📈
Drei Gründe, warum ich bei $UTK long bleibe:
⚡ Sauberer Breakout über den Widerstand von $0.0075 mit solider Volumenbestätigung.
💪 Starker Bounce vom Tief bei $0.0068 zeigt, dass eifrige Käufer bereitstehen.
🌍 Makro-Windverhältnisse, da Zahlungstoken ernsthaft an Fahrt gewinnen.
🎯 WICHTIGE LEVEL ZUM BEOBACHTEN
🛑 Widerstand: $0.0095 (Nächste große Hürde zu überwinden)
🛡️ Unterstützung: $0.0070 (Kritische Zone, die die Bullen halten müssen)
👀 ALTCOINS AUF MEINEM RADAR
💜 MATIC — zieht sich eng zusammen für einen weiteren potenziellen Anstieg.
💙 $LRC — das zkRollup-Narrativ gewinnt wieder an Fahrt.
⚠️ Erinnerung: Wir navigieren immer noch durch volatile Gewässer. Risikomanagement ist alles. Dimensioniere deine Positionen entsprechend und jage niemals den grünen Kerzen nach. 🛑
🕯️ Der wöchentliche Schluss wird entscheidend für UTKs nächsten makroökonomischen Move sein. Die Bullen müssen die aktuellen Levels um jeden Preis verteidigen.
👇 Folge für tägliche Krypto-Einblicke und Premium-Trade-Setups! ✨
#CryptoTrading #AltcoinSeason #TechnicalAnalysis #Weeklyoutlook

1
99

💡 Monday Session Signals: Korrekturtag setzt oft die wöchentliche Stimmung
Am 13. Juli 2026 fällt Bitcoin um -2,02% auf 62.665 US-Dollar und setzt damit eine bärische Montagstimmung. Die Montag-Richtung korreliert oft mit dem wöchentlichen Close.
Wenn $BTC b vom 62.600-Dollar-Support abprallt, könnte die Woche eine Erholung in Richtung 64K sehen.
Achte auf die Dienstag-Asia-Session — sie bestätigt oder dreht oft die Montag-Richtung.
📌 Kernaussage:
Die Montag-Korrektur bei Bitcoin setzt eine vorsichtige wöchentliche Stimmung — ein Halt bei 62,6K könnte dennoch zu einer wöchentlichen Erholung führen.
#Trading #WeeklyOutlook
#BinanceAlphaAlert
💡 Monday Session Signals: Korrekturtag setzt oft die wöchentliche Stimmung
Am 13. Juli 2026 fällt Bitcoin um -2,02% auf 62.665 US-Dollar und setzt damit eine bärische Montagstimmung. Die Montag-Richtung korreliert oft mit dem wöchentlichen Close.
Wenn $BTC b vom 62.600-Dollar-Support abprallt, könnte die Woche eine Erholung in Richtung 64K sehen.
Achte auf die Dienstag-Asia-Session — sie bestätigt oder dreht oft die Montag-Richtung.
📌 Kernaussage:
Die Montag-Korrektur bei Bitcoin setzt eine vorsichtige wöchentliche Stimmung — ein Halt bei 62,6K könnte dennoch zu einer wöchentlichen Erholung führen.
#Trading #WeeklyOutlook
#BinanceAlphaAlert
Am 13. Juli 2026 fällt Bitcoin um -2,02% auf 62.665 US-Dollar und setzt damit eine bärische Montagstimmung. Die Montag-Richtung korreliert oft mit dem wöchentlichen Close.
Wenn $BTC b vom 62.600-Dollar-Support abprallt, könnte die Woche eine Erholung in Richtung 64K sehen.
Achte auf die Dienstag-Asia-Session — sie bestätigt oder dreht oft die Montag-Richtung.
📌 Kernaussage:
Die Montag-Korrektur bei Bitcoin setzt eine vorsichtige wöchentliche Stimmung — ein Halt bei 62,6K könnte dennoch zu einer wöchentlichen Erholung führen.
#Trading #WeeklyOutlook
#BinanceAlphaAlert
1
20

Verifiziert
Artikel
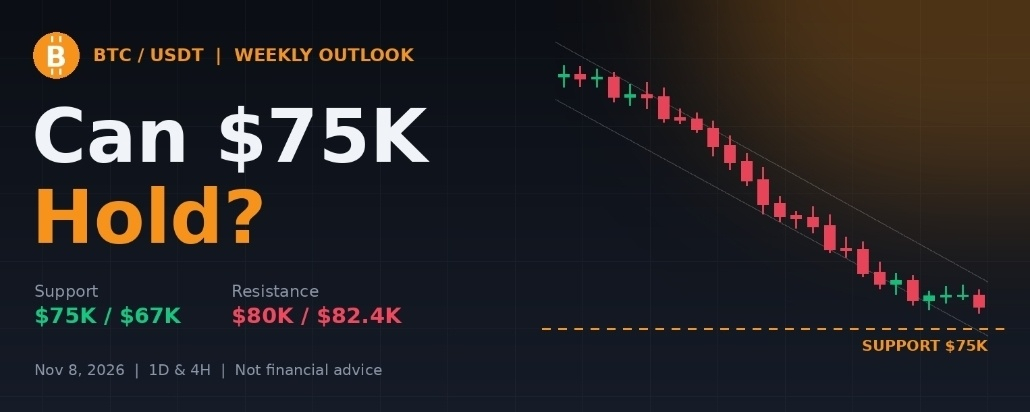
$BTC-Wochenausblick: Hält die Marke von 75.000 $ einer ereignisreichen Nachrichtenwoche stand? 8. November 2026📊Wöchentliche Analyse | 8. November 2026 | BTC/USDT, 1-Tages- und 4-Stunden-Charts
Marktüberblick
$BTC wird nach einem schwierigen Monat nahe 75.900 $ gehandelt. Der Oktober schloss etwa 7,3 % tiefer bei rund 77.500 $, da sich die Kreditbedingungen verschärften und Binance in den letzten Tagen des Monats von einem Rekord-Hack im Umfang von 6,3 Mrd. $ getroffen wurde. Diese Woche fiel der Kurs am 5. November unter 76.000 $, erholte sich von etwa 75.200 $ und liegt im Wochenverlauf rund 2 % im Minus. Trotz der vielen negativen Schlagzeilen hat sich der Kurs in der Zone um 75.000 $ behauptet.
Tageschart (1D)
- 🟢 Unterstützung: Zone um 75.000 $, diese Woche erneut getestet. Analysten verweisen außerdem auf ein Bündel langfristiger Durchschnitte im Bereich von 75.800–76.200 $.
$BTC-Wochenausblick: Hält die Marke von 75.000 $ einer ereignisreichen Nachrichtenwoche stand? 8. November 2026📊
Wöchentliche Analyse | 8. November 2026 | BTC/USDT, 1-Tages- und 4-Stunden-Charts
Marktüberblick
$BTC wird nach einem schwierigen Monat nahe 75.900 $ gehandelt. Der Oktober schloss etwa 7,3 % tiefer bei rund 77.500 $, da sich die Kreditbedingungen verschärften und Binance in den letzten Tagen des Monats von einem Rekord-Hack im Umfang von 6,3 Mrd. $ getroffen wurde. Diese Woche fiel der Kurs am 5. November unter 76.000 $, erholte sich von etwa 75.200 $ und liegt im Wochenverlauf rund 2 % im Minus. Trotz der vielen negativen Schlagzeilen hat sich der Kurs in der Zone um 75.000 $ behauptet.
Tageschart (1D)
- 🟢 Unterstützung: Zone um 75.000 $, diese Woche erneut getestet. Analysten verweisen außerdem auf ein Bündel langfristiger Durchschnitte im Bereich von 75.800–76.200 $.
Marktüberblick
$BTC wird nach einem schwierigen Monat nahe 75.900 $ gehandelt. Der Oktober schloss etwa 7,3 % tiefer bei rund 77.500 $, da sich die Kreditbedingungen verschärften und Binance in den letzten Tagen des Monats von einem Rekord-Hack im Umfang von 6,3 Mrd. $ getroffen wurde. Diese Woche fiel der Kurs am 5. November unter 76.000 $, erholte sich von etwa 75.200 $ und liegt im Wochenverlauf rund 2 % im Minus. Trotz der vielen negativen Schlagzeilen hat sich der Kurs in der Zone um 75.000 $ behauptet.
Tageschart (1D)
- 🟢 Unterstützung: Zone um 75.000 $, diese Woche erneut getestet. Analysten verweisen außerdem auf ein Bündel langfristiger Durchschnitte im Bereich von 75.800–76.200 $.
266

·
--
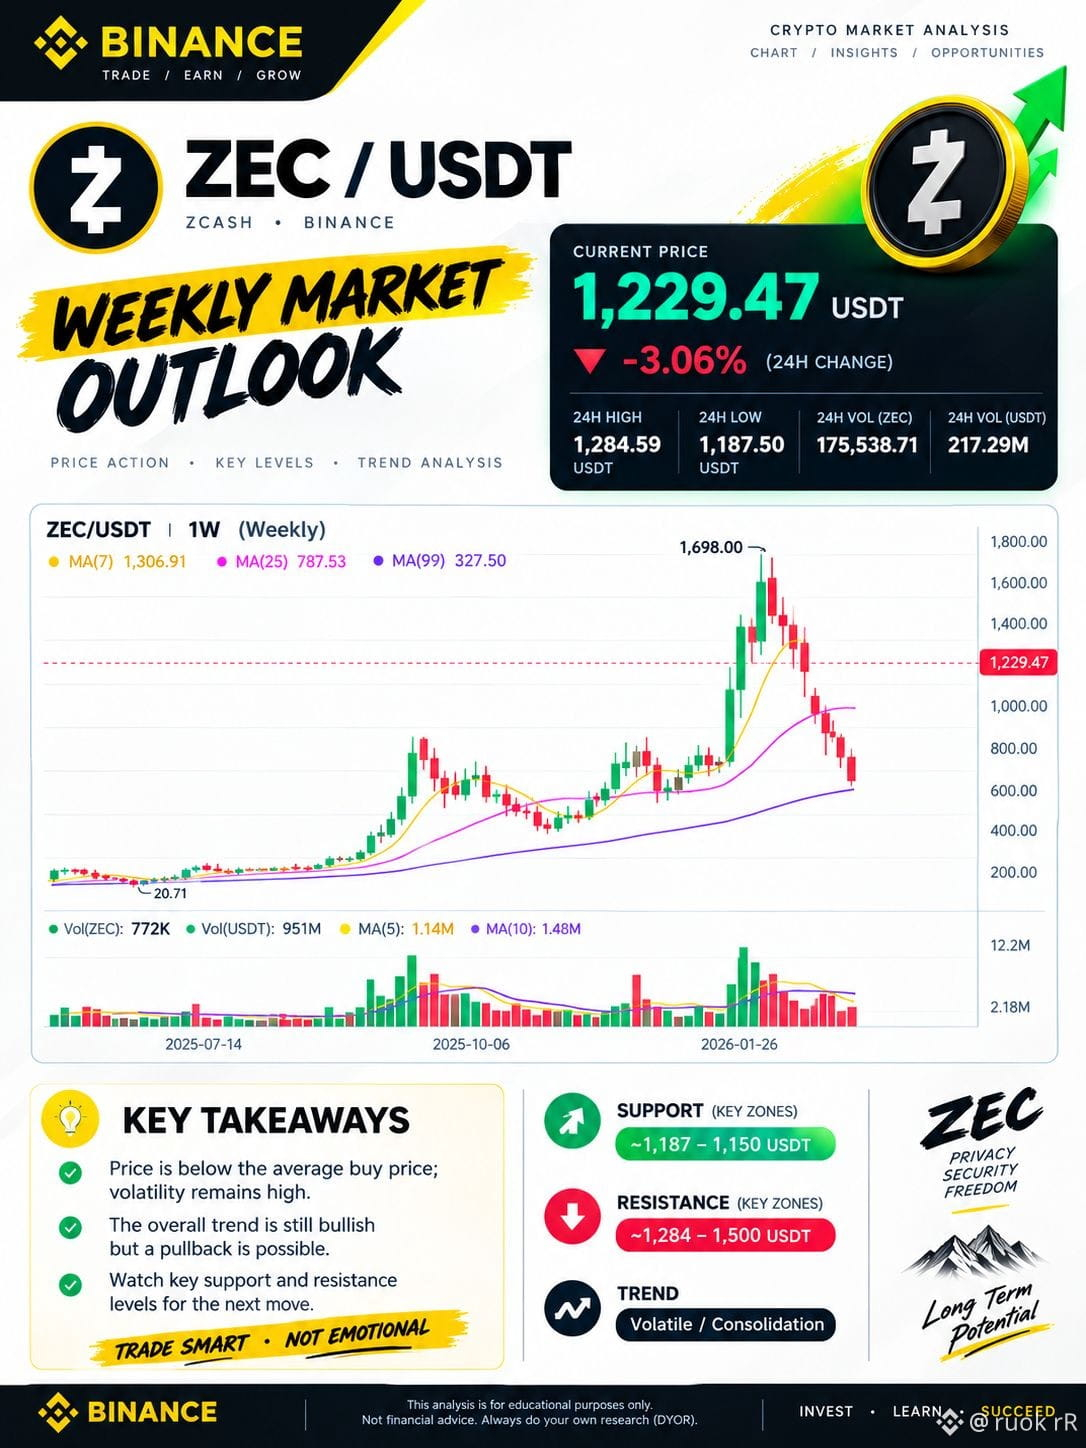
📊 Wöchentlicher Marktausblick für ZEC/USDT | Binance
🚀 Entdecke die aktuellen Marktbewegungen von Zcash ($ZEC ) mit unserer wöchentlichen technischen Analyse.
📈 Marktübersicht
- Aktueller Preis: 1,229.47 USDT
- Veränderung in 24 Std.: -3.06%
- Hoch in 24 Std.: 1,284.59 USDT
- Tief in 24 Std.: 1,187.50 USDT
🔍 Wichtige Highlights
- Wöchentliche Kursentwicklung und Trendanalyse
- Wichtige Unterstützungs- und Widerstandszonen
- Gleitende Durchschnitte (MA 7, MA 25, MA 99)
- Handelsvolumen und Marktvolatilität
💡 Handle clever. Bleib informiert.
Beobachte wichtige Kursniveaus, manage dein Risiko und recherchiere immer selbst, bevor du Handelsentscheidungen triffst.
⚠️ Haftungsausschluss: Dieser Inhalt dient ausschließlich Bildungs- und Informationszwecken. Er stellt keine Finanzberatung dar. Der Handel mit Kryptowährungen ist mit erheblichen Risiken verbunden.
#ZEC $ZEC #Zcash #ZECUSDT #binance #CryptoAnalysis #TechnicalAnalysis #CryptoTrading #WeeklyOutlook #Cryptocurrency
{spot}(ZECUSDT)
📊 Wöchentlicher Marktausblick für ZEC/USDT | Binance
🚀 Entdecke die aktuellen Marktbewegungen von Zcash ($ZEC ) mit unserer wöchentlichen technischen Analyse.
📈 Marktübersicht
- Aktueller Preis: 1,229.47 USDT
- Veränderung in 24 Std.: -3.06%
- Hoch in 24 Std.: 1,284.59 USDT
- Tief in 24 Std.: 1,187.50 USDT
🔍 Wichtige Highlights
- Wöchentliche Kursentwicklung und Trendanalyse
- Wichtige Unterstützungs- und Widerstandszonen
- Gleitende Durchschnitte (MA 7, MA 25, MA 99)
- Handelsvolumen und Marktvolatilität
💡 Handle clever. Bleib informiert.
Beobachte wichtige Kursniveaus, manage dein Risiko und recherchiere immer selbst, bevor du Handelsentscheidungen triffst.
⚠️ Haftungsausschluss: Dieser Inhalt dient ausschließlich Bildungs- und Informationszwecken. Er stellt keine Finanzberatung dar. Der Handel mit Kryptowährungen ist mit erheblichen Risiken verbunden.
#ZEC $ZEC #Zcash #ZECUSDT #binance #CryptoAnalysis #TechnicalAnalysis #CryptoTrading #WeeklyOutlook #Cryptocurrency
🚀 Entdecke die aktuellen Marktbewegungen von Zcash ($ZEC ) mit unserer wöchentlichen technischen Analyse.
📈 Marktübersicht
- Aktueller Preis: 1,229.47 USDT
- Veränderung in 24 Std.: -3.06%
- Hoch in 24 Std.: 1,284.59 USDT
- Tief in 24 Std.: 1,187.50 USDT
🔍 Wichtige Highlights
- Wöchentliche Kursentwicklung und Trendanalyse
- Wichtige Unterstützungs- und Widerstandszonen
- Gleitende Durchschnitte (MA 7, MA 25, MA 99)
- Handelsvolumen und Marktvolatilität
💡 Handle clever. Bleib informiert.
Beobachte wichtige Kursniveaus, manage dein Risiko und recherchiere immer selbst, bevor du Handelsentscheidungen triffst.
⚠️ Haftungsausschluss: Dieser Inhalt dient ausschließlich Bildungs- und Informationszwecken. Er stellt keine Finanzberatung dar. Der Handel mit Kryptowährungen ist mit erheblichen Risiken verbunden.
#ZEC $ZEC #Zcash #ZECUSDT #binance #CryptoAnalysis #TechnicalAnalysis #CryptoTrading #WeeklyOutlook #Cryptocurrency
234

·
--
Bullisch
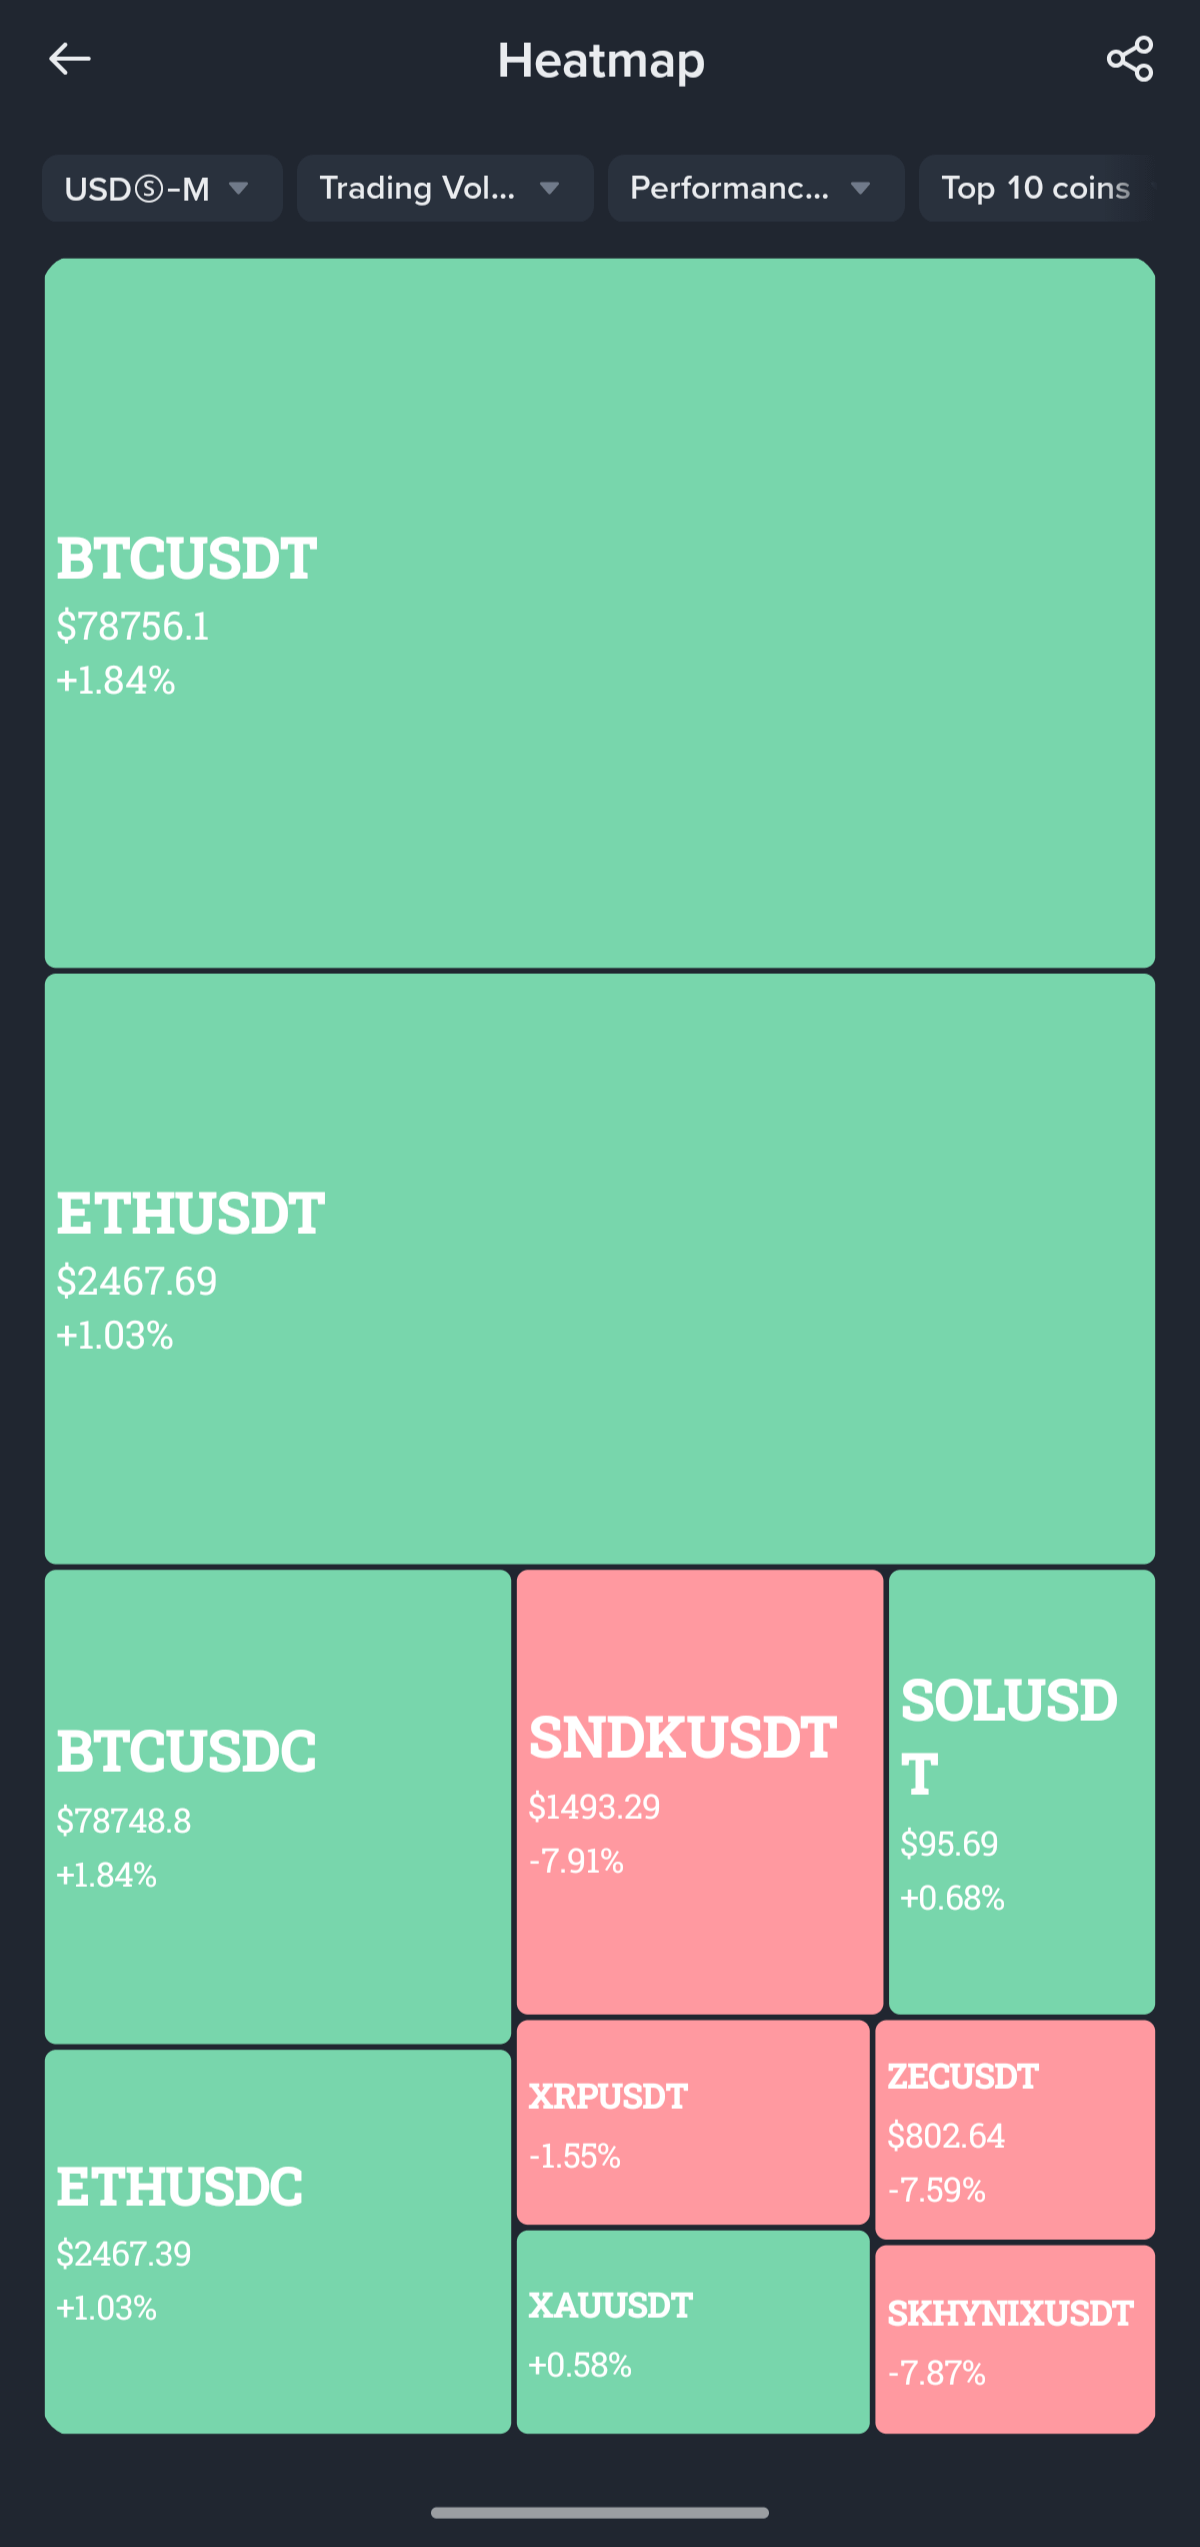
🔮 Spät-Nacht-Marktdynamik: Wichtige Kursniveaus, die man bis morgen im Blick behalten sollte! 🌌
Während wir die heutigen Handelssitzungen abschließen, $BTC , $ETH & $SOL halten sich in entscheidenden Konsolidierungsbereichen. 📊 Beobachte die bevorstehende Eröffnung des asiatischen Marktes auf mögliche Ausbruchsvolatilität! Halte dein Risiko eng, achte auf Liquidationen und bleibe diszipliniert 🔥
Was ist deine wichtigste Trading-Idee für morgen früh? Bullisch oder bärisch? Schreib sie unten in die Kommentare! 🚀
#WeeklyOutlook #bitcoin #BinanceSquare #MarketAnalysis #cryptotrading
{future}(BTCUSDT)
{future}(ETHUSDT)
{future}(SOLUSDT)
🔮 Spät-Nacht-Marktdynamik: Wichtige Kursniveaus, die man bis morgen im Blick behalten sollte! 🌌
Während wir die heutigen Handelssitzungen abschließen, $BTC , $ETH & $SOL halten sich in entscheidenden Konsolidierungsbereichen. 📊 Beobachte die bevorstehende Eröffnung des asiatischen Marktes auf mögliche Ausbruchsvolatilität! Halte dein Risiko eng, achte auf Liquidationen und bleibe diszipliniert 🔥
Was ist deine wichtigste Trading-Idee für morgen früh? Bullisch oder bärisch? Schreib sie unten in die Kommentare! 🚀
#WeeklyOutlook #bitcoin #BinanceSquare #MarketAnalysis #cryptotrading
Während wir die heutigen Handelssitzungen abschließen, $BTC , $ETH & $SOL halten sich in entscheidenden Konsolidierungsbereichen. 📊 Beobachte die bevorstehende Eröffnung des asiatischen Marktes auf mögliche Ausbruchsvolatilität! Halte dein Risiko eng, achte auf Liquidationen und bleibe diszipliniert 🔥
Was ist deine wichtigste Trading-Idee für morgen früh? Bullisch oder bärisch? Schreib sie unten in die Kommentare! 🚀
#WeeklyOutlook #bitcoin #BinanceSquare #MarketAnalysis #cryptotrading
37
·
--
Bullisch
🚀 $ZEC
{future}(ZECUSDT)
$ZEC +18% IN 24H — PRIVACY COINS WACHEN AUF? 🔥
📈 ZEC bewegt sich. +18% in 24h und hält die Struktur weiter — das ist kein Rauschen, das ist Momentum.
🟢 Wöchentlicher Bias: BULLISCH auf ZEC/USDT (4H)
1️⃣ Der Preis brach über einen wichtigen Widerstand hinaus und hält sich über $1,300 — die Struktur ist bullisch gekippt.
2️⃣ Das Volumen bestätigt den Move. Kein Fakeout — Käufer verteidigen die Levels.
3️⃣ Privacy Coins rotieren zurück in den Fokus, während die makroökonomische Unsicherheit wächst.
🎯 Wichtige Levels, die es zu beobachten gilt
🟢 Support: $1,280 — $1,300 Zone. Wenn das verloren geht, kippt der Bias schnell in Richtung neutral.
🔴 Widerstand: $1,399 High. Ein sauberer Break darüber öffnet $1,500+.
👀 Beobachte die BTC-Dominanz — jeder Rückgang dort befeuert das Alt-Momentum.
💎 Altcoins, die diese Woche im Blick sind
🔹 DASH — Korrelation im Privacy-Sektor mit ZEC, hinkt hinterher, ist aber bereit aufzuholen.
🔹 SCRT — unterbewertetes Privacy-Play, baut still und leise eine Basissstruktur auf.
🧠 Das ist genau die Art von Setup, auf die erfahrene Trader warten. Momentum + Struktur + Volumen-Alignment. Verwalte dein Risiko, zieh die Stops nach und lass den Trade arbeiten.
🔥 Folge FAM Trading für tägliche Setups und aktuelle Markt-Reads.
#CryptoTrading #TechnicalAnalysis #BinanceSquare #AltcoinSeason #WeeklyOutlook
🚀 $ZEC
$ZEC +18% IN 24H — PRIVACY COINS WACHEN AUF? 🔥
📈 ZEC bewegt sich. +18% in 24h und hält die Struktur weiter — das ist kein Rauschen, das ist Momentum.
🟢 Wöchentlicher Bias: BULLISCH auf ZEC/USDT (4H)
1️⃣ Der Preis brach über einen wichtigen Widerstand hinaus und hält sich über $1,300 — die Struktur ist bullisch gekippt.
2️⃣ Das Volumen bestätigt den Move. Kein Fakeout — Käufer verteidigen die Levels.
3️⃣ Privacy Coins rotieren zurück in den Fokus, während die makroökonomische Unsicherheit wächst.
🎯 Wichtige Levels, die es zu beobachten gilt
🟢 Support: $1,280 — $1,300 Zone. Wenn das verloren geht, kippt der Bias schnell in Richtung neutral.
🔴 Widerstand: $1,399 High. Ein sauberer Break darüber öffnet $1,500+.
👀 Beobachte die BTC-Dominanz — jeder Rückgang dort befeuert das Alt-Momentum.
💎 Altcoins, die diese Woche im Blick sind
🔹 DASH — Korrelation im Privacy-Sektor mit ZEC, hinkt hinterher, ist aber bereit aufzuholen.
🔹 SCRT — unterbewertetes Privacy-Play, baut still und leise eine Basissstruktur auf.
🧠 Das ist genau die Art von Setup, auf die erfahrene Trader warten. Momentum + Struktur + Volumen-Alignment. Verwalte dein Risiko, zieh die Stops nach und lass den Trade arbeiten.
🔥 Folge FAM Trading für tägliche Setups und aktuelle Markt-Reads.
#CryptoTrading #TechnicalAnalysis #BinanceSquare #AltcoinSeason #WeeklyOutlook
$ZEC +18% IN 24H — PRIVACY COINS WACHEN AUF? 🔥
📈 ZEC bewegt sich. +18% in 24h und hält die Struktur weiter — das ist kein Rauschen, das ist Momentum.
🟢 Wöchentlicher Bias: BULLISCH auf ZEC/USDT (4H)
1️⃣ Der Preis brach über einen wichtigen Widerstand hinaus und hält sich über $1,300 — die Struktur ist bullisch gekippt.
2️⃣ Das Volumen bestätigt den Move. Kein Fakeout — Käufer verteidigen die Levels.
3️⃣ Privacy Coins rotieren zurück in den Fokus, während die makroökonomische Unsicherheit wächst.
🎯 Wichtige Levels, die es zu beobachten gilt
🟢 Support: $1,280 — $1,300 Zone. Wenn das verloren geht, kippt der Bias schnell in Richtung neutral.
🔴 Widerstand: $1,399 High. Ein sauberer Break darüber öffnet $1,500+.
👀 Beobachte die BTC-Dominanz — jeder Rückgang dort befeuert das Alt-Momentum.
💎 Altcoins, die diese Woche im Blick sind
🔹 DASH — Korrelation im Privacy-Sektor mit ZEC, hinkt hinterher, ist aber bereit aufzuholen.
🔹 SCRT — unterbewertetes Privacy-Play, baut still und leise eine Basissstruktur auf.
🧠 Das ist genau die Art von Setup, auf die erfahrene Trader warten. Momentum + Struktur + Volumen-Alignment. Verwalte dein Risiko, zieh die Stops nach und lass den Trade arbeiten.
🔥 Folge FAM Trading für tägliche Setups und aktuelle Markt-Reads.
#CryptoTrading #TechnicalAnalysis #BinanceSquare #AltcoinSeason #WeeklyOutlook

311
·
--
📊 Wöchentlicher Krypto-Marktrückblick & Ausblick auf die nächste Woche
Diese Woche blieb der Krypto-Markt stark volatil, während Trader auf makroökonomische Entwicklungen und sich verändernde Marktstimmung reagierten.
🔹 Wöchentliche Highlights • Bitcoin konnte trotz heftiger Intraday-Schwankungen weiterhin eine wichtige Unterstützung halten. • Ethereum blieb widerstandsfähig, gestützt durch eine stabile Netzwerkaktivität. • Mehrere Altcoins schnitten besser ab als der breitere Markt, während Meme-Coins eine erhöhte Volatilität zeigten. • Die Anlegerstimmung verbesserte sich gegen Ende der Woche leicht.
👀 Worauf du nächste Woche achten solltest
✅ Die wichtigsten Unterstützungs- und Widerstandsniveaus von Bitcoin.
✅ Der Momentum-Vergleich von Ethereum gegenüber BTC.
✅ Makroökonomische Nachrichten, die Risikoanlagen beeinflussen könnten.
✅ Handelsvolumen und Entwicklungen im Zusammenhang mit ETFs.
✅ Jeder Ausbruch oder Zusammenbruch aus der aktuellen Spanne.
Merke: Verfolge den Markt nicht. Lass den Markt zu deinem Setup kommen.
💬 Worauf achtest du nächste Woche?
#Bitcoin #Crypto #CryptoNews #MarketRecap #WeeklyOutlook
📊 Wöchentlicher Krypto-Marktrückblick & Ausblick auf die nächste Woche
Diese Woche blieb der Krypto-Markt stark volatil, während Trader auf makroökonomische Entwicklungen und sich verändernde Marktstimmung reagierten.
🔹 Wöchentliche Highlights • Bitcoin konnte trotz heftiger Intraday-Schwankungen weiterhin eine wichtige Unterstützung halten. • Ethereum blieb widerstandsfähig, gestützt durch eine stabile Netzwerkaktivität. • Mehrere Altcoins schnitten besser ab als der breitere Markt, während Meme-Coins eine erhöhte Volatilität zeigten. • Die Anlegerstimmung verbesserte sich gegen Ende der Woche leicht.
👀 Worauf du nächste Woche achten solltest
✅ Die wichtigsten Unterstützungs- und Widerstandsniveaus von Bitcoin.
✅ Der Momentum-Vergleich von Ethereum gegenüber BTC.
✅ Makroökonomische Nachrichten, die Risikoanlagen beeinflussen könnten.
✅ Handelsvolumen und Entwicklungen im Zusammenhang mit ETFs.
✅ Jeder Ausbruch oder Zusammenbruch aus der aktuellen Spanne.
Merke: Verfolge den Markt nicht. Lass den Markt zu deinem Setup kommen.
💬 Worauf achtest du nächste Woche?
#Bitcoin #Crypto #CryptoNews #MarketRecap #WeeklyOutlook
Diese Woche blieb der Krypto-Markt stark volatil, während Trader auf makroökonomische Entwicklungen und sich verändernde Marktstimmung reagierten.
🔹 Wöchentliche Highlights • Bitcoin konnte trotz heftiger Intraday-Schwankungen weiterhin eine wichtige Unterstützung halten. • Ethereum blieb widerstandsfähig, gestützt durch eine stabile Netzwerkaktivität. • Mehrere Altcoins schnitten besser ab als der breitere Markt, während Meme-Coins eine erhöhte Volatilität zeigten. • Die Anlegerstimmung verbesserte sich gegen Ende der Woche leicht.
👀 Worauf du nächste Woche achten solltest
✅ Die wichtigsten Unterstützungs- und Widerstandsniveaus von Bitcoin.
✅ Der Momentum-Vergleich von Ethereum gegenüber BTC.
✅ Makroökonomische Nachrichten, die Risikoanlagen beeinflussen könnten.
✅ Handelsvolumen und Entwicklungen im Zusammenhang mit ETFs.
✅ Jeder Ausbruch oder Zusammenbruch aus der aktuellen Spanne.
Merke: Verfolge den Markt nicht. Lass den Markt zu deinem Setup kommen.
💬 Worauf achtest du nächste Woche?
#Bitcoin #Crypto #CryptoNews #MarketRecap #WeeklyOutlook
1
82

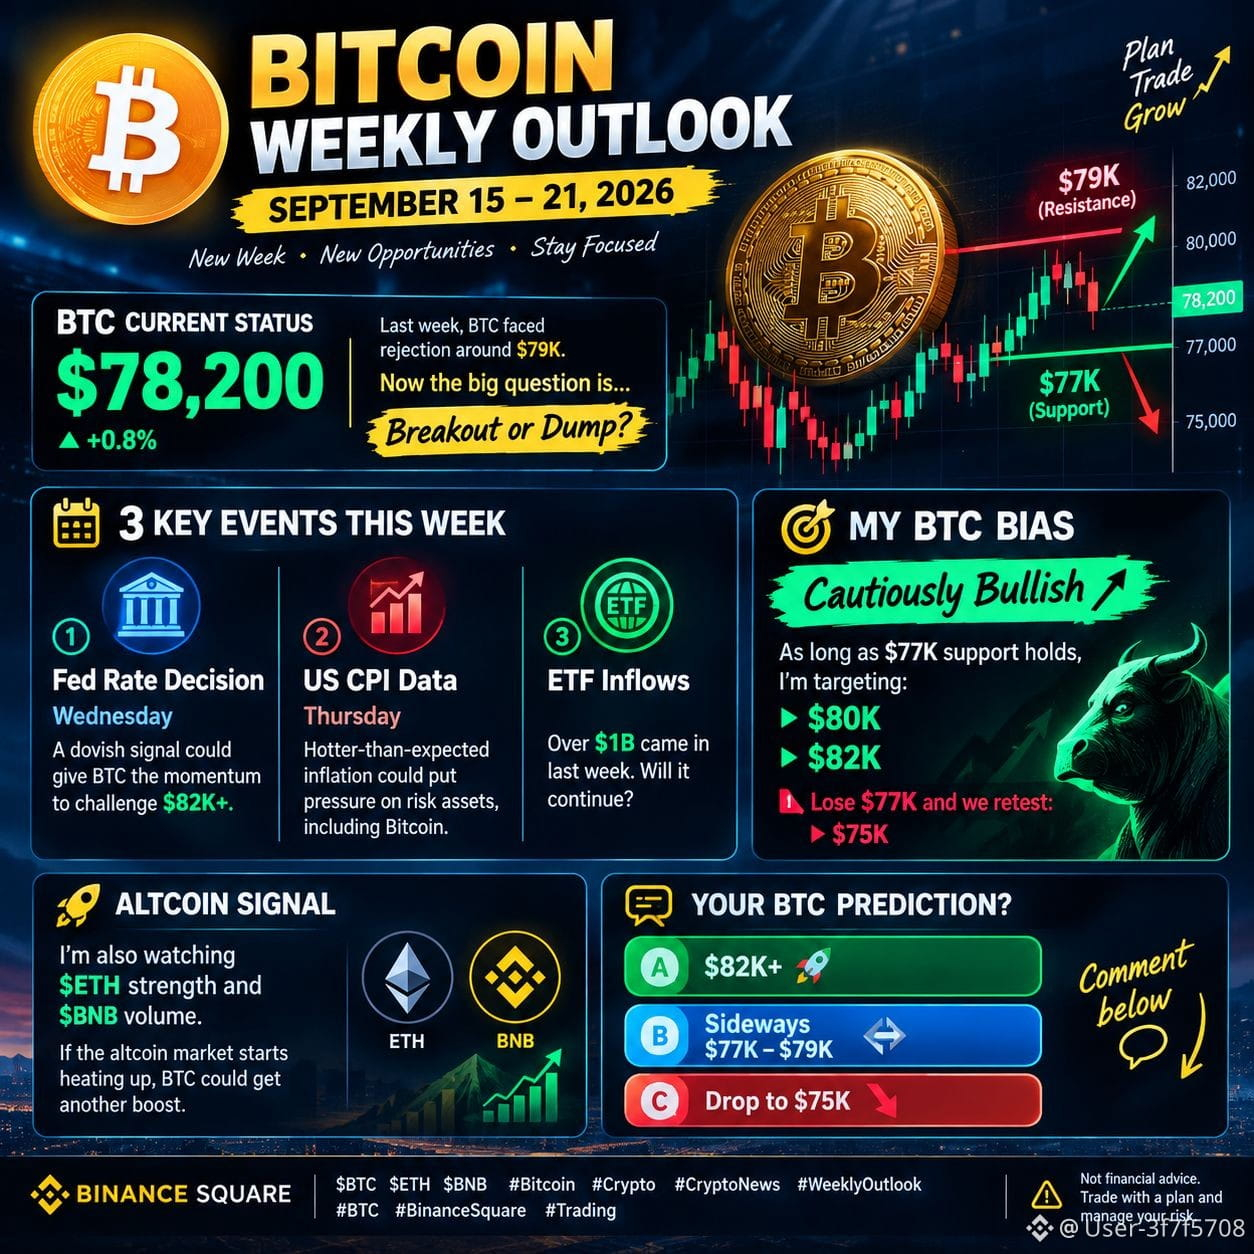
🚀 BITCOIN-WOCHENBLICK — 15.–21. SEPTEMBER 2026 🚀
Guten Morgen, Trader! 📈
Eine neue Woche ist da, und Bitcoin steht an einer entscheidenden Stelle.
₿ BTC: ~$78,200
Letzte Woche wurde BTC bei rund $79K abgewiesen. Jetzt stellt sich die große Frage:
🔥 Wird Bitcoin nach oben ausbrechen — oder gibt es erneut einen Rücksetzer?
📌 3 WICHTIGE PUNKTE, DIE ES ZU BEOBACHTEN GILT
1️⃣ Fed-Zinsentscheidung — Mittwoch
Ein dovisher Ausblick könnte BTC den Schwung geben, um $82K+ herauszufordern.
2️⃣ US-CPI-Daten — Donnerstag
Höhere Inflation als erwartet könnte Risikoanlagen unter Druck setzen — einschließlich Bitcoin.
3️⃣ ETF-Zuflüsse 💰
Bitcoin-ETFs verzeichneten letzte Woche starke Zuflüsse. Die große Frage ist, ob die institutionelle Nachfrage weiter anhält.
🎯 MEIN BTC-BIAS
Vorsichtig bullisch 🟢
Solange die Unterstützung bei $77K hält, beobachte ich:
➡️ $80K
➡️ $82K
Aber wenn BTC $77K verliert, wird ein Move in Richtung $75K möglich.
👀 ALTCOIN-SIGNAL
Ich schaue mir außerdem die Stärke von $ETH und das BNB-Volumen an.
Wenn der Altcoin-Markt anfängt, sich zu erhitzen, könnte BTC einen weiteren Schub bekommen.
🗳️ WIE FÄLLT DEINE BTC-PROGNOSE AUS?
A) 🚀 $82K+
B) 📊 Seitwärts $77K–$79K
C) 🔻 Rückgang auf $75K
Schreib deine Prognose unten 👇
Keine Finanzberatung. Handel mit Plan und steuere dein Risiko.
$BTC $ETH $BNB
#Bitcoin❗ #Crypto_Jobs🎯 o #CryptoNews #WeeklyOutlook #BTC
🚀 BITCOIN-WOCHENBLICK — 15.–21. SEPTEMBER 2026 🚀
Guten Morgen, Trader! 📈
Eine neue Woche ist da, und Bitcoin steht an einer entscheidenden Stelle.
₿ BTC: ~$78,200
Letzte Woche wurde BTC bei rund $79K abgewiesen. Jetzt stellt sich die große Frage:
🔥 Wird Bitcoin nach oben ausbrechen — oder gibt es erneut einen Rücksetzer?
📌 3 WICHTIGE PUNKTE, DIE ES ZU BEOBACHTEN GILT
1️⃣ Fed-Zinsentscheidung — Mittwoch
Ein dovisher Ausblick könnte BTC den Schwung geben, um $82K+ herauszufordern.
2️⃣ US-CPI-Daten — Donnerstag
Höhere Inflation als erwartet könnte Risikoanlagen unter Druck setzen — einschließlich Bitcoin.
3️⃣ ETF-Zuflüsse 💰
Bitcoin-ETFs verzeichneten letzte Woche starke Zuflüsse. Die große Frage ist, ob die institutionelle Nachfrage weiter anhält.
🎯 MEIN BTC-BIAS
Vorsichtig bullisch 🟢
Solange die Unterstützung bei $77K hält, beobachte ich:
➡️ $80K
➡️ $82K
Aber wenn BTC $77K verliert, wird ein Move in Richtung $75K möglich.
👀 ALTCOIN-SIGNAL
Ich schaue mir außerdem die Stärke von $ETH und das BNB-Volumen an.
Wenn der Altcoin-Markt anfängt, sich zu erhitzen, könnte BTC einen weiteren Schub bekommen.
🗳️ WIE FÄLLT DEINE BTC-PROGNOSE AUS?
A) 🚀 $82K+
B) 📊 Seitwärts $77K–$79K
C) 🔻 Rückgang auf $75K
Schreib deine Prognose unten 👇
Keine Finanzberatung. Handel mit Plan und steuere dein Risiko.
$BTC $ETH $BNB
#Bitcoin❗ #Crypto_Jobs🎯 o #CryptoNews #WeeklyOutlook #BTC
Guten Morgen, Trader! 📈
Eine neue Woche ist da, und Bitcoin steht an einer entscheidenden Stelle.
₿ BTC: ~$78,200
Letzte Woche wurde BTC bei rund $79K abgewiesen. Jetzt stellt sich die große Frage:
🔥 Wird Bitcoin nach oben ausbrechen — oder gibt es erneut einen Rücksetzer?
📌 3 WICHTIGE PUNKTE, DIE ES ZU BEOBACHTEN GILT
1️⃣ Fed-Zinsentscheidung — Mittwoch
Ein dovisher Ausblick könnte BTC den Schwung geben, um $82K+ herauszufordern.
2️⃣ US-CPI-Daten — Donnerstag
Höhere Inflation als erwartet könnte Risikoanlagen unter Druck setzen — einschließlich Bitcoin.
3️⃣ ETF-Zuflüsse 💰
Bitcoin-ETFs verzeichneten letzte Woche starke Zuflüsse. Die große Frage ist, ob die institutionelle Nachfrage weiter anhält.
🎯 MEIN BTC-BIAS
Vorsichtig bullisch 🟢
Solange die Unterstützung bei $77K hält, beobachte ich:
➡️ $80K
➡️ $82K
Aber wenn BTC $77K verliert, wird ein Move in Richtung $75K möglich.
👀 ALTCOIN-SIGNAL
Ich schaue mir außerdem die Stärke von $ETH und das BNB-Volumen an.
Wenn der Altcoin-Markt anfängt, sich zu erhitzen, könnte BTC einen weiteren Schub bekommen.
🗳️ WIE FÄLLT DEINE BTC-PROGNOSE AUS?
A) 🚀 $82K+
B) 📊 Seitwärts $77K–$79K
C) 🔻 Rückgang auf $75K
Schreib deine Prognose unten 👇
Keine Finanzberatung. Handel mit Plan und steuere dein Risiko.
$BTC $ETH $BNB
#Bitcoin❗ #Crypto_Jobs🎯 o #CryptoNews #WeeklyOutlook #BTC
82
·
--
Bullisch
$BANK
{future}(BANKUSDT)
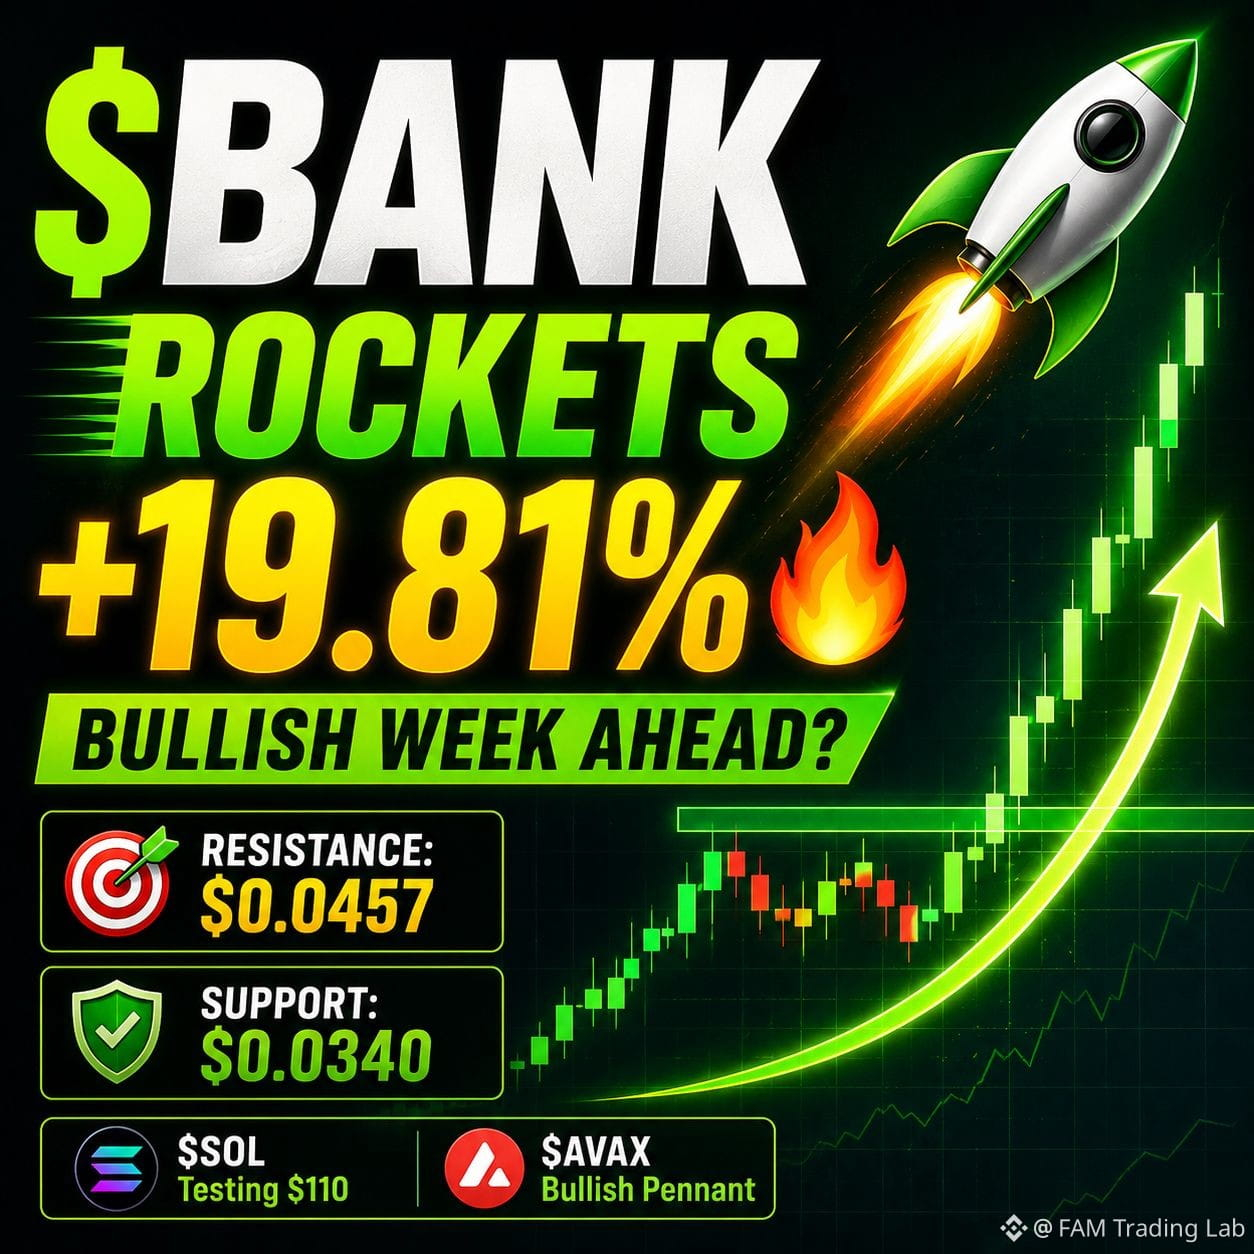
🚀 WÖCHENTLICHE AUSSICHT | $BANK Rockets +19,81% 🔥
$BANK hat genau das geliefert, worauf wir gewartet haben — ein sauberer Ausbruch mit Überzeugung. Wenn Alts so anfangen zu pumpen, ist es normalerweise der Anfang, nicht das Ende. 🌊
📈 BULLISCHER TREND FÜR DIE WOCHE
⚡ Starke Momentumbewegung über dem Widerstand von $0,038
🔥 Volumenschub bestätigt institutionelles Interesse
🔄 4H Struktur zeigt ein gesundes Konsolidierungsmuster
🎯 WICHTIGE NIVEAUS ZUM BEOBACHTEN
🛑 Widerstand: $0,0457 (heutiges Hoch)
🛡️ Unterstützung: $0,0340 Zone
📅 Makro: Fed-Protokolle am Mittwoch könnten Volatilität auslösen
👀 ALTCOINS AUF MEINEM RADAR
🥈 SOL — testet wichtigen Widerstand bei $110
🔺 AVAX — bildet bullisches Wimpel-Muster auf dem Tageschart
Das Setup erinnert mich an die frühe Altseason 2023. Positionsgröße ist hier alles — sei nicht gierig, aber verpasse auch nicht die Welle. 🏄♂️
⚖️ Risikomanagement über alles. Wir sehen uns in den Schützengräben. 🛠️
Folge für tägliche Setups und Marktupdates 📈
#CryptoTrading #TechnicalAnalysis #BinanceSquare #Altcoins #WeeklyOutlook
$BANK
🚀 WÖCHENTLICHE AUSSICHT | $BANK Rockets +19,81% 🔥
$BANK hat genau das geliefert, worauf wir gewartet haben — ein sauberer Ausbruch mit Überzeugung. Wenn Alts so anfangen zu pumpen, ist es normalerweise der Anfang, nicht das Ende. 🌊
📈 BULLISCHER TREND FÜR DIE WOCHE
⚡ Starke Momentumbewegung über dem Widerstand von $0,038
🔥 Volumenschub bestätigt institutionelles Interesse
🔄 4H Struktur zeigt ein gesundes Konsolidierungsmuster
🎯 WICHTIGE NIVEAUS ZUM BEOBACHTEN
🛑 Widerstand: $0,0457 (heutiges Hoch)
🛡️ Unterstützung: $0,0340 Zone
📅 Makro: Fed-Protokolle am Mittwoch könnten Volatilität auslösen
👀 ALTCOINS AUF MEINEM RADAR
🥈 SOL — testet wichtigen Widerstand bei $110
🔺 AVAX — bildet bullisches Wimpel-Muster auf dem Tageschart
Das Setup erinnert mich an die frühe Altseason 2023. Positionsgröße ist hier alles — sei nicht gierig, aber verpasse auch nicht die Welle. 🏄♂️
⚖️ Risikomanagement über alles. Wir sehen uns in den Schützengräben. 🛠️
Folge für tägliche Setups und Marktupdates 📈
#CryptoTrading #TechnicalAnalysis #BinanceSquare #Altcoins #WeeklyOutlook
🚀 WÖCHENTLICHE AUSSICHT | $BANK Rockets +19,81% 🔥
$BANK hat genau das geliefert, worauf wir gewartet haben — ein sauberer Ausbruch mit Überzeugung. Wenn Alts so anfangen zu pumpen, ist es normalerweise der Anfang, nicht das Ende. 🌊
📈 BULLISCHER TREND FÜR DIE WOCHE
⚡ Starke Momentumbewegung über dem Widerstand von $0,038
🔥 Volumenschub bestätigt institutionelles Interesse
🔄 4H Struktur zeigt ein gesundes Konsolidierungsmuster
🎯 WICHTIGE NIVEAUS ZUM BEOBACHTEN
🛑 Widerstand: $0,0457 (heutiges Hoch)
🛡️ Unterstützung: $0,0340 Zone
📅 Makro: Fed-Protokolle am Mittwoch könnten Volatilität auslösen
👀 ALTCOINS AUF MEINEM RADAR
🥈 SOL — testet wichtigen Widerstand bei $110
🔺 AVAX — bildet bullisches Wimpel-Muster auf dem Tageschart
Das Setup erinnert mich an die frühe Altseason 2023. Positionsgröße ist hier alles — sei nicht gierig, aber verpasse auch nicht die Welle. 🏄♂️
⚖️ Risikomanagement über alles. Wir sehen uns in den Schützengräben. 🛠️
Folge für tägliche Setups und Marktupdates 📈
#CryptoTrading #TechnicalAnalysis #BinanceSquare #Altcoins #WeeklyOutlook
124
Anmelden und weiter Inhalte entdecken
Krypto-Nutzer weltweit auf Binance Square kennenlernen
⚡️ Bleib in Sachen Krypto stets am Puls.
💬 Die weltgrößte Kryptobörse vertraut darauf.
👍 Erhalte verlässliche Einblicke von verifizierten Creators.
E-Mail-Adresse/Telefonnummer
Trendthemen
1
#NvidiaInvestigatesAfterHuang’sAffairApology
23,251 Aufrufe
310 Kommentare
2
#BitcoinFiveWeeklyLosses
38,223 Aufrufe
747 Kommentare
3
#AIChipSlumpNasdaq
22,293 Aufrufe
419 Kommentare
4
#SouthKoreaSupremeCourtClarifiesVirtualAssetSeizureRules
0 Aufrufe
1 Kommentare
5
#EthereumSpotETFsPost$365MWeeklyOutflow
970 Aufrufe
27 Kommentare
6
#GalxeToIntegrateIntoGravityGraduallyCloseQuest
0 Aufrufe
4 Kommentare
7
#TradFiForBeginners
261,026 Aufrufe
2,325 Kommentare
8
#KeplrAdvisesSocialLoginUsersToTransferAssets
89,355 Aufrufe
671 Kommentare
9
#TetherPlans€28.8MForJuventusCapitalIncrease
60,571 Aufrufe
491 Kommentare
10
#JobsReportRaisesHikeOdds
1M Aufrufe
4,678 Kommentare