

#shib
shib
477M Aufrufe
1.6M Kommentare
Hot
Zuletzt

·
--
Begriffserklärung: Woher stammt SHIB?
Bei der Ausgabe von SHIB wurde die Hälfte des Gesamtangebots an Vitaliks Adresse gesendet.
Coin im Thema: $SHIB notiert bei 0.0₅5, 24 Std. +2.04 %.
Wähle deine Positionsgröße mit Bedacht und lass dir genug Spielraum.
#SHIB
Es ist dein Geld – überlege gut, bevor du handelst.
Bei der Ausgabe von SHIB wurde die Hälfte des Gesamtangebots an Vitaliks Adresse gesendet.
Coin im Thema: $SHIB notiert bei 0.0₅5, 24 Std. +2.04 %.
Wähle deine Positionsgröße mit Bedacht und lass dir genug Spielraum.
#SHIB
Es ist dein Geld – überlege gut, bevor du handelst.
397

·
--
Bullisch
🐸 PEPE vs. 🐕 SHIB: Welche Meme-Coins steigen zuerst?
Der Kampf der Meme-Giganten wird immer heißer! Wenn du als Krypto-Trader wissen möchtest, ob Pepe (PEPE) oder Shiba Inu (SHIB) die nächste massive Rallye auslösen wird, findest du hier eine kurze, datengestützte Analyse.
🔥 Warum PEPE derzeit die Nase vorn hat:
1. Höheres Handelsvolumen: PEPE zieht derzeit im Vergleich zu SHIB ein enormes Handelsvolumen von Kleinanlegern und Walen an – ein Zeichen für hohe Liquidität und großes Handelsinteresse.
2. Geringere Marktkapitalisierung: Da PEPE eine geringere Marktkapitalisierung als SHIB hat, ist deutlich weniger Kapitalzufluss nötig, um den Preis zu verdoppeln oder zu verdreifachen.
3. Pure Meme-Energie: Während SHIB sich auf Nutzen konzentriert (Shibarium, Metaverse), lebt PEPE von viralem Hype – und der sorgt in einem Bullenmarkt erfahrungsgemäß für schnellere, senkrechte Kursanstiege.
📈 Der Vorteil von SHIB:
SHIB bleibt ein sichereres, etablierteres Ökosystem mit kontinuierlichen Token-Verbrennungen. Die enorme Marktkapitalisierung bremst jedoch explosive kurzfristige Gewinne im Vergleich zum Frosch-Coin.
💡 Fazit: Wenn du auf hohe Risiken und extrem schnelle Gewinne aus bist, zeigt PEPE derzeit mehr Schwung, um zuerst durchzustarten. Für stetiges, langfristiges Wachstum des Ökosystems behauptet sich SHIB.
Auf welchen Coin setzt du beim nächsten Aufwärtsschub? Bist du Team 🐸 oder Team 🐕? Schreib es mir in die Kommentare!
#Write2Earn #CryptoAnalysis #PEPE #SHIB #Binance
$PEPE $SHIB
{spot}(SHIBUSDT)
{spot}(PEPEUSDT)
🐸 PEPE vs. 🐕 SHIB: Welche Meme-Coins steigen zuerst?
Der Kampf der Meme-Giganten wird immer heißer! Wenn du als Krypto-Trader wissen möchtest, ob Pepe (PEPE) oder Shiba Inu (SHIB) die nächste massive Rallye auslösen wird, findest du hier eine kurze, datengestützte Analyse.
🔥 Warum PEPE derzeit die Nase vorn hat:
1. Höheres Handelsvolumen: PEPE zieht derzeit im Vergleich zu SHIB ein enormes Handelsvolumen von Kleinanlegern und Walen an – ein Zeichen für hohe Liquidität und großes Handelsinteresse.
2. Geringere Marktkapitalisierung: Da PEPE eine geringere Marktkapitalisierung als SHIB hat, ist deutlich weniger Kapitalzufluss nötig, um den Preis zu verdoppeln oder zu verdreifachen.
3. Pure Meme-Energie: Während SHIB sich auf Nutzen konzentriert (Shibarium, Metaverse), lebt PEPE von viralem Hype – und der sorgt in einem Bullenmarkt erfahrungsgemäß für schnellere, senkrechte Kursanstiege.
📈 Der Vorteil von SHIB:
SHIB bleibt ein sichereres, etablierteres Ökosystem mit kontinuierlichen Token-Verbrennungen. Die enorme Marktkapitalisierung bremst jedoch explosive kurzfristige Gewinne im Vergleich zum Frosch-Coin.
💡 Fazit: Wenn du auf hohe Risiken und extrem schnelle Gewinne aus bist, zeigt PEPE derzeit mehr Schwung, um zuerst durchzustarten. Für stetiges, langfristiges Wachstum des Ökosystems behauptet sich SHIB.
Auf welchen Coin setzt du beim nächsten Aufwärtsschub? Bist du Team 🐸 oder Team 🐕? Schreib es mir in die Kommentare!
#Write2Earn #CryptoAnalysis #PEPE #SHIB #Binance
$PEPE $SHIB

3
614

·
--
Übersetzung ansehen
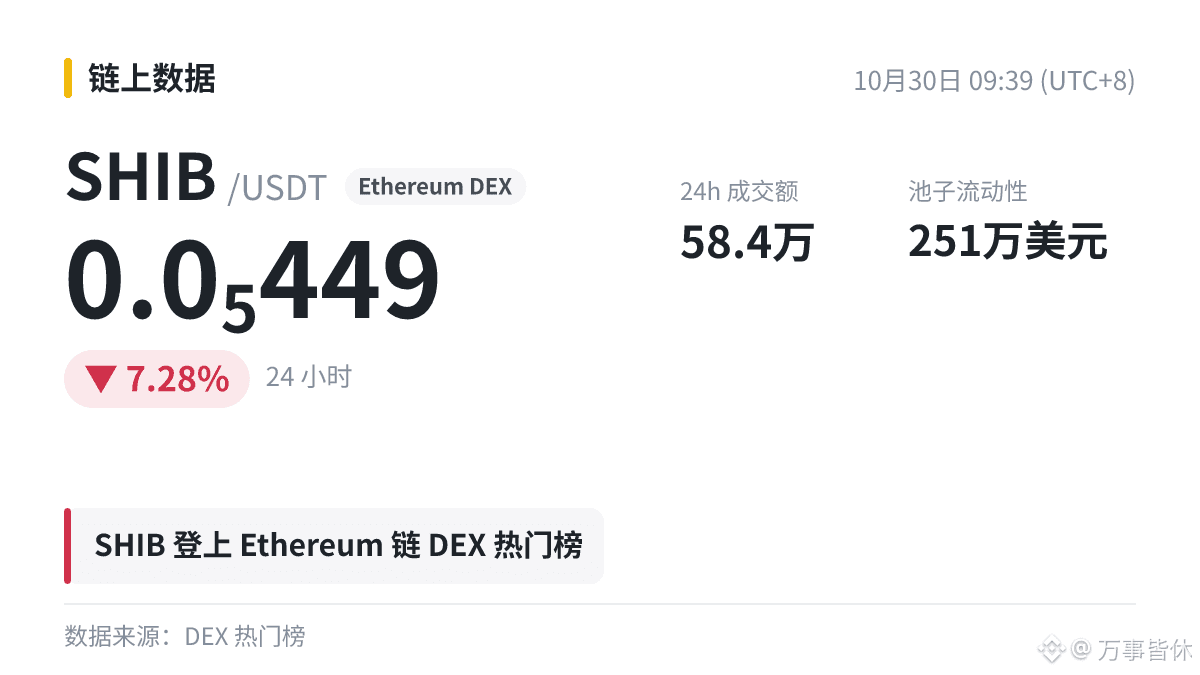
$SHIB 上了 Ethereum 链上热门(第 10 名),24h -7.28%。
有个细节:DEX热度往往早于交易所盘口的反应,但也经常是小圈子的自嗨。关键看盘口买盘是否放大。
评论区说说你的预判,回头复盘。
#SHIB
$SHIB 上了 Ethereum 链上热门(第 10 名),24h -7.28%。
有个细节:DEX热度往往早于交易所盘口的反应,但也经常是小圈子的自嗨。关键看盘口买盘是否放大。
评论区说说你的预判,回头复盘。
#SHIB
有个细节:DEX热度往往早于交易所盘口的反应,但也经常是小圈子的自嗨。关键看盘口买盘是否放大。
评论区说说你的预判,回头复盘。
#SHIB
161

·
--
Übersetzung ansehen
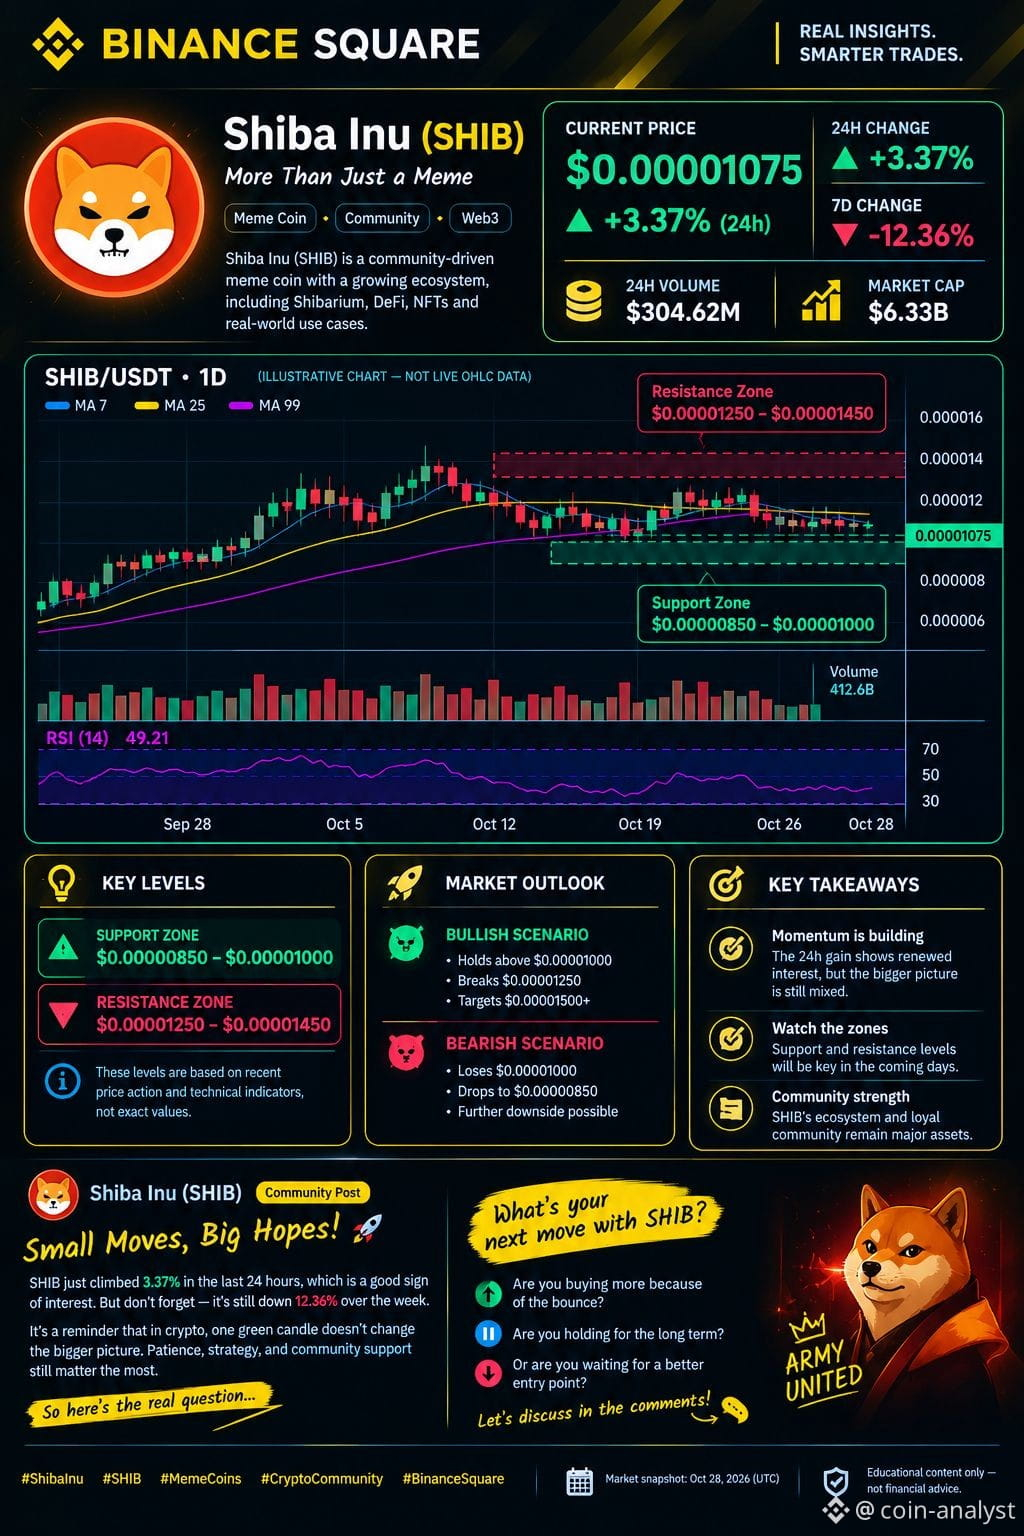
$SHIB Inu is back in the spotlight! 📈 SHIB has climbed 3.37% in 24 hours, reaching around $0.00001075 in the latest snapshot. But before celebrating, remember it’s still down 12.36% over seven days.
#SHİB #SHIB #Shibalnu #shiba⚡ #Shibarium
{spot}(SHIBUSDT)
$SHIB Inu is back in the spotlight! 📈 SHIB has climbed 3.37% in 24 hours, reaching around $0.00001075 in the latest snapshot. But before celebrating, remember it’s still down 12.36% over seven days.
#SHİB #SHIB #Shibalnu #shiba⚡ #Shibarium
#SHİB #SHIB #Shibalnu #shiba⚡ #Shibarium
110

·
--
Bullisch
Übersetzung ansehen
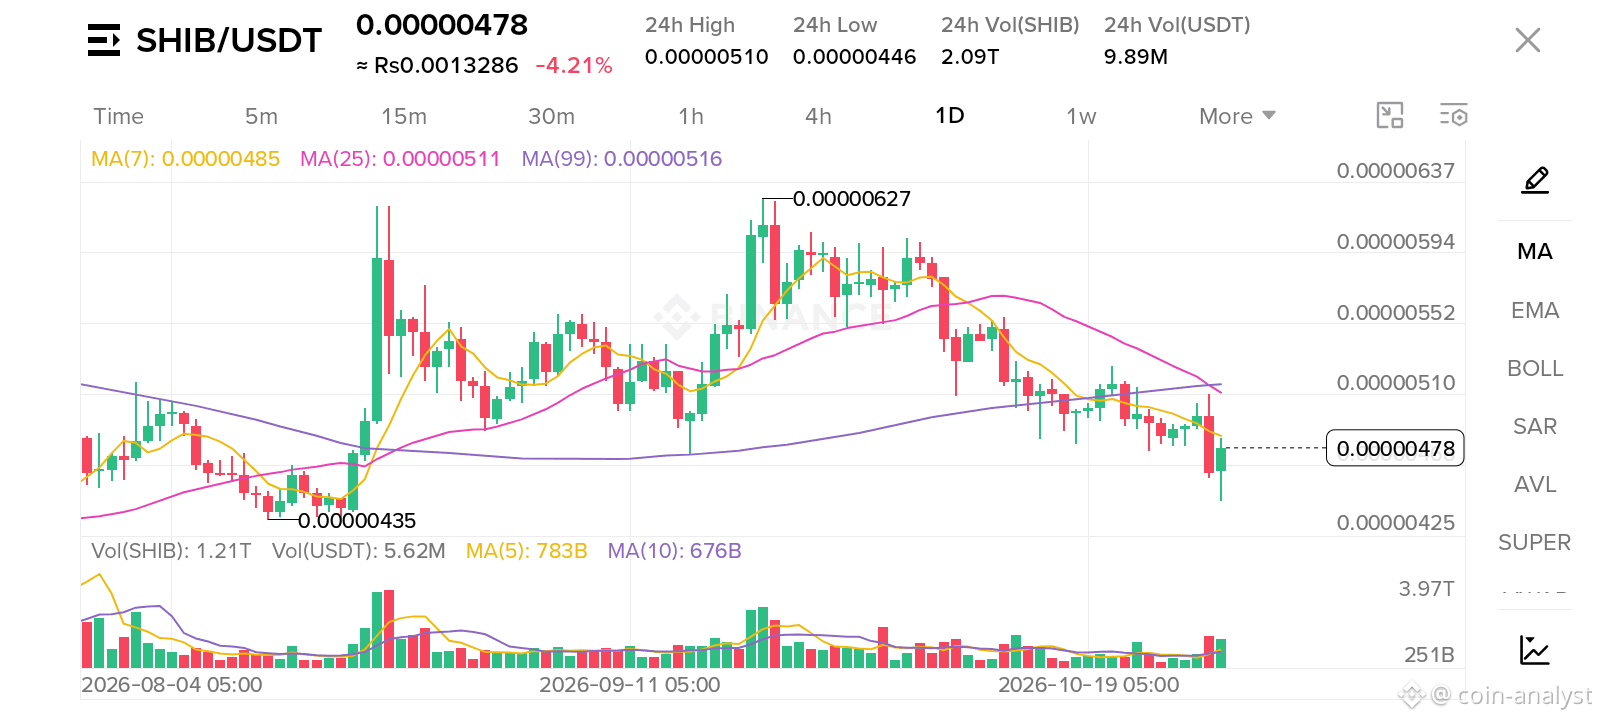
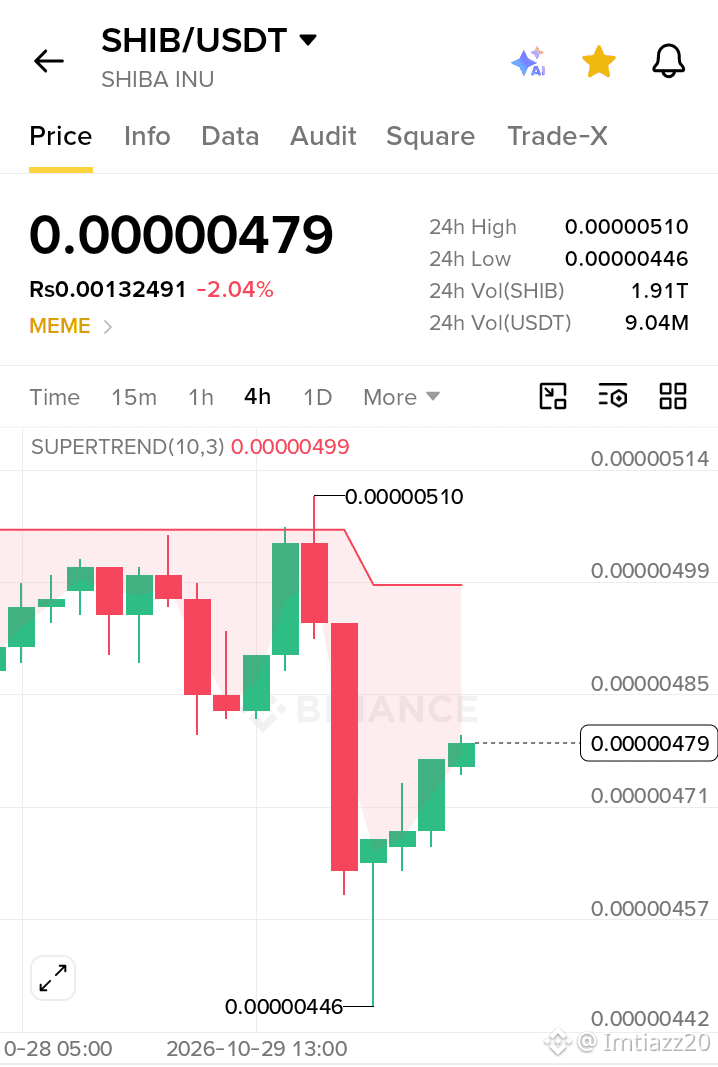
$SHIB IS BLEEDING — THE NEXT MOVE MATTERS.
Hold it → buyers still have a chance.
Reclaim $0.00000495 → strength returns.
Lose it → I stay out.
BUY THE FEAR OR WAIT? 👀
⚠️ NFA. DYOR.
#SHIB #memecoin🚀🚀🚀
{spot}(SHIBUSDT)
$SHIB IS BLEEDING — THE NEXT MOVE MATTERS.
Hold it → buyers still have a chance.
Reclaim $0.00000495 → strength returns.
Lose it → I stay out.
BUY THE FEAR OR WAIT? 👀
⚠️ NFA. DYOR.
#SHIB #memecoin🚀🚀🚀
Hold it → buyers still have a chance.
Reclaim $0.00000495 → strength returns.
Lose it → I stay out.
BUY THE FEAR OR WAIT? 👀
⚠️ NFA. DYOR.
#SHIB #memecoin🚀🚀🚀
1
177

·
--
Bullisch
Übersetzung ansehen
Just checked the $SHIB chart. Without a clear catalyst, it’s tough to see any real move higher.
The core problem is there’s no strong, unified community actually building for it.
Being decentralized is fine in theory, but it also means nobody’s willing to follow anyone else’s lead.
On top of that, the old leaders lost the #Shibarmy trust after pumping out too many tokens or using official accounts to push scams.
#SHİB #SHIB #Shibalnu #Shibarium #shiba⚡
$SHIB
{spot}(SHIBUSDT)
Just checked the $SHIB chart. Without a clear catalyst, it’s tough to see any real move higher.
The core problem is there’s no strong, unified community actually building for it.
Being decentralized is fine in theory, but it also means nobody’s willing to follow anyone else’s lead.
On top of that, the old leaders lost the #Shibarmy trust after pumping out too many tokens or using official accounts to push scams.
#SHİB #SHIB #Shibalnu #Shibarium #shiba⚡
$SHIB


30

·
--
Bärisch
Übersetzung ansehen
$SHIB is facing selling pressure as the broader crypto market weakens. Around $20 million in SHIB positions were liquidated within 24 hours, while approximately 92 billion SHIB flowed onto exchanges, suggesting increased potential selling pressure.
{spot}(SHIBUSDT)
Important price levels
Support: $0.00000448
First resistance: $0.00000490
Stronger resistance: $0.00000503
#USMidtermElections #Write2Earn #Write2Earn #SHIB
$SHIB is facing selling pressure as the broader crypto market weakens. Around $20 million in SHIB positions were liquidated within 24 hours, while approximately 92 billion SHIB flowed onto exchanges, suggesting increased potential selling pressure.
Important price levels
Support: $0.00000448
First resistance: $0.00000490
Stronger resistance: $0.00000503
#USMidtermElections #Write2Earn #Write2Earn #SHIB
Important price levels
Support: $0.00000448
First resistance: $0.00000490
Stronger resistance: $0.00000503
#USMidtermElections #Write2Earn #Write2Earn #SHIB
14

·
--
Bärisch
Übersetzung ansehen
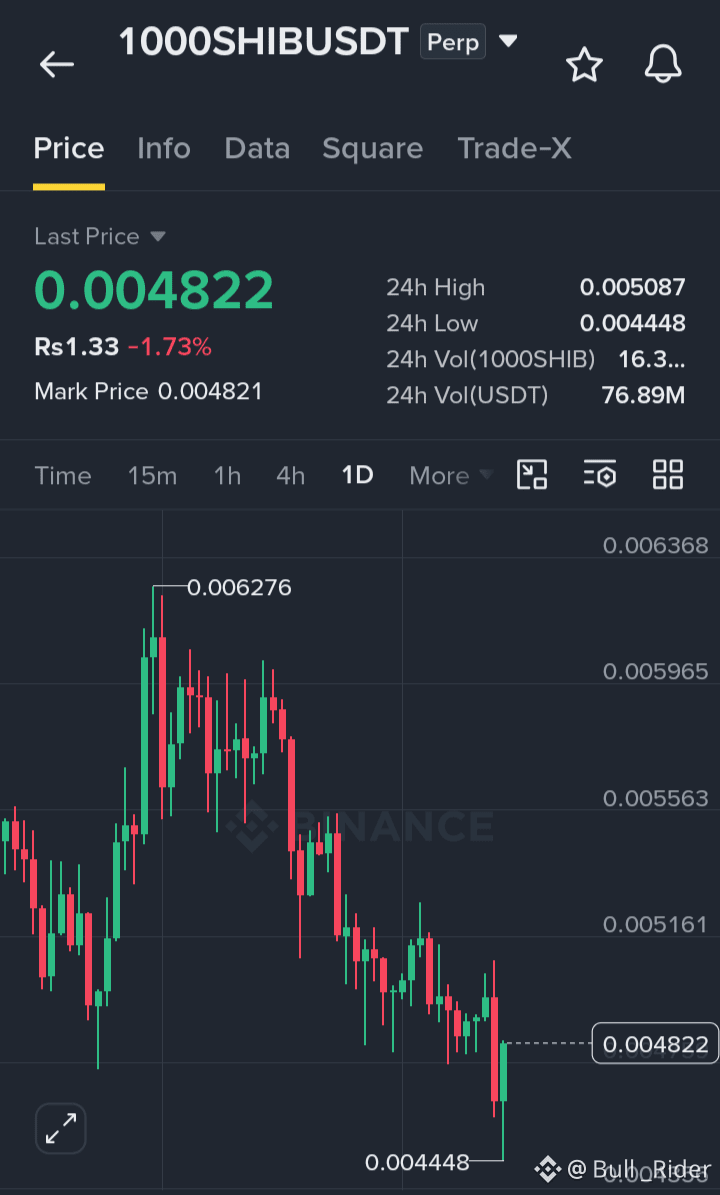
$1000SHIB is showing signs of consolidation near support at 0.004822, with buyers attempting to regain control. A breakout above nearby resistance could create an opportunity for upward momentum.
Entry: 0.004800 – 0.004850
TP1: 0.005087
TP2: 0.005161
TP3: 0.005563
SL: 0.004448
Buy and Trade $SHIB $BONK
{spot}(BONKUSDT)
#1000SHIB #SHIB #Binance
{spot}(SHIBUSDT)
{future}(1000SHIBUSDT)
$1000SHIB is showing signs of consolidation near support at 0.004822, with buyers attempting to regain control. A breakout above nearby resistance could create an opportunity for upward momentum.
Entry: 0.004800 – 0.004850
TP1: 0.005087
TP2: 0.005161
TP3: 0.005563
SL: 0.004448
Buy and Trade $SHIB $BONK
#1000SHIB #SHIB #Binance
Entry: 0.004800 – 0.004850
TP1: 0.005087
TP2: 0.005161
TP3: 0.005563
SL: 0.004448
Buy and Trade $SHIB $BONK
#1000SHIB #SHIB #Binance
1
27


Übersetzung ansehen
$SHIB: Deciphering the Leaderboard Gap
Evaluating $SHIB requires distinguishing a brief spike from a sustainable trend. Current observations show the hourly direction is up while volume remains above baseline. This suggests active participation as the price trades above 4.8e-06. However, a leaderboard ranking remains a snapshot of a single venue, not a summary of the entire market. It is vital to compare this activity with other assets to understand its isolation.
While $SHIB moves higher, ETH shows a downward hourly direction with volume not above its baseline. Simultaneously, BEAMX shares an upward hourly direction with $SHIB despite its volume remaining within normal levels. These differing hourly movements highlight the limits of same-venue comparisons. A shared direction between $SHIB and BEAMX does not prove a common cause or measured correlation. Instead, it illustrates how liquidity and sentiment fluctuate independently across different pairs.
One mechanism to watch is how price interacts with the EMA after a volume surge. If $SHIB stays above 4.73286e-06, the move might suggest buyer persistence. If it falls toward 4.66e-06 despite the high relative volume 3.2429, the initial strength might be fading. To reassess the interpretation, observe if the hourly direction remains up while RSI 70.918 stays below overbought levels. Sustained volume is often more telling than the initial direction. 📉
Probabilistic market research, not a recommendation or guaranteed return.
The comparison to keep in mind: $ETH has hourly direction down and volume not above its baseline; $BEAMX has hourly direction up and volume not above its baseline. This alone does not establish correlation.
Which matters more in this comparison: direction or how the move holds?
#SHIB #ETH #BEAMX #CryptoWatchlist #CryptoLearning
Binance spot proof for $SHIB: closed price 4.81e-06 USDT.
Source: binance. Closed candle: 2026-10-30T12:30:00+00:00.
$SHIB : Deciphering the Leaderboard Gap
Evaluating $SHIB requires distinguishing a brief spike from a sustainable trend. Current observations show the hourly direction is up while volume remains above baseline. This suggests active participation as the price trades above 4.8e-06. However, a leaderboard ranking remains a snapshot of a single venue, not a summary of the entire market. It is vital to compare this activity with other assets to understand its isolation.
While $SHIB moves higher, ETH shows a downward hourly direction with volume not above its baseline. Simultaneously, BEAMX shares an upward hourly direction with $SHIB despite its volume remaining within normal levels. These differing hourly movements highlight the limits of same-venue comparisons. A shared direction between $SHIB and BEAMX does not prove a common cause or measured correlation. Instead, it illustrates how liquidity and sentiment fluctuate independently across different pairs.
One mechanism to watch is how price interacts with the EMA after a volume surge. If $SHIB stays above 4.73286e-06, the move might suggest buyer persistence. If it falls toward 4.66e-06 despite the high relative volume 3.2429, the initial strength might be fading. To reassess the interpretation, observe if the hourly direction remains up while RSI 70.918 stays below overbought levels. Sustained volume is often more telling than the initial direction. 📉
Probabilistic market research, not a recommendation or guaranteed return.
The comparison to keep in mind: $ETH has hourly direction down and volume not above its baseline; $BEAMX has hourly direction up and volume not above its baseline. This alone does not establish correlation.
Which matters more in this comparison: direction or how the move holds?
#SHIB #ETH #BEAMX #CryptoWatchlist #CryptoLearning
Binance spot proof for $SHIB : closed price 4.81e-06 USDT.
Source: binance. Closed candle: 2026-10-30T12:30:00+00:00.
105

Übersetzung ansehen
筹码动向有变化:
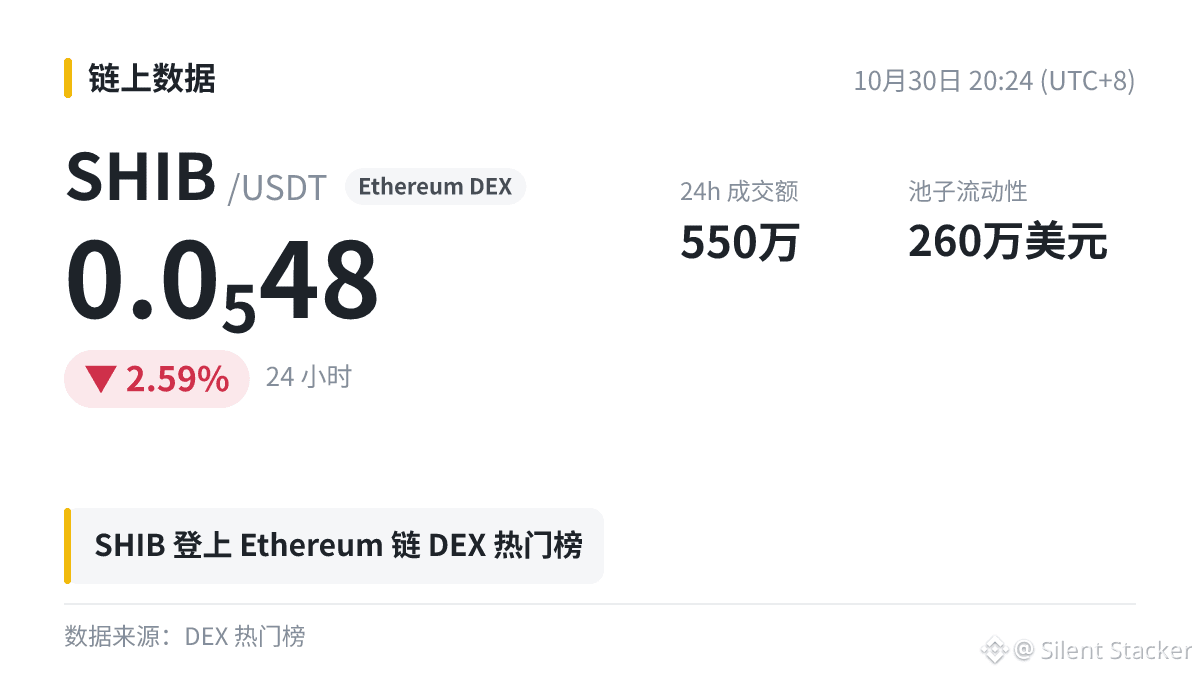
$SHIB 冲上 Ethereum DEX 热门,24h -2.59%。
DEX热门后面,往往是几个大地址在频繁交易:看前排地址是在买还是在卖,比盯K线更早。
评论区说说你的观点。
#SHIB
筹码动向有变化:
$SHIB 冲上 Ethereum DEX 热门,24h -2.59%。
DEX热门后面,往往是几个大地址在频繁交易:看前排地址是在买还是在卖,比盯K线更早。
评论区说说你的观点。
#SHIB
$SHIB 冲上 Ethereum DEX 热门,24h -2.59%。
DEX热门后面,往往是几个大地址在频繁交易:看前排地址是在买还是在卖,比盯K线更早。
评论区说说你的观点。
#SHIB
1

Übersetzung ansehen
0.05% SHIB Supply Facing Uncertain Fate
- 499.9 tỷ SHIB đang được xem xét sau khi có giao dịch từ ví được đánh dấu là exploiters
- Shiba Inu veteran cảnh báo cộng đồng về sự không chắc chắn của nguồn cung
- 0.05% tổng cung Shiba Inu hiện đang là điểm chú ý
#BinanceSquare #CryptoNews #SHIB
$shib
#vlikevn #Titanbot
Nguồn: U.Today
- 499.9 tỷ SHIB đang được xem xét sau khi có giao dịch từ ví được đánh dấu là exploiters
- Shiba Inu veteran cảnh báo cộng đồng về sự không chắc chắn của nguồn cung
- 0.05% tổng cung Shiba Inu hiện đang là điểm chú ý
#BinanceSquare #CryptoNews #SHIB
$shib
#vlikevn #Titanbot
Nguồn: U.Today
27

·
--
Übersetzung ansehen
9

·
--
Übersetzung ansehen
9

·
--
Bullisch
Übersetzung ansehen
🚨 $SHIB BEARS REMAIN IN CONTROL! CRITICAL SUPPORT UNDER PRESSURE — IS $0.00000440 NEXT?
Shiba Inu ($SHIB) is showing continued bearish weakness as sellers maintain control across multiple timeframes. The latest market data suggests that the recovery attempt is still struggling to gain momentum.
Latest Verified Market Snapshot — October 30, 2026:
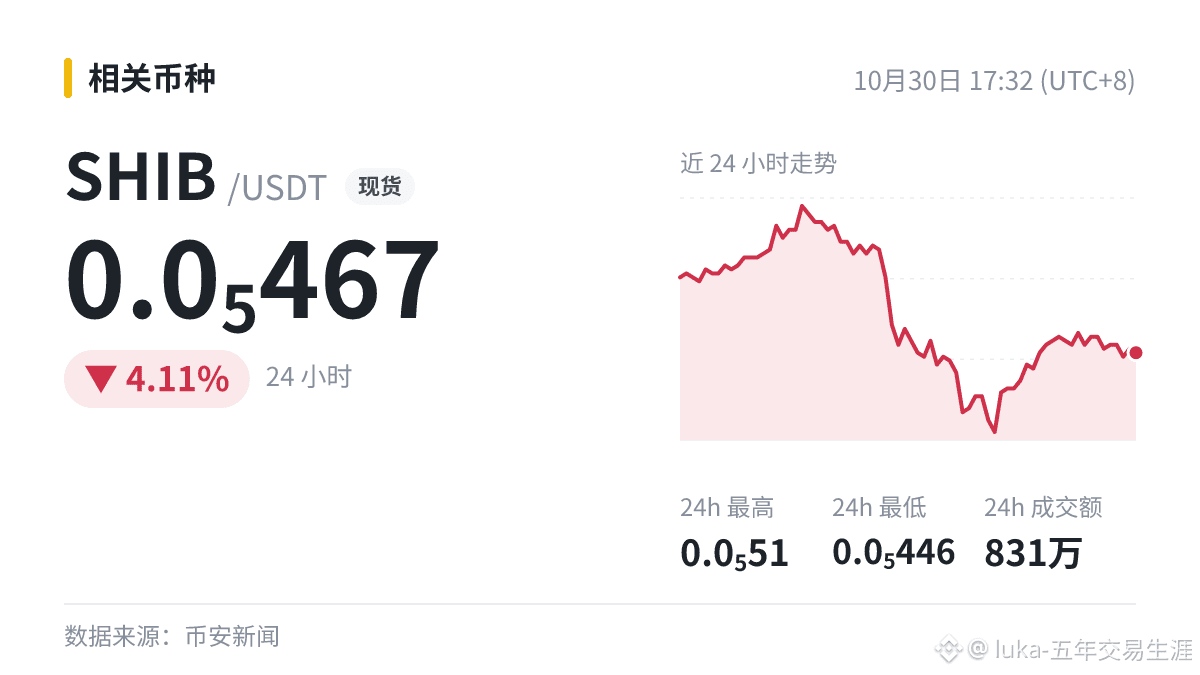
- Current Price: Approximately $0.00000467
- 24H Change: -3.71%
- Market Cap: Approximately $2.73 Billion
- 24H Trading Volume: $99.65 Million
- 24H Range: $0.00000446–$0.00000510
- 4H RSI: 34.8
- 4H Volume: 6.37x on the latest reported candle.
Key Technical Levels:
Resistance:
- $0.00000475–$0.00000480
- $0.00000491
Support:
- $0.00000457
- $0.00000446
- Next downside reference: $0.00000440
Bearish Scenario: A confirmed 4H close below $0.00000446 could increase downside pressure.
Bullish Scenario: Reclaiming $0.00000480–$0.00000491 could signal improving momentum.
The $0.00000300 level remains a deeper bearish scenario, not a confirmed target.
Will SHIB buyers defend the current zone, or will sellers push the price lower?$SHIB
{spot}(SHIBUSDT)
Not financial advice. Educational analysis only.
CHIL-WITH-CRYPTO
#SHIB #ShibaInu #CryptoTrading #TechnicalAnalysis #BinanceSquare
🚨 $SHIB BEARS REMAIN IN CONTROL! CRITICAL SUPPORT UNDER PRESSURE — IS $0.00000440 NEXT?
Shiba Inu ($SHIB ) is showing continued bearish weakness as sellers maintain control across multiple timeframes. The latest market data suggests that the recovery attempt is still struggling to gain momentum.
Latest Verified Market Snapshot — October 30, 2026:
- Current Price: Approximately $0.00000467
- 24H Change: -3.71%
- Market Cap: Approximately $2.73 Billion
- 24H Trading Volume: $99.65 Million
- 24H Range: $0.00000446–$0.00000510
- 4H RSI: 34.8
- 4H Volume: 6.37x on the latest reported candle.
Key Technical Levels:
Resistance:
- $0.00000475–$0.00000480
- $0.00000491
Support:
- $0.00000457
- $0.00000446
- Next downside reference: $0.00000440
Bearish Scenario: A confirmed 4H close below $0.00000446 could increase downside pressure.
Bullish Scenario: Reclaiming $0.00000480–$0.00000491 could signal improving momentum.
The $0.00000300 level remains a deeper bearish scenario, not a confirmed target.
Will SHIB buyers defend the current zone, or will sellers push the price lower?$SHIB
Not financial advice. Educational analysis only.
CHIL-WITH-CRYPTO
#SHIB #ShibaInu #CryptoTrading #TechnicalAnalysis #BinanceSquare
18

🚨🔥 $SHIB — STEHT DER NÄCHSTE GROSSE PUMP BEVOR? 🐕🚀
👀 Kann Shiba Inu in diesem Bullenzyklus NOCH EINE NULL STREICHEN?
💎 $SHIB pendelt um $0.0000049, und alle Augen sind auf die entscheidende Widerstandszone bei $0.0000050 gerichtet! 📊
🐂 Wenn Käufer mit starkem Momentum einsteigen, könnte das der Beginn einer größeren Erholung sein?
🔥 DIE KURSZIELE, DIE ICH IM AUGE HABE: 🎯 $0.00001 — Erster Meilenstein 🚀 🎯 $0.00005 — Bedeutendes Aufwärtspotenzial 💎 🎯 $0.0001 — Der GROSSE Traum 🌕
⚠️ Bei ungefähr 589 Billionen SHIB-Token im Umlauf wären für das Erreichen dieser Kursniveaus enormer Kaufdruck und ein deutlicher Anstieg der Marktkapitalisierung nötig. Nichts ist garantiert!
🐕 SHIB-ARMY, WAS MEINT IHR? 🔥
💬 Kann $SHIB den Markt in diesem Zyklus überraschen? 👇 Was ist EUER Kursziel? Schreibt es in die Kommentare!
🚀 BLEIBT EUREM PLAN TREU. BEHALTET DEN MARKT IM AUGE. IGNORIERT NIEMALS DAS RISIKO!
#SHIB #ShibaInu #Crypto #Altcoins #BinanceSquareTalks
{spot}(SHIBUSDT)
🚨🔥 $SHIB — STEHT DER NÄCHSTE GROSSE PUMP BEVOR? 🐕🚀
👀 Kann Shiba Inu in diesem Bullenzyklus NOCH EINE NULL STREICHEN?
💎 $SHIB pendelt um $0.0000049, und alle Augen sind auf die entscheidende Widerstandszone bei $0.0000050 gerichtet! 📊
🐂 Wenn Käufer mit starkem Momentum einsteigen, könnte das der Beginn einer größeren Erholung sein?
🔥 DIE KURSZIELE, DIE ICH IM AUGE HABE: 🎯 $0.00001 — Erster Meilenstein 🚀 🎯 $0.00005 — Bedeutendes Aufwärtspotenzial 💎 🎯 $0.0001 — Der GROSSE Traum 🌕
⚠️ Bei ungefähr 589 Billionen SHIB-Token im Umlauf wären für das Erreichen dieser Kursniveaus enormer Kaufdruck und ein deutlicher Anstieg der Marktkapitalisierung nötig. Nichts ist garantiert!
🐕 SHIB-ARMY, WAS MEINT IHR? 🔥
💬 Kann $SHIB den Markt in diesem Zyklus überraschen? 👇 Was ist EUER Kursziel? Schreibt es in die Kommentare!
🚀 BLEIBT EUREM PLAN TREU. BEHALTET DEN MARKT IM AUGE. IGNORIERT NIEMALS DAS RISIKO!
#SHIB #ShibaInu #Crypto #Altcoins #BinanceSquareTalks

146



·
--
Übersetzung ansehen
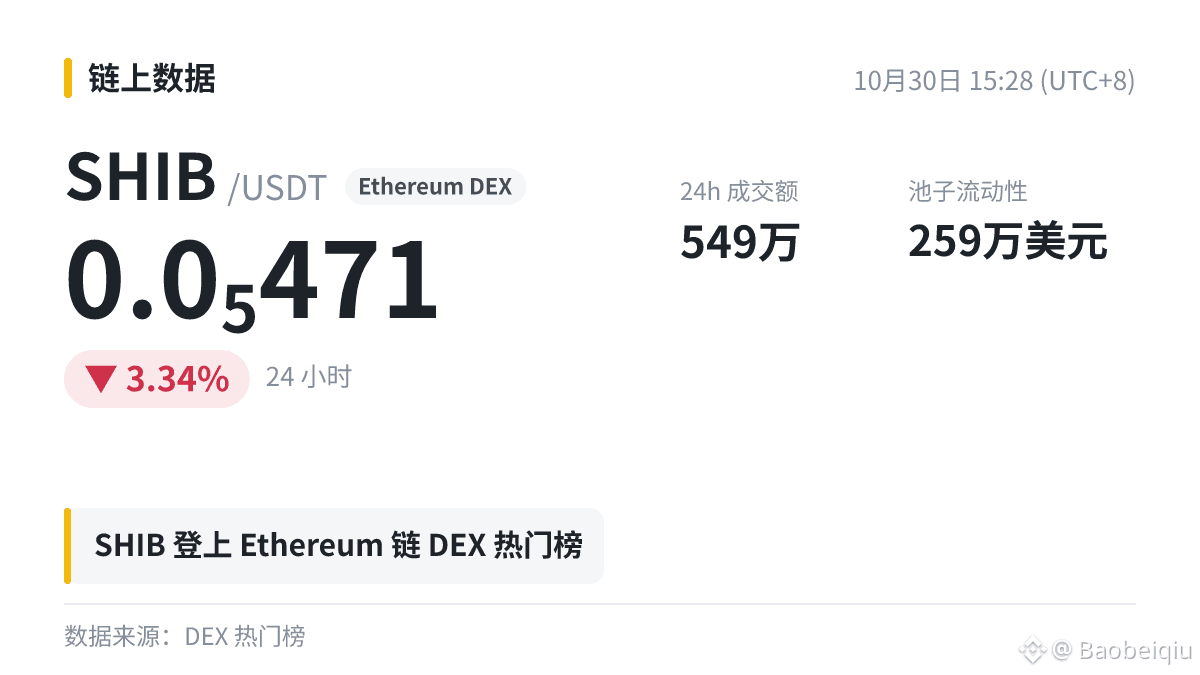
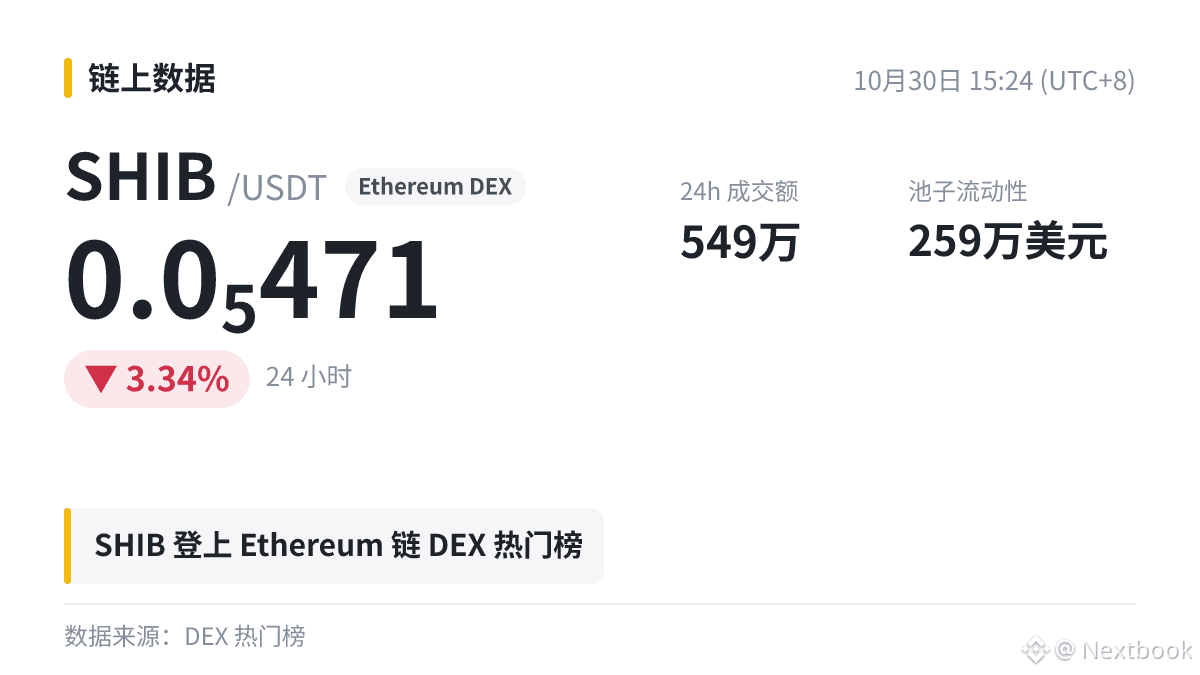
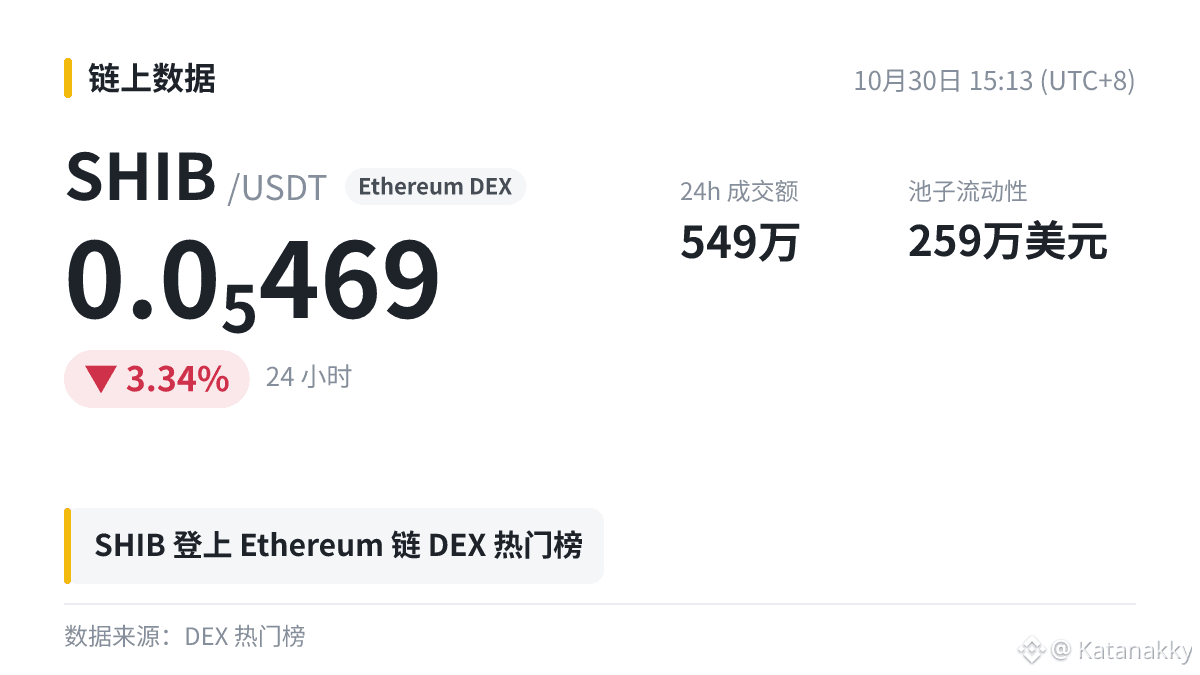
$SHIB 上了 Ethereum 链上热门第 7 名,24h -3.34%,池子 259万美元。
链上热门就像突然爆火的网红店:排队的人一天比一天长,可热度来得快,散得也快。
转给那个天天说要抄底的朋友看看。
#SHIB
随便聊的,不构成任何建议。
$SHIB 上了 Ethereum 链上热门第 7 名,24h -3.34%,池子 259万美元。
链上热门就像突然爆火的网红店:排队的人一天比一天长,可热度来得快,散得也快。
转给那个天天说要抄底的朋友看看。
#SHIB
随便聊的,不构成任何建议。
链上热门就像突然爆火的网红店:排队的人一天比一天长,可热度来得快,散得也快。
转给那个天天说要抄底的朋友看看。
#SHIB
随便聊的,不构成任何建议。
43

·
--
Übersetzung ansehen
SHIB持续承压,0.000005美元成关键关口
#SHIB 近期走势疲软。截至10月30日,其市值约27.8亿美元,排名第37位,过去24小时成交额约1.129亿美元,价格在0.00000448—0.00000508美元之间波动。过去一年,SHIB累计下跌约53.92%。目前市场恐惧与贪婪指数为30,处于恐惧区间,投资者情绪较为谨慎。
关键价位方面: 0.000005美元是重要关口。SHIB此前跌至0.00000448美元,接近年度低点,短期仍面临较大抛售压力。此外,资金流入交易所以及24小时内约920.7亿枚SHIB转入交易所,也可能增加市场卖压。
基本面方面,每周约有1.7亿枚SHIB被销毁,但相对于庞大的流通量,影响有限。Shibarium日交易量也降至约1100笔,网络活跃度明显下降。虽然SHIB扩大了支付场景,并接入Solana网络,但衍生品未平仓合约不足5000万美元,说明市场投机需求依然较弱。
12
·
--
Bullisch
Übersetzung ansehen
$SHIB is around $0.00000484 – $0.00000501, close to its 2026 low after a weak run.
The market is testing a major support zone; a breakdown would be technically negative, while a reclaim above resistance would be needed for a trend change.
#SHİB #SHIB #EarningsSeason #BinanceWillListPredictPREDICT #TwoAddressesHoldingAbout1.28BUSDTFrozen
$SHIB
{spot}(SHIBUSDT)
$SHIB is around $0.00000484 – $0.00000501, close to its 2026 low after a weak run.
The market is testing a major support zone; a breakdown would be technically negative, while a reclaim above resistance would be needed for a trend change.
#SHİB #SHIB #EarningsSeason #BinanceWillListPredictPREDICT #TwoAddressesHoldingAbout1.28BUSDTFrozen
$SHIB
The market is testing a major support zone; a breakdown would be technically negative, while a reclaim above resistance would be needed for a trend change.
#SHİB #SHIB #EarningsSeason #BinanceWillListPredictPREDICT #TwoAddressesHoldingAbout1.28BUSDTFrozen
$SHIB

2
25
Anmelden und weiter Inhalte entdecken
Krypto-Nutzer weltweit auf Binance Square kennenlernen
⚡️ Bleib in Sachen Krypto stets am Puls.
💬 Die weltgrößte Kryptobörse vertraut darauf.
👍 Erhalte verlässliche Einblicke von verifizierten Creators.
E-Mail-Adresse/Telefonnummer
Trendthemen
1
#UniswapA16zSeekDeFiExemptionFromIllinoisCryptoTax
9,418 Aufrufe
431 Kommentare
2
#HKDollarStablecoinHKDAPToLaunchOnSolana
5,022 Aufrufe
248 Kommentare
3
#$1.5BInLeveragedCryptoBetsLiquidated
20,565 Aufrufe
200 Kommentare
4
#TrezorSaysCryptoBilisSoldWalletMayContainMaliciousComponents
1,024 Aufrufe
39 Kommentare
5
#KOSPIFalls3.53%BackBelow6000
46,150 Aufrufe
912 Kommentare
6
#AmazonSharesFallAbout7%InPremarketTrading
19,339 Aufrufe
479 Kommentare
7
#USMidtermElections
193,628 Aufrufe
2,171 Kommentare
8
#StrategySTRCReaches$99.95ForFirstTimeIn165Days
11,611 Aufrufe
91 Kommentare
9
#BinanceWillListPredictPREDICT
69,348 Aufrufe
1,237 Kommentare
10
#SwitzerlandFirstSpotBitcoinETFExpectedToTradeInNovember
2,364 Aufrufe
102 Kommentare