
#nearanalysis
nearanalysis
7,201 Aufrufe
34 Kommentare
Hot
Zuletzt

Artikel
Übersetzung ansehen
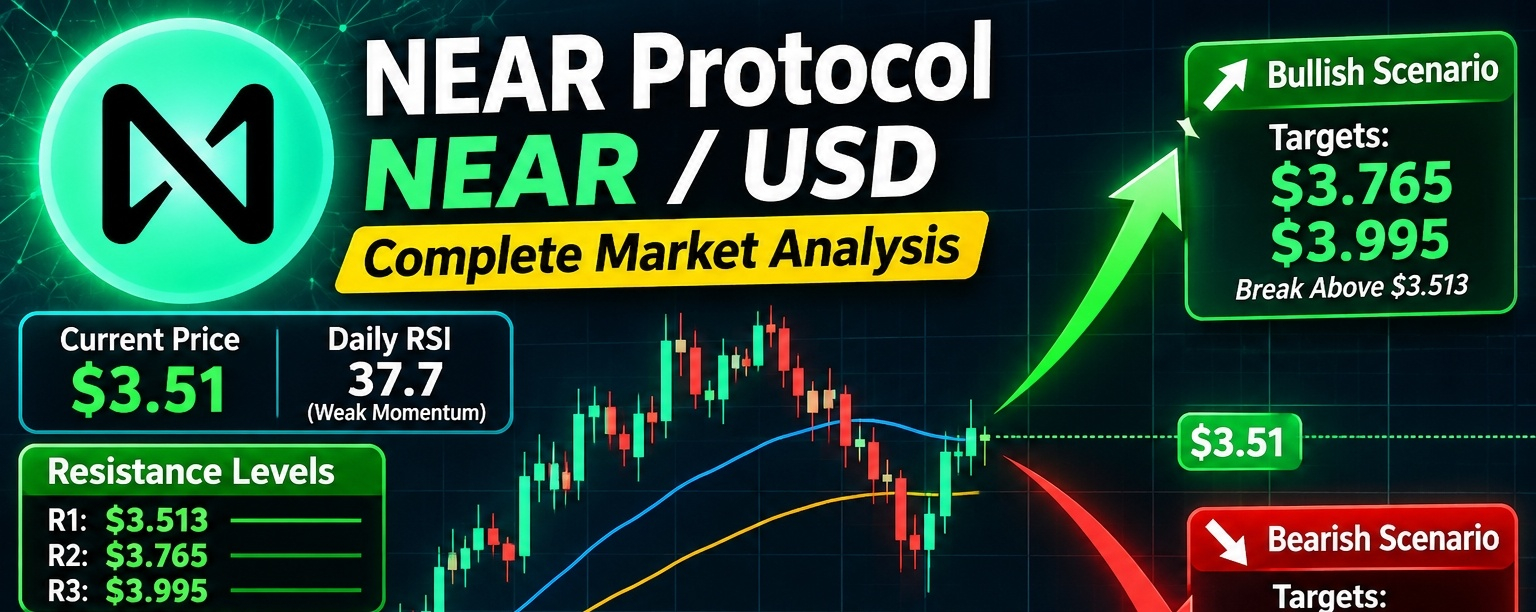
NEAR Protocol (NEAR/USD) – Complete Market Analysis$NEAR Protocol (NEAR/USD) – Complete Market Analysis
### NEAR / USD
Cryptocurrency market analysis
$NEAR Protocol is a Layer-1 blockchain designed for scalability, low transaction costs, and decentralized applications. Its ecosystem also focuses on chain abstraction and AI-related blockchain infrastructure.
{spot}(NEARUSDT)
This analysis covers market direction, technical indicators, support and resistance, bullish and bearish scenarios, and possible trading strategies.
### 1\. Current market overview
November 13, 2026 market data
NEAR reference price
### $3.51
Approximate spot price
Daily RSI
### 37.7
Weak momentum zone
First resistance
### $3.513
First support
### $3.262
Reference figures from November 13 technical data; prices change continuously. COINOTAG +1
### 2\. Technical analysis
RSI (Relative Strength Index)
* Daily RSI: 37.7.
* Weekly RSI: 53.
* Daily momentum is weak.
* Weekly momentum is relatively stronger.
* A recovery above 50 on the daily RSI would improve the bullish outlook.
Moving averages
The technical picture is mixed. Shorter-term averages show some buying signals, while several longer-term averages remain bearish. Investing.com India +1
MACD
The Investing.com indicator snapshot reports a sell signal for MACD. This suggests that bullish momentum has not been firmly established. Investing.com India
### 3\. Important support and resistance levels
Resistance levels
Major resistance 3
$3.995
Resistance 2
$3.765
Immediate resistance
$3.513
Current reference price
### $3.51
Support levels
Immediate support
$3.262
Support 2
$3.057
Major support 3
$2.827
Technical reference levels, not guaranteed price targets. COINOTAG
### 4\. Bullish scenario
If $NEAR breaks above $3.513 and maintains that level with strong trading volume:
* First target: $3.765.
* Second target: $3.995.
* Further upside requires a convincing breakout above $4.00.
A daily candle close above $3.765 would strengthen the bullish structure.
### 5\. Bearish scenario
If NEAR fails to hold its support:
* First downside target: $3.262.
* Second downside target: $3.057.
* Major downside support: $2.827.
A daily close below $3.262 would weaken the recovery setup considerably.
### 6\. Fundamental analysis
NEAR has several important developments:
* Tokenomics: Governance approved a proposal to reduce maximum annual token issuance from 2.5% to 1.6% over 24 months. It still requires further implementation steps. The Block
* NEAR Intents: The protocol is expanding cross-chain transaction infrastructure.
* AI infrastructure: NEAR is positioning itself for AI agents and programmable financial services.
* Buybacks: NEAR's February 2026 fee-switch activation introduced protocol revenue-funded token buybacks. Tokenomics, Stack, and Roadmap
These developments could support long-term demand, but adoption and actual revenue growth must continue.
### 7\. Trading strategy
| Strategy | Entry / confirmation |
| ----------------- | ----------------------------- |
| Aggressive buy | Near $3.26 after confirmation |
| Breakout buy | Above $3.52 |
| Stronger breakout | Above $3.77 |
| Profit target 1 | $3.765 |
| Profit target 2 | $3.995 |
| Risk warning | Daily close below $3.262 |
These are illustrative setups, not guaranteed trades. Use stop-losses and avoid excessive leverage.
### 8\. Overall market outlook
NEAR/USD market assessment
Mixed / cautious
* Short-term: Bearish pressure and volatility.
* Medium-term: Recovery possible above resistance.
* Long-term: Fundamental potential, subject to adoption.
* Key bullish trigger: Break above $3.513.
* Key bearish trigger: Break below $3.262.
My conclusion: NEAR is approaching an important decision area around $3.51. I would avoid chasing a trade without confirmation. Watch $3.513 for a bullish breakout and $3.262 for downside risk.
This is market analysis, not financial advice. Always verify live Binance prices before entering a trade.
Sources for further research
I can also create a professional NEAR/USD trading infographic showing the support, resistance, bullish targets, and bearish targets.
#NEAR🚀🚀🚀 #NEARUSDT #NEARAnalysis #TrendingPredictions
NEAR Protocol (NEAR/USD) – Complete Market Analysis
$NEAR Protocol (NEAR/USD) – Complete Market Analysis
### NEAR / USD
Cryptocurrency market analysis
$NEAR Protocol is a Layer-1 blockchain designed for scalability, low transaction costs, and decentralized applications. Its ecosystem also focuses on chain abstraction and AI-related blockchain infrastructure.
This analysis covers market direction, technical indicators, support and resistance, bullish and bearish scenarios, and possible trading strategies.
### 1\. Current market overview
November 13, 2026 market data
NEAR reference price
### $3.51
Approximate spot price
Daily RSI
### 37.7
Weak momentum zone
First resistance
### $3.513
First support
### $3.262
Reference figures from November 13 technical data; prices change continuously. COINOTAG +1
### 2\. Technical analysis
RSI (Relative Strength Index)
* Daily RSI: 37.7.
* Weekly RSI: 53.
* Daily momentum is weak.
* Weekly momentum is relatively stronger.
* A recovery above 50 on the daily RSI would improve the bullish outlook.
Moving averages
The technical picture is mixed. Shorter-term averages show some buying signals, while several longer-term averages remain bearish. Investing.com India +1
MACD
The Investing.com indicator snapshot reports a sell signal for MACD. This suggests that bullish momentum has not been firmly established. Investing.com India
### 3\. Important support and resistance levels
Resistance levels
Major resistance 3
$3.995
Resistance 2
$3.765
Immediate resistance
$3.513
Current reference price
### $3.51
Support levels
Immediate support
$3.262
Support 2
$3.057
Major support 3
$2.827
Technical reference levels, not guaranteed price targets. COINOTAG
### 4\. Bullish scenario
If $NEAR breaks above $3.513 and maintains that level with strong trading volume:
* First target: $3.765.
* Second target: $3.995.
* Further upside requires a convincing breakout above $4.00.
A daily candle close above $3.765 would strengthen the bullish structure.
### 5\. Bearish scenario
If NEAR fails to hold its support:
* First downside target: $3.262.
* Second downside target: $3.057.
* Major downside support: $2.827.
A daily close below $3.262 would weaken the recovery setup considerably.
### 6\. Fundamental analysis
NEAR has several important developments:
* Tokenomics: Governance approved a proposal to reduce maximum annual token issuance from 2.5% to 1.6% over 24 months. It still requires further implementation steps. The Block
* NEAR Intents: The protocol is expanding cross-chain transaction infrastructure.
* AI infrastructure: NEAR is positioning itself for AI agents and programmable financial services.
* Buybacks: NEAR's February 2026 fee-switch activation introduced protocol revenue-funded token buybacks. Tokenomics, Stack, and Roadmap
These developments could support long-term demand, but adoption and actual revenue growth must continue.
### 7\. Trading strategy
| Strategy | Entry / confirmation |
| ----------------- | ----------------------------- |
| Aggressive buy | Near $3.26 after confirmation |
| Breakout buy | Above $3.52 |
| Stronger breakout | Above $3.77 |
| Profit target 1 | $3.765 |
| Profit target 2 | $3.995 |
| Risk warning | Daily close below $3.262 |
These are illustrative setups, not guaranteed trades. Use stop-losses and avoid excessive leverage.
### 8\. Overall market outlook
NEAR/USD market assessment
Mixed / cautious
* Short-term: Bearish pressure and volatility.
* Medium-term: Recovery possible above resistance.
* Long-term: Fundamental potential, subject to adoption.
* Key bullish trigger: Break above $3.513.
* Key bearish trigger: Break below $3.262.
My conclusion: NEAR is approaching an important decision area around $3.51. I would avoid chasing a trade without confirmation. Watch $3.513 for a bullish breakout and $3.262 for downside risk.
This is market analysis, not financial advice. Always verify live Binance prices before entering a trade.
Sources for further research
I can also create a professional NEAR/USD trading infographic showing the support, resistance, bullish targets, and bearish targets.
#NEAR🚀🚀🚀 #NEARUSDT #NEARAnalysis #TrendingPredictions
### NEAR / USD
Cryptocurrency market analysis
$NEAR Protocol is a Layer-1 blockchain designed for scalability, low transaction costs, and decentralized applications. Its ecosystem also focuses on chain abstraction and AI-related blockchain infrastructure.
This analysis covers market direction, technical indicators, support and resistance, bullish and bearish scenarios, and possible trading strategies.
### 1\. Current market overview
November 13, 2026 market data
NEAR reference price
### $3.51
Approximate spot price
Daily RSI
### 37.7
Weak momentum zone
First resistance
### $3.513
First support
### $3.262
Reference figures from November 13 technical data; prices change continuously. COINOTAG +1
### 2\. Technical analysis
RSI (Relative Strength Index)
* Daily RSI: 37.7.
* Weekly RSI: 53.
* Daily momentum is weak.
* Weekly momentum is relatively stronger.
* A recovery above 50 on the daily RSI would improve the bullish outlook.
Moving averages
The technical picture is mixed. Shorter-term averages show some buying signals, while several longer-term averages remain bearish. Investing.com India +1
MACD
The Investing.com indicator snapshot reports a sell signal for MACD. This suggests that bullish momentum has not been firmly established. Investing.com India
### 3\. Important support and resistance levels
Resistance levels
Major resistance 3
$3.995
Resistance 2
$3.765
Immediate resistance
$3.513
Current reference price
### $3.51
Support levels
Immediate support
$3.262
Support 2
$3.057
Major support 3
$2.827
Technical reference levels, not guaranteed price targets. COINOTAG
### 4\. Bullish scenario
If $NEAR breaks above $3.513 and maintains that level with strong trading volume:
* First target: $3.765.
* Second target: $3.995.
* Further upside requires a convincing breakout above $4.00.
A daily candle close above $3.765 would strengthen the bullish structure.
### 5\. Bearish scenario
If NEAR fails to hold its support:
* First downside target: $3.262.
* Second downside target: $3.057.
* Major downside support: $2.827.
A daily close below $3.262 would weaken the recovery setup considerably.
### 6\. Fundamental analysis
NEAR has several important developments:
* Tokenomics: Governance approved a proposal to reduce maximum annual token issuance from 2.5% to 1.6% over 24 months. It still requires further implementation steps. The Block
* NEAR Intents: The protocol is expanding cross-chain transaction infrastructure.
* AI infrastructure: NEAR is positioning itself for AI agents and programmable financial services.
* Buybacks: NEAR's February 2026 fee-switch activation introduced protocol revenue-funded token buybacks. Tokenomics, Stack, and Roadmap
These developments could support long-term demand, but adoption and actual revenue growth must continue.
### 7\. Trading strategy
| Strategy | Entry / confirmation |
| ----------------- | ----------------------------- |
| Aggressive buy | Near $3.26 after confirmation |
| Breakout buy | Above $3.52 |
| Stronger breakout | Above $3.77 |
| Profit target 1 | $3.765 |
| Profit target 2 | $3.995 |
| Risk warning | Daily close below $3.262 |
These are illustrative setups, not guaranteed trades. Use stop-losses and avoid excessive leverage.
### 8\. Overall market outlook
NEAR/USD market assessment
Mixed / cautious
* Short-term: Bearish pressure and volatility.
* Medium-term: Recovery possible above resistance.
* Long-term: Fundamental potential, subject to adoption.
* Key bullish trigger: Break above $3.513.
* Key bearish trigger: Break below $3.262.
My conclusion: NEAR is approaching an important decision area around $3.51. I would avoid chasing a trade without confirmation. Watch $3.513 for a bullish breakout and $3.262 for downside risk.
This is market analysis, not financial advice. Always verify live Binance prices before entering a trade.
Sources for further research
I can also create a professional NEAR/USD trading infographic showing the support, resistance, bullish targets, and bearish targets.
#NEAR🚀🚀🚀 #NEARUSDT #NEARAnalysis #TrendingPredictions
48

·
--
Bullisch
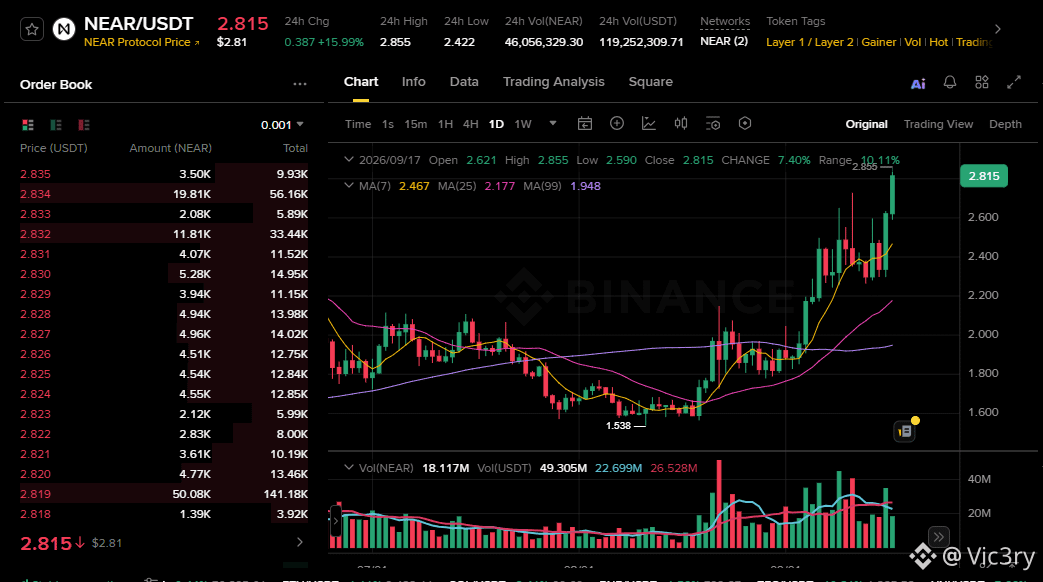
$NEAR gerade erst von etwa 2,33 $ auf 2,70 $ gepusht, mit einem 24H-Volumen von rund 694 Mio. $.
Wenn es die Bewegung nicht zurückgibt und anfängt, eine flache Korrektur nahe den Hochs zu bilden, könnten wir ein weiteres Ausbruch-Setup bekommen.
Ich beobachte 2,50–2,60 $ für die Reaktion.
Wenn Käufer diesen Bereich verteidigen, werde ich auf 2,70 $ und dann 3,00 $ achten.
Verliert es 2,50 $, würde ich lieber auf ein klareres Setup warten.
$NEAR hat im Moment Momentum.
Jetzt möchte ich sehen, ob Käufer diese Bewegung in eine Fortsetzung verwandeln können. 👀
{spot}(NEARUSDT)
#NEARAnalysis
$NEAR gerade erst von etwa 2,33 $ auf 2,70 $ gepusht, mit einem 24H-Volumen von rund 694 Mio. $.
Wenn es die Bewegung nicht zurückgibt und anfängt, eine flache Korrektur nahe den Hochs zu bilden, könnten wir ein weiteres Ausbruch-Setup bekommen.
Ich beobachte 2,50–2,60 $ für die Reaktion.
Wenn Käufer diesen Bereich verteidigen, werde ich auf 2,70 $ und dann 3,00 $ achten.
Verliert es 2,50 $, würde ich lieber auf ein klareres Setup warten.
$NEAR hat im Moment Momentum.
Jetzt möchte ich sehen, ob Käufer diese Bewegung in eine Fortsetzung verwandeln können. 👀
#NEARAnalysis
Wenn es die Bewegung nicht zurückgibt und anfängt, eine flache Korrektur nahe den Hochs zu bilden, könnten wir ein weiteres Ausbruch-Setup bekommen.
Ich beobachte 2,50–2,60 $ für die Reaktion.
Wenn Käufer diesen Bereich verteidigen, werde ich auf 2,70 $ und dann 3,00 $ achten.
Verliert es 2,50 $, würde ich lieber auf ein klareres Setup warten.
$NEAR hat im Moment Momentum.
Jetzt möchte ich sehen, ob Käufer diese Bewegung in eine Fortsetzung verwandeln können. 👀
#NEARAnalysis
1
38

·
--
Bullisch
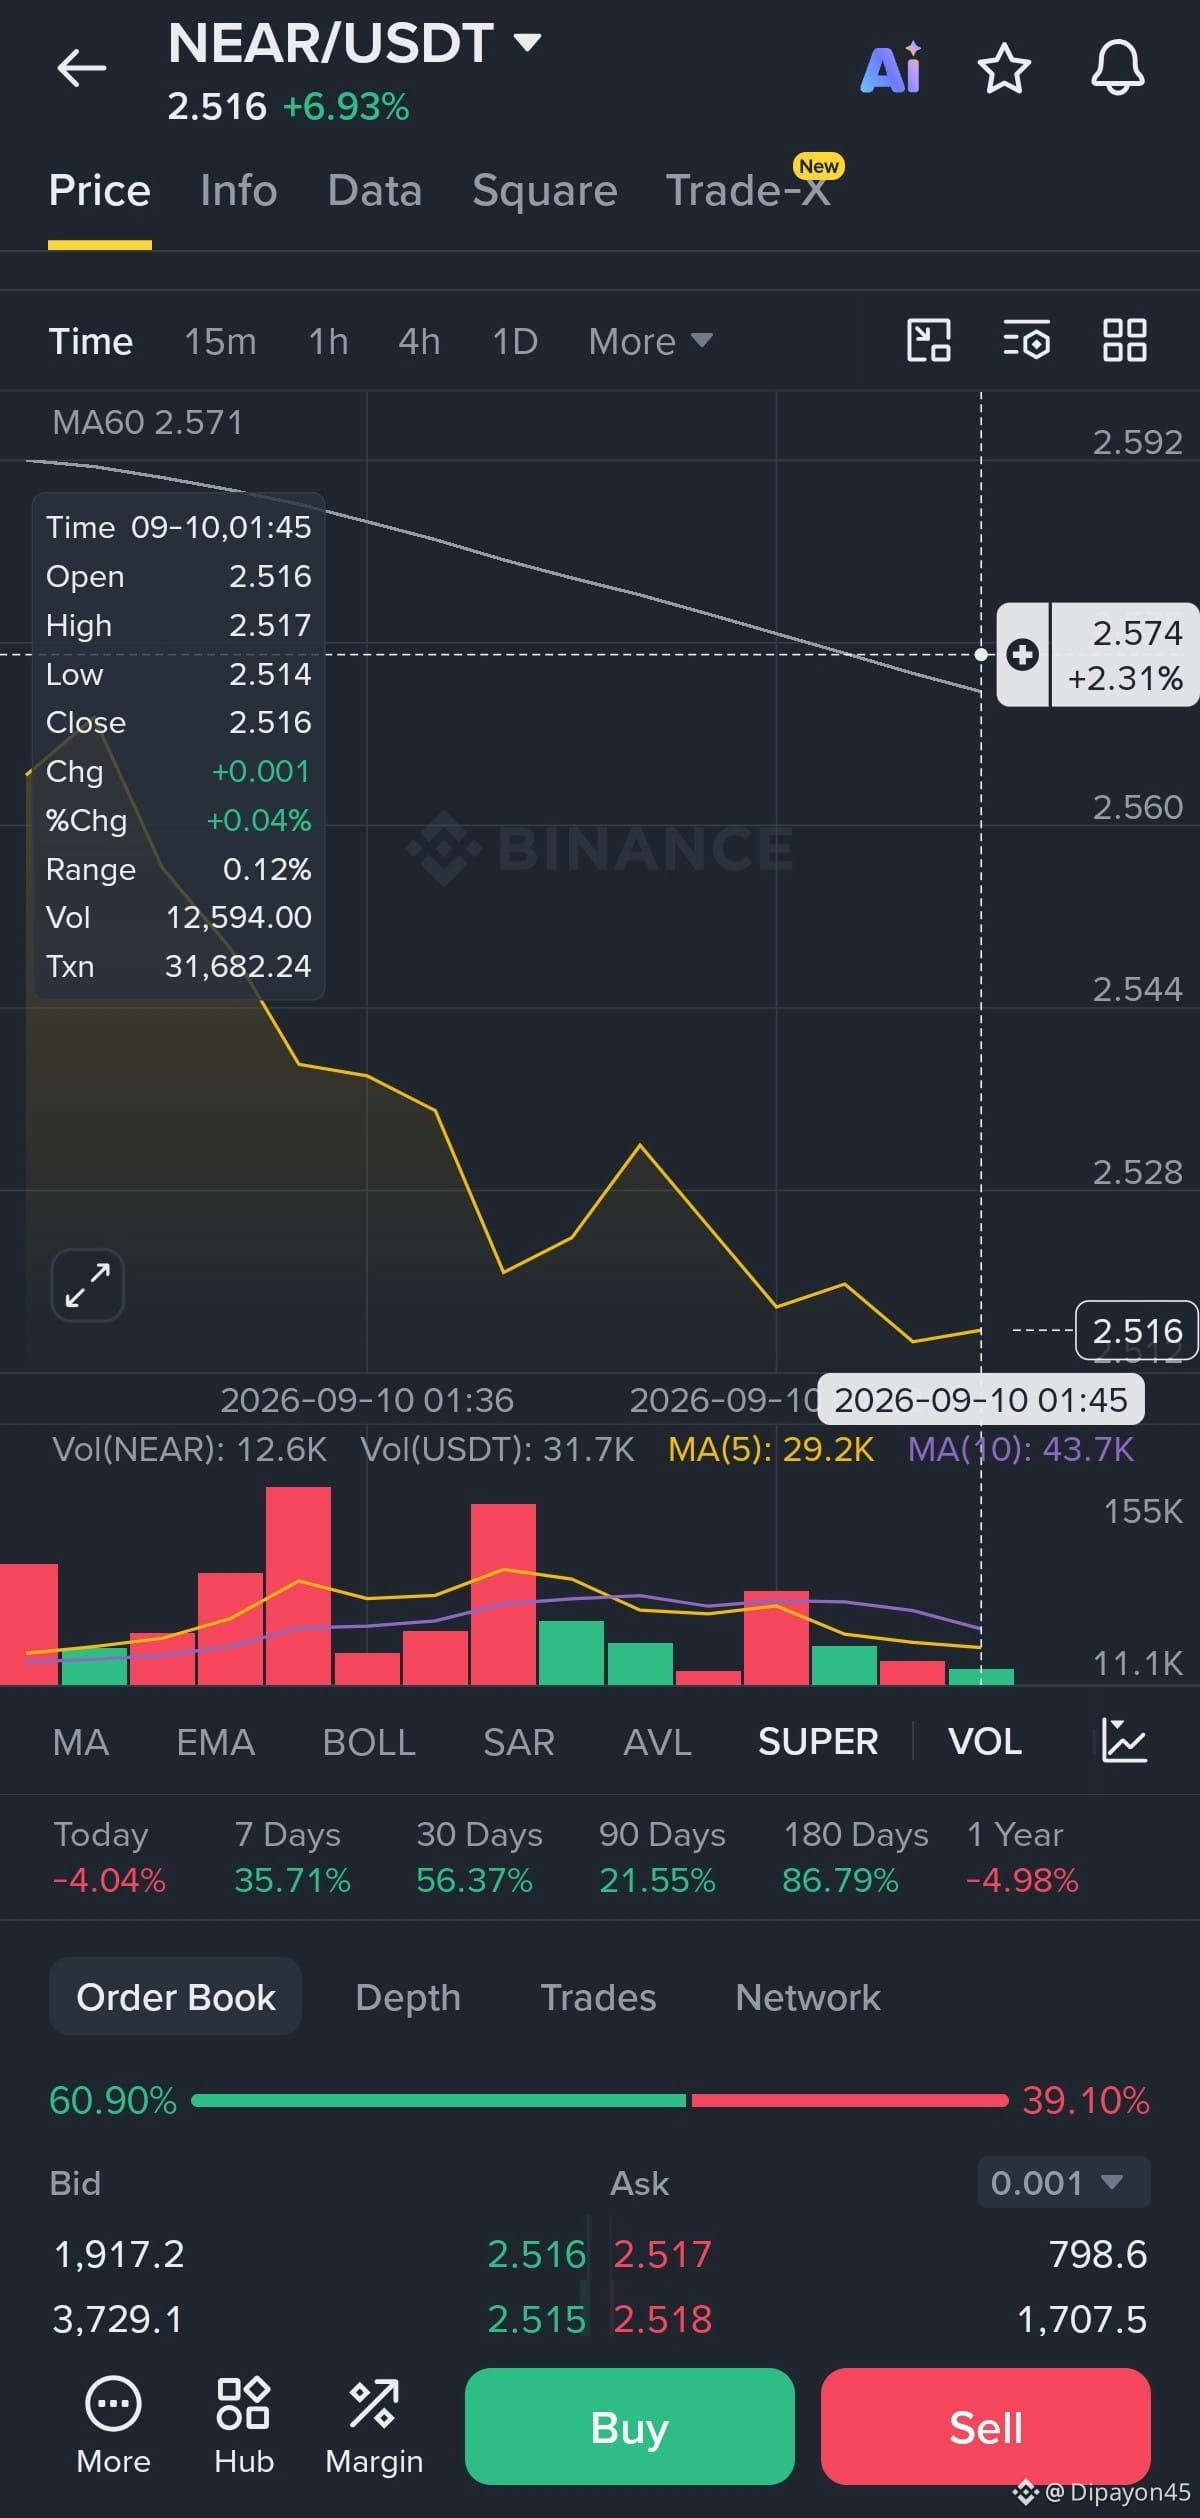
NEAR/USDT liegt jetzt bei 2,516 USDT und verzeichnet einen Anstieg von +6,93%. Das Beste daran: Es ist in 7 Tagen um +35,71%, in 30 Tagen um +56,37% und in 180 Tagen um +86,79% gestiegen – das heißt, es zeigt eine starke Performance über den langen Zeitraum hinweg.
$NEAR
#NEARAnalysis
{future}(NEARUSDT)
NEAR/USDT liegt jetzt bei 2,516 USDT und verzeichnet einen Anstieg von +6,93%. Das Beste daran: Es ist in 7 Tagen um +35,71%, in 30 Tagen um +56,37% und in 180 Tagen um +86,79% gestiegen – das heißt, es zeigt eine starke Performance über den langen Zeitraum hinweg.
$NEAR
#NEARAnalysis
$NEAR
#NEARAnalysis
96

·
--
Artikel
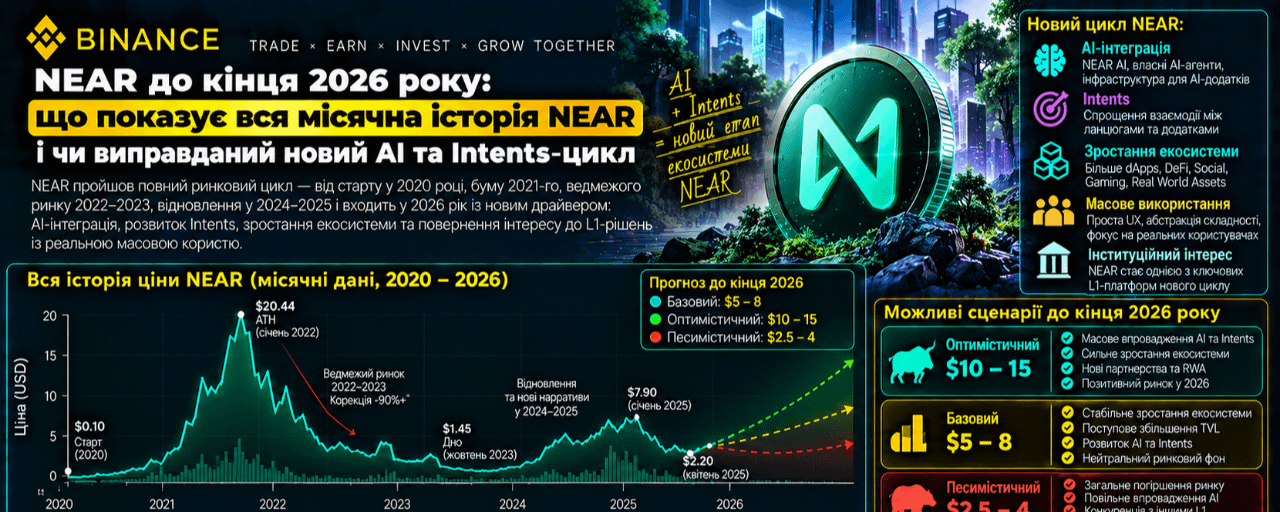
NEAR bis Ende 2026: Was die gesamte monatliche Historie von NEAR zeigt und ob der neue KI- und Intents-Ansatz gerechtfertigt istNEAR geht in die finale Phase des Jahres 2026 über, nachdem es zu den stärksten Neubewertungen in seiner gesamten Geschichte gehört hat.
Stand 27. September wird NEAR ungefähr gehandelt bei:
$5,0–5,2.
Und Anfang September kostete der Token etwa:
$1,93.
Das heißt, nur innerhalb eines unvollständigen Monats ist NEAR um ungefähr gestiegen auf:
+150%.
Seit Anfang 2026 liegt das Ergebnis bereits bei über:
NEAR bis Ende 2026: Was die gesamte monatliche Historie von NEAR zeigt und ob der neue KI- und Intents-Ansatz gerechtfertigt ist
NEAR geht in die finale Phase des Jahres 2026 über, nachdem es zu den stärksten Neubewertungen in seiner gesamten Geschichte gehört hat.
Stand 27. September wird NEAR ungefähr gehandelt bei:
$5,0–5,2.
Und Anfang September kostete der Token etwa:
$1,93.
Das heißt, nur innerhalb eines unvollständigen Monats ist NEAR um ungefähr gestiegen auf:
+150%.
Seit Anfang 2026 liegt das Ergebnis bereits bei über:
Stand 27. September wird NEAR ungefähr gehandelt bei:
$5,0–5,2.
Und Anfang September kostete der Token etwa:
$1,93.
Das heißt, nur innerhalb eines unvollständigen Monats ist NEAR um ungefähr gestiegen auf:
+150%.
Seit Anfang 2026 liegt das Ergebnis bereits bei über:
2
1.7k
Anmelden und weiter Inhalte entdecken
Krypto-Nutzer weltweit auf Binance Square kennenlernen
⚡️ Bleib in Sachen Krypto stets am Puls.
💬 Die weltgrößte Kryptobörse vertraut darauf.
👍 Erhalte verlässliche Einblicke von verifizierten Creators.
E-Mail-Adresse/Telefonnummer
Trendthemen
1
#USPPIMissMayEaseBTCPressure
14,208 Aufrufe
427 Kommentare
2
#BitcoinCoreDisclosesTorTrafficVulnerability
3,533 Aufrufe
171 Kommentare
3
#WhatWillDriveCryptoandStocks’NextRebound?
110,682 Aufrufe
1,372 Kommentare
4
#BitcoinBreaksBelow200WeekMovingAverage
26,604 Aufrufe
354 Kommentare
5
#SpaceXTeslaMergerTalksWouldCombine30220BTC
9,300 Aufrufe
186 Kommentare
6
#Anthropic’s6xIPODemandSignalsPotentialRecordRaise
36,503 Aufrufe
624 Kommentare
7
#USCryptoETFsLose$1.48BInFiveDays
1,699 Aufrufe
37 Kommentare
8
#KoreaDigitalAssetBasicActFinalDraftExpectedEarlyJanuary
3,304 Aufrufe
18 Kommentare
9
#RippleRLUSDMarketCapSurpassesPayPalPYUSD
5,027 Aufrufe
107 Kommentare
10
#JaneStreetNearlyOctuplesFidelityBitcoinETFHoldings
13,455 Aufrufe
218 Kommentare