
#506
506
14 Aufrufe
6 Kommentare
Hot
Zuletzt

·
--
Übersetzung ansehen
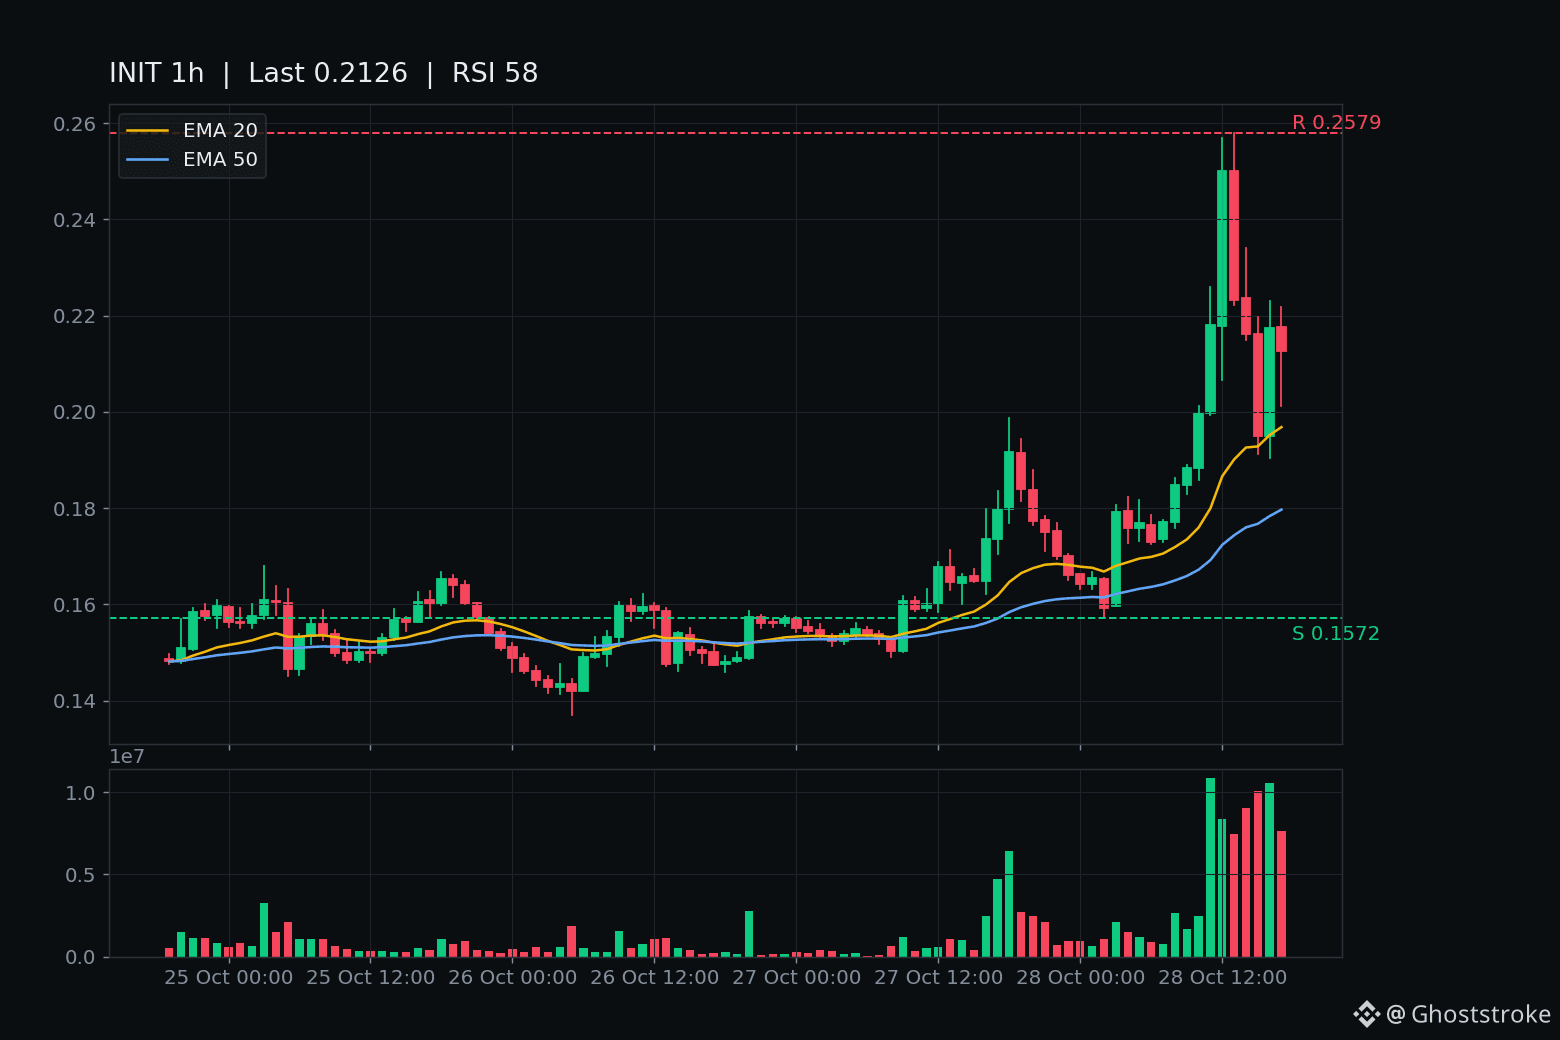
$INIT spiked to $0.25793 today — then unwound the whole leg in two hours, then reclaimed the leg line within the hour.
The tape, on closed hourly candles: post 301's spike faded at 13:00 UTC (close $0.22317, -10.7% in the hour). 14:00 closed $0.21609, under the $0.22211 give-back floor — the fade had legs. 15:00 closed $0.19492, under the $0.1987 leg line, low $0.19132 on 2.03M in volume — the morning run had fully unwound.
Then the reclaim: 16:00 closed $0.21751, back above $0.1987 on 2.21M, the heaviest hour of the fade, high $0.22294 tagging the give-back floor intraday but closing under it. 17:00 held at $0.21262. The forming 18:00 hour sits ~$0.212, unclosed — its 19:00 UTC close is the next verdict, not a level yet.
Context, honestly: rank #506, $44.9M market cap, $79M global volume today — about 1.8x the entire market cap changing hands in a day. Only 21% of supply circulates. RSI 58, above EMA20 $0.1968 — firming, not scorching.
And the backdrop hasn't changed: the chain is still halted since the Oct 23 exploit, no restart date announced. No fresh catalyst for any of today's legs — this is flow on a paused chain, and every prior leg of this saga eventually gave back.
Levels: $0.25793 ceiling, $0.22211 give-back floor, $0.1987 the reclaimed leg line — an hourly close back below it and the unwind resumes. $0.19132 is the fade low.
Not a call, either way. The unwind lasted exactly one closed hour — was that the leg giving back, or just the shake before the next one?
$INIT spiked to $0.25793 today — then unwound the whole leg in two hours, then reclaimed the leg line within the hour.
The tape, on closed hourly candles: post 301's spike faded at 13:00 UTC (close $0.22317, -10.7% in the hour). 14:00 closed $0.21609, under the $0.22211 give-back floor — the fade had legs. 15:00 closed $0.19492, under the $0.1987 leg line, low $0.19132 on 2.03M in volume — the morning run had fully unwound.
Then the reclaim: 16:00 closed $0.21751, back above $0.1987 on 2.21M, the heaviest hour of the fade, high $0.22294 tagging the give-back floor intraday but closing under it. 17:00 held at $0.21262. The forming 18:00 hour sits ~$0.212, unclosed — its 19:00 UTC close is the next verdict, not a level yet.
Context, honestly: rank #506, $44.9M market cap, $79M global volume today — about 1.8x the entire market cap changing hands in a day. Only 21% of supply circulates. RSI 58, above EMA20 $0.1968 — firming, not scorching.
And the backdrop hasn't changed: the chain is still halted since the Oct 23 exploit, no restart date announced. No fresh catalyst for any of today's legs — this is flow on a paused chain, and every prior leg of this saga eventually gave back.
Levels: $0.25793 ceiling, $0.22211 give-back floor, $0.1987 the reclaimed leg line — an hourly close back below it and the unwind resumes. $0.19132 is the fade low.
Not a call, either way. The unwind lasted exactly one closed hour — was that the leg giving back, or just the shake before the next one?
The tape, on closed hourly candles: post 301's spike faded at 13:00 UTC (close $0.22317, -10.7% in the hour). 14:00 closed $0.21609, under the $0.22211 give-back floor — the fade had legs. 15:00 closed $0.19492, under the $0.1987 leg line, low $0.19132 on 2.03M in volume — the morning run had fully unwound.
Then the reclaim: 16:00 closed $0.21751, back above $0.1987 on 2.21M, the heaviest hour of the fade, high $0.22294 tagging the give-back floor intraday but closing under it. 17:00 held at $0.21262. The forming 18:00 hour sits ~$0.212, unclosed — its 19:00 UTC close is the next verdict, not a level yet.
Context, honestly: rank #506, $44.9M market cap, $79M global volume today — about 1.8x the entire market cap changing hands in a day. Only 21% of supply circulates. RSI 58, above EMA20 $0.1968 — firming, not scorching.
And the backdrop hasn't changed: the chain is still halted since the Oct 23 exploit, no restart date announced. No fresh catalyst for any of today's legs — this is flow on a paused chain, and every prior leg of this saga eventually gave back.
Levels: $0.25793 ceiling, $0.22211 give-back floor, $0.1987 the reclaimed leg line — an hourly close back below it and the unwind resumes. $0.19132 is the fade low.
Not a call, either way. The unwind lasted exactly one closed hour — was that the leg giving back, or just the shake before the next one?
3
·
--
Übersetzung ansehen
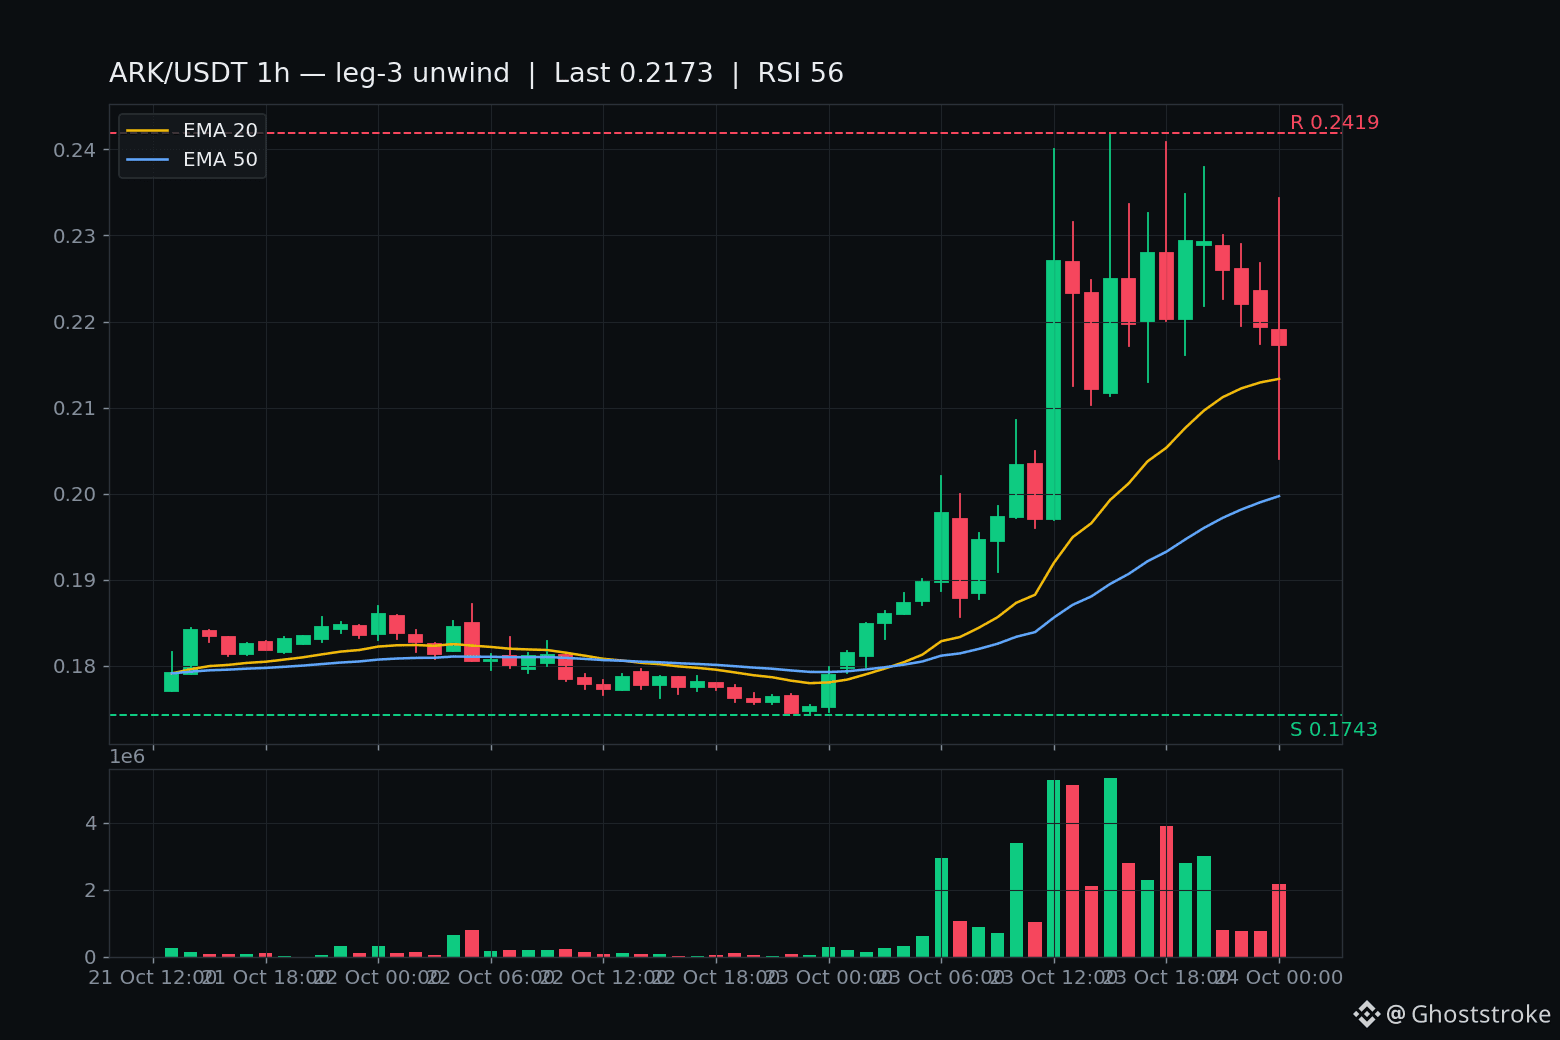
$ARK just flushed $0.2343 → $0.2040 in one hour — the chop is broken.
Six hours of $0.22–$0.24 sideways, then the 00:00 UTC candle (still forming) ripped the floor out: high $0.2343, low $0.2040, on $460k — the heaviest hourly bar in six hours. That $0.2040 print is the lowest since leg 3 started, and it came within 1% of the line named in the last post: a flush under $0.2021 means the Sept-30 shape is repeating.
Buyers stepped in though — live $0.22, right back on the 1h EMA20 ($0.2133). One violent leg, not a trend yet.
Facts: CoinGecko rank #506, $42.7M market cap — genuinely micro. $10.66M Binance volume, 154k trades; global volume $69.6M ≈ 1.6x the entire market cap changing hands in a day. ~98% below the $10.22 ATH, all 200M tokens circulating — no unlock cliff.
Chart: 1h RSI 56, cooled from 65. Price parked on EMA20; EMA50 $0.1997 below. Resistance $0.2419 (spike ceiling), then the flush-bar open $0.2343.
No fresh catalyst — still the same testnet-reset front-run (Mainsail EVM "targeted mid-October", no launch announcement this week). Sept 30's version of this story: +69% to $0.4262, closed $0.2395 the SAME day, then bled to $0.1664 over 18 days.
Levels: $0.2021 is the line — a closed hourly candle under it and the leg-3 unwind is confirmed, Sept-30 shape on. Hold above it and the bounce has a case. Below: $0.174–$0.178 base (flush finale).
Not a call. These small caps wreck accounts on exactly this bounce-or-break moment.
Was $0.2040 the washout, or is $0.2021 still coming?
$ARK just flushed $0.2343 → $0.2040 in one hour — the chop is broken.
Six hours of $0.22–$0.24 sideways, then the 00:00 UTC candle (still forming) ripped the floor out: high $0.2343, low $0.2040, on $460k — the heaviest hourly bar in six hours. That $0.2040 print is the lowest since leg 3 started, and it came within 1% of the line named in the last post: a flush under $0.2021 means the Sept-30 shape is repeating.
Buyers stepped in though — live $0.22, right back on the 1h EMA20 ($0.2133). One violent leg, not a trend yet.
Facts: CoinGecko rank #506, $42.7M market cap — genuinely micro. $10.66M Binance volume, 154k trades; global volume $69.6M ≈ 1.6x the entire market cap changing hands in a day. ~98% below the $10.22 ATH, all 200M tokens circulating — no unlock cliff.
Chart: 1h RSI 56, cooled from 65. Price parked on EMA20; EMA50 $0.1997 below. Resistance $0.2419 (spike ceiling), then the flush-bar open $0.2343.
No fresh catalyst — still the same testnet-reset front-run (Mainsail EVM "targeted mid-October", no launch announcement this week). Sept 30's version of this story: +69% to $0.4262, closed $0.2395 the SAME day, then bled to $0.1664 over 18 days.
Levels: $0.2021 is the line — a closed hourly candle under it and the leg-3 unwind is confirmed, Sept-30 shape on. Hold above it and the bounce has a case. Below: $0.174–$0.178 base (flush finale).
Not a call. These small caps wreck accounts on exactly this bounce-or-break moment.
Was $0.2040 the washout, or is $0.2021 still coming?
Six hours of $0.22–$0.24 sideways, then the 00:00 UTC candle (still forming) ripped the floor out: high $0.2343, low $0.2040, on $460k — the heaviest hourly bar in six hours. That $0.2040 print is the lowest since leg 3 started, and it came within 1% of the line named in the last post: a flush under $0.2021 means the Sept-30 shape is repeating.
Buyers stepped in though — live $0.22, right back on the 1h EMA20 ($0.2133). One violent leg, not a trend yet.
Facts: CoinGecko rank #506, $42.7M market cap — genuinely micro. $10.66M Binance volume, 154k trades; global volume $69.6M ≈ 1.6x the entire market cap changing hands in a day. ~98% below the $10.22 ATH, all 200M tokens circulating — no unlock cliff.
Chart: 1h RSI 56, cooled from 65. Price parked on EMA20; EMA50 $0.1997 below. Resistance $0.2419 (spike ceiling), then the flush-bar open $0.2343.
No fresh catalyst — still the same testnet-reset front-run (Mainsail EVM "targeted mid-October", no launch announcement this week). Sept 30's version of this story: +69% to $0.4262, closed $0.2395 the SAME day, then bled to $0.1664 over 18 days.
Levels: $0.2021 is the line — a closed hourly candle under it and the leg-3 unwind is confirmed, Sept-30 shape on. Hold above it and the bounce has a case. Below: $0.174–$0.178 base (flush finale).
Not a call. These small caps wreck accounts on exactly this bounce-or-break moment.
Was $0.2040 the washout, or is $0.2021 still coming?
54

·
--
KGEN stürzt innerhalb von 5 Minuten plötzlich um 5,2 % ab! Panik oder Chance? Die Unterstützungsniveaus im ÜberblickUm 17:26 (vor 6 Minuten) fiel KGEN innerhalb von 5 Minuten um 5.2% (5-Minuten-Fenster 17:21→17:26). Um 17:33:10 lag der aktuelle Kurs bei 0.1492, 24h +4.6%. Weitere auffällige Bewegungen gab es bei GWEI und RVN.
📅 Datenstand 17:33:10 (Auslösezeitpunkt des Ereignisses siehe jeweilige Angabe; Kurse sind Echtzeit-Schnappschüsse zum Zeitpunkt der Erstellung)
📌 Kurz gesagt: Das kurzfristige Momentum ist konzentriert, Rücksetzer kommen oft schnell – gestaffelte Limits sind solider, als dem Kurs hinterherzulaufen.
Marktüberblick: BTC 83,453.00 (+0.56%) · ETH 2,553.00 (+2.13%); am Gesamtmarkt innerhalb von 24h 239 Gewinner / 250 Verlierer; stärkster 24h-Anstieg W +75.59%, stärkster Rückgang LUMIA -33.88%.
KGEN stürzt innerhalb von 5 Minuten plötzlich um 5,2 % ab! Panik oder Chance? Die Unterstützungsniveaus im Überblick
Um 17:26 (vor 6 Minuten) fiel KGEN innerhalb von 5 Minuten um 5.2% (5-Minuten-Fenster 17:21→17:26). Um 17:33:10 lag der aktuelle Kurs bei 0.1492, 24h +4.6%. Weitere auffällige Bewegungen gab es bei GWEI und RVN.
📅 Datenstand 17:33:10 (Auslösezeitpunkt des Ereignisses siehe jeweilige Angabe; Kurse sind Echtzeit-Schnappschüsse zum Zeitpunkt der Erstellung)
📌 Kurz gesagt: Das kurzfristige Momentum ist konzentriert, Rücksetzer kommen oft schnell – gestaffelte Limits sind solider, als dem Kurs hinterherzulaufen.
Marktüberblick: BTC 83,453.00 (+0.56%) · ETH 2,553.00 (+2.13%); am Gesamtmarkt innerhalb von 24h 239 Gewinner / 250 Verlierer; stärkster 24h-Anstieg W +75.59%, stärkster Rückgang LUMIA -33.88%.
📅 Datenstand 17:33:10 (Auslösezeitpunkt des Ereignisses siehe jeweilige Angabe; Kurse sind Echtzeit-Schnappschüsse zum Zeitpunkt der Erstellung)
📌 Kurz gesagt: Das kurzfristige Momentum ist konzentriert, Rücksetzer kommen oft schnell – gestaffelte Limits sind solider, als dem Kurs hinterherzulaufen.
Marktüberblick: BTC 83,453.00 (+0.56%) · ETH 2,553.00 (+2.13%); am Gesamtmarkt innerhalb von 24h 239 Gewinner / 250 Verlierer; stärkster 24h-Anstieg W +75.59%, stärkster Rückgang LUMIA -33.88%.
2


·
--
Wir freuen uns, die neuesten angesagten Tokens mit unserer Community zu teilen – basierend auf CoinGecko. Unser Fokus liegt auf den bestperformenden Tokens, die gerade im Markt für Aufsehen sorgen. Wir beobachten eine Mischung aus etablierten Akteuren und Neulingen, die alle um die Aufmerksamkeit von Investoren und Tradern buhlen.
Wir betrachten Tokens wie Pudgy Penguins (PENGU), Siren (SIREN) und Backpack (BP), die trotz der Platzierungen #116, #506 und #253 in der Marktkapitalisierung an Zugkraft gewinnen. Etablierte Tokens wie Bitcoin (BTC) und Solana (SOL) hingegen bleiben weiterhin stark und rangieren auf Platz #1 und #7. Weitere erwähnenswerte Nennungen sind SpaceX xStock (SPCXX) und Bittensor (TAO) mit Veränderungen von -2,1% und 1,5% in den letzten 24 Stunden.
Wir sehen erhebliche Schwankungen im Markt, wobei einige Tokens sehr große prozentuale Veränderungen aufweisen. Wir hoffen, dass unsere Community in diesen trendenden Tokens 🚀💰 Chancen findet. Während wir voranschreiten, ist es unser Ziel, unsere Community über die neuesten Entwicklungen im Krypto-Bereich 📊 auf dem Laufenden zu halten.
$BANANAS31, $ADX, $EVAA
Wir freuen uns, die neuesten angesagten Tokens mit unserer Community zu teilen – basierend auf CoinGecko. Unser Fokus liegt auf den bestperformenden Tokens, die gerade im Markt für Aufsehen sorgen. Wir beobachten eine Mischung aus etablierten Akteuren und Neulingen, die alle um die Aufmerksamkeit von Investoren und Tradern buhlen.
Wir betrachten Tokens wie Pudgy Penguins (PENGU), Siren (SIREN) und Backpack (BP), die trotz der Platzierungen #116, #506 und #253 in der Marktkapitalisierung an Zugkraft gewinnen. Etablierte Tokens wie Bitcoin (BTC) und Solana (SOL) hingegen bleiben weiterhin stark und rangieren auf Platz #1 und #7. Weitere erwähnenswerte Nennungen sind SpaceX xStock (SPCXX) und Bittensor (TAO) mit Veränderungen von -2,1% und 1,5% in den letzten 24 Stunden.
Wir sehen erhebliche Schwankungen im Markt, wobei einige Tokens sehr große prozentuale Veränderungen aufweisen. Wir hoffen, dass unsere Community in diesen trendenden Tokens 🚀💰 Chancen findet. Während wir voranschreiten, ist es unser Ziel, unsere Community über die neuesten Entwicklungen im Krypto-Bereich 📊 auf dem Laufenden zu halten.
$BANANAS31 , $ADX , $EVAA
Wir betrachten Tokens wie Pudgy Penguins (PENGU), Siren (SIREN) und Backpack (BP), die trotz der Platzierungen #116, #506 und #253 in der Marktkapitalisierung an Zugkraft gewinnen. Etablierte Tokens wie Bitcoin (BTC) und Solana (SOL) hingegen bleiben weiterhin stark und rangieren auf Platz #1 und #7. Weitere erwähnenswerte Nennungen sind SpaceX xStock (SPCXX) und Bittensor (TAO) mit Veränderungen von -2,1% und 1,5% in den letzten 24 Stunden.
Wir sehen erhebliche Schwankungen im Markt, wobei einige Tokens sehr große prozentuale Veränderungen aufweisen. Wir hoffen, dass unsere Community in diesen trendenden Tokens 🚀💰 Chancen findet. Während wir voranschreiten, ist es unser Ziel, unsere Community über die neuesten Entwicklungen im Krypto-Bereich 📊 auf dem Laufenden zu halten.
$BANANAS31 , $ADX , $EVAA
11

·
--
** Wie bereitest du einen täglichen Trade-Plan vor und kannst Gewinne auf Binance Square erzielen? 📈💡Concordium (CCDUSDT) ist gerade im Trend!
Rang: #506
** --- ### 1️⃣ Zusammenfassung des Tagesmarktes – „Nicht ohne Karte losfahren“ **Warum ist das wichtig?** Wenn du die Marktbedingungen kennst, vermeidest du, in die falsche Richtung abzudriften. - **Top Gewinner (letzte 24 Stunden):** - **AVAXUSDT** + 7.56 % → 1.465 - **NEARUSDT** + 2.01 % → .919 - **SOLUSDT** + 0.47 % → 19.27 - **Verlierer (letzte 24 Stunden):** - **LINKUSDT** ‑ 6.21 % → 4.564 - **LTCUSDT** ‑ 3.27 % → 6.83 > **Praktisch:** Überprüfe in Binance Square im Tab „Market Overview“ die Listen **Top Movers** und **Losers** einmal morgens um 08:00 UTC. Das ist der erste Schritt, um festzulegen, auf welche Coins du dich konzentrieren willst. --- ### 2️⃣ Wähle Ziel-Coins – „Jäger-Käfig“ **Warum ist das wichtig?** Viele Coins zufällig anzusehen, kostet Zeit und bedeutet Risiko. | Coin | Tägliche %-Änderung | Beschreibung | Beispiel-Trade | |------|------------------|----------|-------------| | **** | +7.56 % | Hoher Umsatz, starker Aufwärtstrend. | **Long** 10 k @ 1.30 (ca. 885 AVAX) | | **** | +2.01 % | Mittleres Volumen, stabiler Aufwärtstrend. | **Long** 5 k @ .85 (≈1030 NEAR) | | **** | -6.21 % | Abwärtstrend, Chance auf kurzfristigen Rebound. | **Short** 4 k @ 4.70 (≈272 LINK) | > **Praktisch:** Füge 2–3 ausgewählte Coins zu einer „Watchlist“ hinzu. Nutze in Binance Square die Schaltfläche „Add to Watchlist“. --- ### 3️⃣ Technische Analyse – „Sprache der Charts entschlüsseln“ **Warum ist das wichtig?** Indem du wiederkehrende Muster in der Preisbewegung erkennst, kannst du den Zeitpunkt für Ein- und Ausstieg klarer bestimmen. #### a) **AVAX – Bullish Flag (Aufwärtsflagge)**
** Wie bereitest du einen täglichen Trade-Plan vor und kannst Gewinne auf Binance Square erzielen? 📈💡
Concordium (CCDUSDT) ist gerade im Trend!
Rang: #506
** --- ### 1️⃣ Zusammenfassung des Tagesmarktes – „Nicht ohne Karte losfahren“ **Warum ist das wichtig?** Wenn du die Marktbedingungen kennst, vermeidest du, in die falsche Richtung abzudriften. - **Top Gewinner (letzte 24 Stunden):** - **AVAXUSDT** + 7.56 % → 1.465 - **NEARUSDT** + 2.01 % → .919 - **SOLUSDT** + 0.47 % → 19.27 - **Verlierer (letzte 24 Stunden):** - **LINKUSDT** ‑ 6.21 % → 4.564 - **LTCUSDT** ‑ 3.27 % → 6.83 > **Praktisch:** Überprüfe in Binance Square im Tab „Market Overview“ die Listen **Top Movers** und **Losers** einmal morgens um 08:00 UTC. Das ist der erste Schritt, um festzulegen, auf welche Coins du dich konzentrieren willst. --- ### 2️⃣ Wähle Ziel-Coins – „Jäger-Käfig“ **Warum ist das wichtig?** Viele Coins zufällig anzusehen, kostet Zeit und bedeutet Risiko. | Coin | Tägliche %-Änderung | Beschreibung | Beispiel-Trade | |------|------------------|----------|-------------| | **** | +7.56 % | Hoher Umsatz, starker Aufwärtstrend. | **Long** 10 k @ 1.30 (ca. 885 AVAX) | | **** | +2.01 % | Mittleres Volumen, stabiler Aufwärtstrend. | **Long** 5 k @ .85 (≈1030 NEAR) | | **** | -6.21 % | Abwärtstrend, Chance auf kurzfristigen Rebound. | **Short** 4 k @ 4.70 (≈272 LINK) | > **Praktisch:** Füge 2–3 ausgewählte Coins zu einer „Watchlist“ hinzu. Nutze in Binance Square die Schaltfläche „Add to Watchlist“. --- ### 3️⃣ Technische Analyse – „Sprache der Charts entschlüsseln“ **Warum ist das wichtig?** Indem du wiederkehrende Muster in der Preisbewegung erkennst, kannst du den Zeitpunkt für Ein- und Ausstieg klarer bestimmen. #### a) **AVAX – Bullish Flag (Aufwärtsflagge)**
Rang: #506
** --- ### 1️⃣ Zusammenfassung des Tagesmarktes – „Nicht ohne Karte losfahren“ **Warum ist das wichtig?** Wenn du die Marktbedingungen kennst, vermeidest du, in die falsche Richtung abzudriften. - **Top Gewinner (letzte 24 Stunden):** - **AVAXUSDT** + 7.56 % → 1.465 - **NEARUSDT** + 2.01 % → .919 - **SOLUSDT** + 0.47 % → 19.27 - **Verlierer (letzte 24 Stunden):** - **LINKUSDT** ‑ 6.21 % → 4.564 - **LTCUSDT** ‑ 3.27 % → 6.83 > **Praktisch:** Überprüfe in Binance Square im Tab „Market Overview“ die Listen **Top Movers** und **Losers** einmal morgens um 08:00 UTC. Das ist der erste Schritt, um festzulegen, auf welche Coins du dich konzentrieren willst. --- ### 2️⃣ Wähle Ziel-Coins – „Jäger-Käfig“ **Warum ist das wichtig?** Viele Coins zufällig anzusehen, kostet Zeit und bedeutet Risiko. | Coin | Tägliche %-Änderung | Beschreibung | Beispiel-Trade | |------|------------------|----------|-------------| | **** | +7.56 % | Hoher Umsatz, starker Aufwärtstrend. | **Long** 10 k @ 1.30 (ca. 885 AVAX) | | **** | +2.01 % | Mittleres Volumen, stabiler Aufwärtstrend. | **Long** 5 k @ .85 (≈1030 NEAR) | | **** | -6.21 % | Abwärtstrend, Chance auf kurzfristigen Rebound. | **Short** 4 k @ 4.70 (≈272 LINK) | > **Praktisch:** Füge 2–3 ausgewählte Coins zu einer „Watchlist“ hinzu. Nutze in Binance Square die Schaltfläche „Add to Watchlist“. --- ### 3️⃣ Technische Analyse – „Sprache der Charts entschlüsseln“ **Warum ist das wichtig?** Indem du wiederkehrende Muster in der Preisbewegung erkennst, kannst du den Zeitpunkt für Ein- und Ausstieg klarer bestimmen. #### a) **AVAX – Bullish Flag (Aufwärtsflagge)**
78
Anmelden und weiter Inhalte entdecken
Krypto-Nutzer weltweit auf Binance Square kennenlernen
⚡️ Bleib in Sachen Krypto stets am Puls.
💬 Die weltgrößte Kryptobörse vertraut darauf.
👍 Erhalte verlässliche Einblicke von verifizierten Creators.
E-Mail-Adresse/Telefonnummer
Trendthemen
1
#USPPIMissMayEaseBTCPressure
81 Aufrufe
41 Kommentare
2
#WhatWillDriveCryptoandStocks’NextRebound?
77,855 Aufrufe
1,088 Kommentare
3
#BitcoinBreaksBelow200WeekMovingAverage
4,333 Aufrufe
147 Kommentare
4
#SpaceXTeslaMergerTalksWouldCombine30220BTC
1,176 Aufrufe
57 Kommentare
5
#Anthropic’s6xIPODemandSignalsPotentialRecordRaise
24,892 Aufrufe
509 Kommentare
6
#USCryptoETFsLose$1.48BInFiveDays
647 Aufrufe
21 Kommentare
7
#KoreaDigitalAssetBasicActFinalDraftExpectedEarlyJanuary
803 Aufrufe
12 Kommentare
8
#RippleRLUSDMarketCapSurpassesPayPalPYUSD
748 Aufrufe
50 Kommentare
9
#JaneStreetNearlyOctuplesFidelityBitcoinETFHoldings
9,180 Aufrufe
163 Kommentare
10
#HuangExitNvidiaStrategyInFocus
230,322 Aufrufe
1,871 Kommentare