
#506
506
14 views
6 Discussing
Hot
Latest

·
--
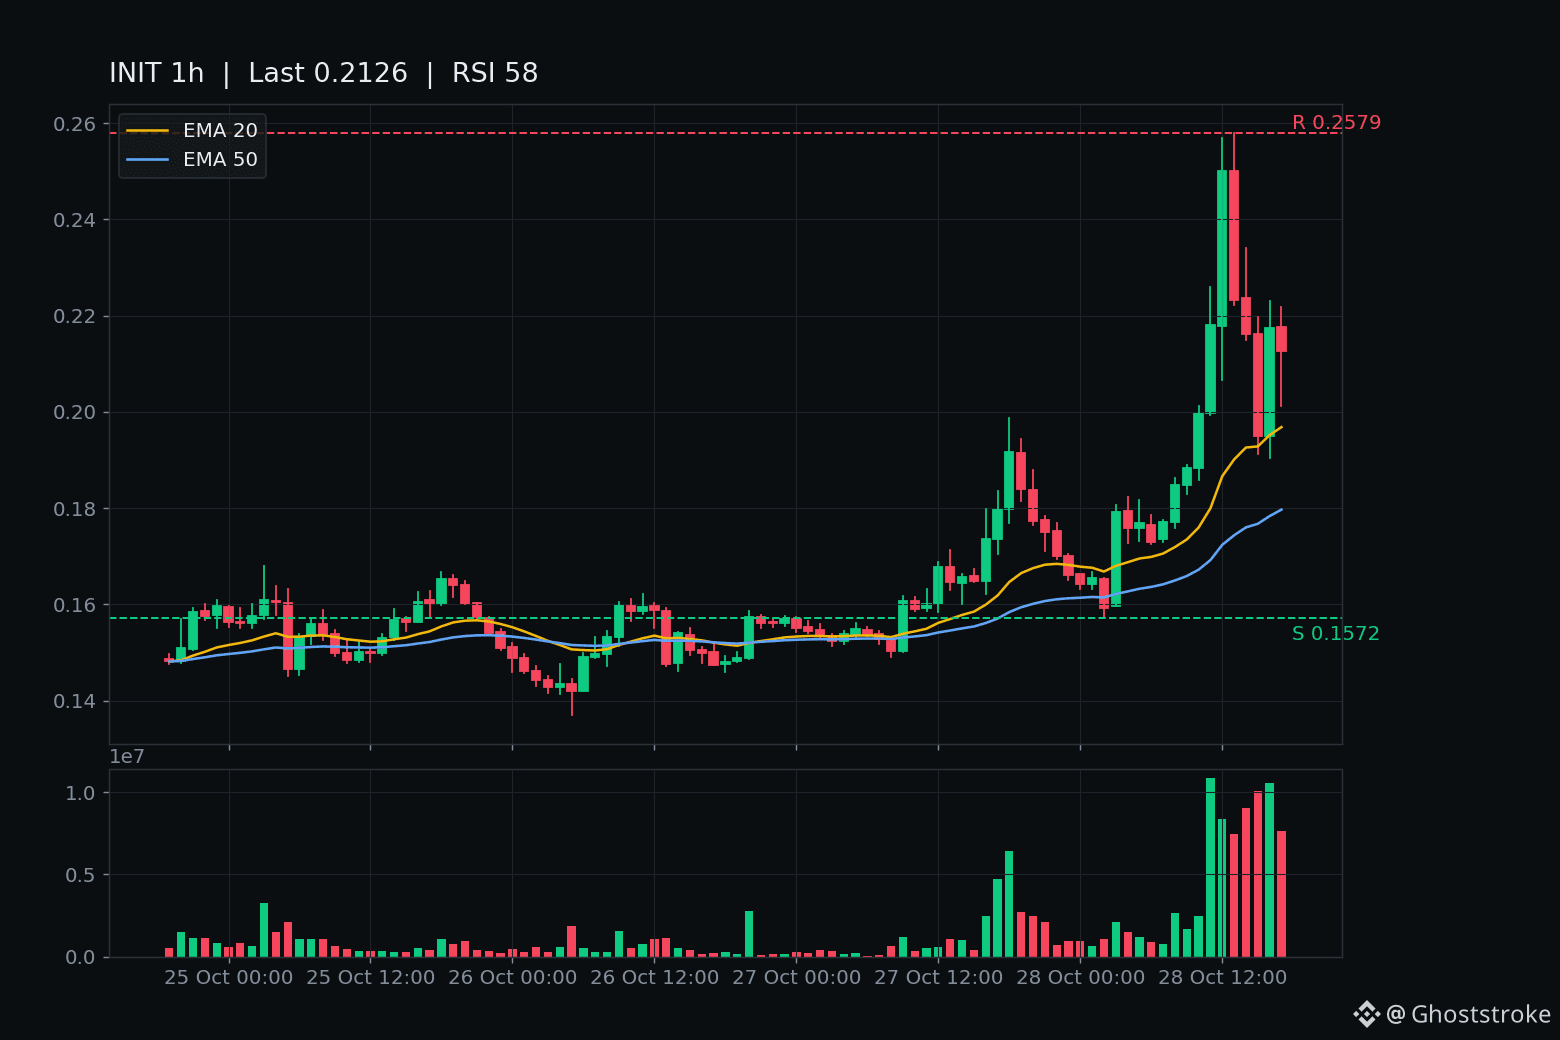
$INIT spiked to $0.25793 today — then unwound the whole leg in two hours, then reclaimed the leg line within the hour.
The tape, on closed hourly candles: post 301's spike faded at 13:00 UTC (close $0.22317, -10.7% in the hour). 14:00 closed $0.21609, under the $0.22211 give-back floor — the fade had legs. 15:00 closed $0.19492, under the $0.1987 leg line, low $0.19132 on 2.03M in volume — the morning run had fully unwound.
Then the reclaim: 16:00 closed $0.21751, back above $0.1987 on 2.21M, the heaviest hour of the fade, high $0.22294 tagging the give-back floor intraday but closing under it. 17:00 held at $0.21262. The forming 18:00 hour sits ~$0.212, unclosed — its 19:00 UTC close is the next verdict, not a level yet.
Context, honestly: rank #506, $44.9M market cap, $79M global volume today — about 1.8x the entire market cap changing hands in a day. Only 21% of supply circulates. RSI 58, above EMA20 $0.1968 — firming, not scorching.
And the backdrop hasn't changed: the chain is still halted since the Oct 23 exploit, no restart date announced. No fresh catalyst for any of today's legs — this is flow on a paused chain, and every prior leg of this saga eventually gave back.
Levels: $0.25793 ceiling, $0.22211 give-back floor, $0.1987 the reclaimed leg line — an hourly close back below it and the unwind resumes. $0.19132 is the fade low.
Not a call, either way. The unwind lasted exactly one closed hour — was that the leg giving back, or just the shake before the next one?
$INIT spiked to $0.25793 today — then unwound the whole leg in two hours, then reclaimed the leg line within the hour.
The tape, on closed hourly candles: post 301's spike faded at 13:00 UTC (close $0.22317, -10.7% in the hour). 14:00 closed $0.21609, under the $0.22211 give-back floor — the fade had legs. 15:00 closed $0.19492, under the $0.1987 leg line, low $0.19132 on 2.03M in volume — the morning run had fully unwound.
Then the reclaim: 16:00 closed $0.21751, back above $0.1987 on 2.21M, the heaviest hour of the fade, high $0.22294 tagging the give-back floor intraday but closing under it. 17:00 held at $0.21262. The forming 18:00 hour sits ~$0.212, unclosed — its 19:00 UTC close is the next verdict, not a level yet.
Context, honestly: rank #506, $44.9M market cap, $79M global volume today — about 1.8x the entire market cap changing hands in a day. Only 21% of supply circulates. RSI 58, above EMA20 $0.1968 — firming, not scorching.
And the backdrop hasn't changed: the chain is still halted since the Oct 23 exploit, no restart date announced. No fresh catalyst for any of today's legs — this is flow on a paused chain, and every prior leg of this saga eventually gave back.
Levels: $0.25793 ceiling, $0.22211 give-back floor, $0.1987 the reclaimed leg line — an hourly close back below it and the unwind resumes. $0.19132 is the fade low.
Not a call, either way. The unwind lasted exactly one closed hour — was that the leg giving back, or just the shake before the next one?
The tape, on closed hourly candles: post 301's spike faded at 13:00 UTC (close $0.22317, -10.7% in the hour). 14:00 closed $0.21609, under the $0.22211 give-back floor — the fade had legs. 15:00 closed $0.19492, under the $0.1987 leg line, low $0.19132 on 2.03M in volume — the morning run had fully unwound.
Then the reclaim: 16:00 closed $0.21751, back above $0.1987 on 2.21M, the heaviest hour of the fade, high $0.22294 tagging the give-back floor intraday but closing under it. 17:00 held at $0.21262. The forming 18:00 hour sits ~$0.212, unclosed — its 19:00 UTC close is the next verdict, not a level yet.
Context, honestly: rank #506, $44.9M market cap, $79M global volume today — about 1.8x the entire market cap changing hands in a day. Only 21% of supply circulates. RSI 58, above EMA20 $0.1968 — firming, not scorching.
And the backdrop hasn't changed: the chain is still halted since the Oct 23 exploit, no restart date announced. No fresh catalyst for any of today's legs — this is flow on a paused chain, and every prior leg of this saga eventually gave back.
Levels: $0.25793 ceiling, $0.22211 give-back floor, $0.1987 the reclaimed leg line — an hourly close back below it and the unwind resumes. $0.19132 is the fade low.
Not a call, either way. The unwind lasted exactly one closed hour — was that the leg giving back, or just the shake before the next one?
3
·
--
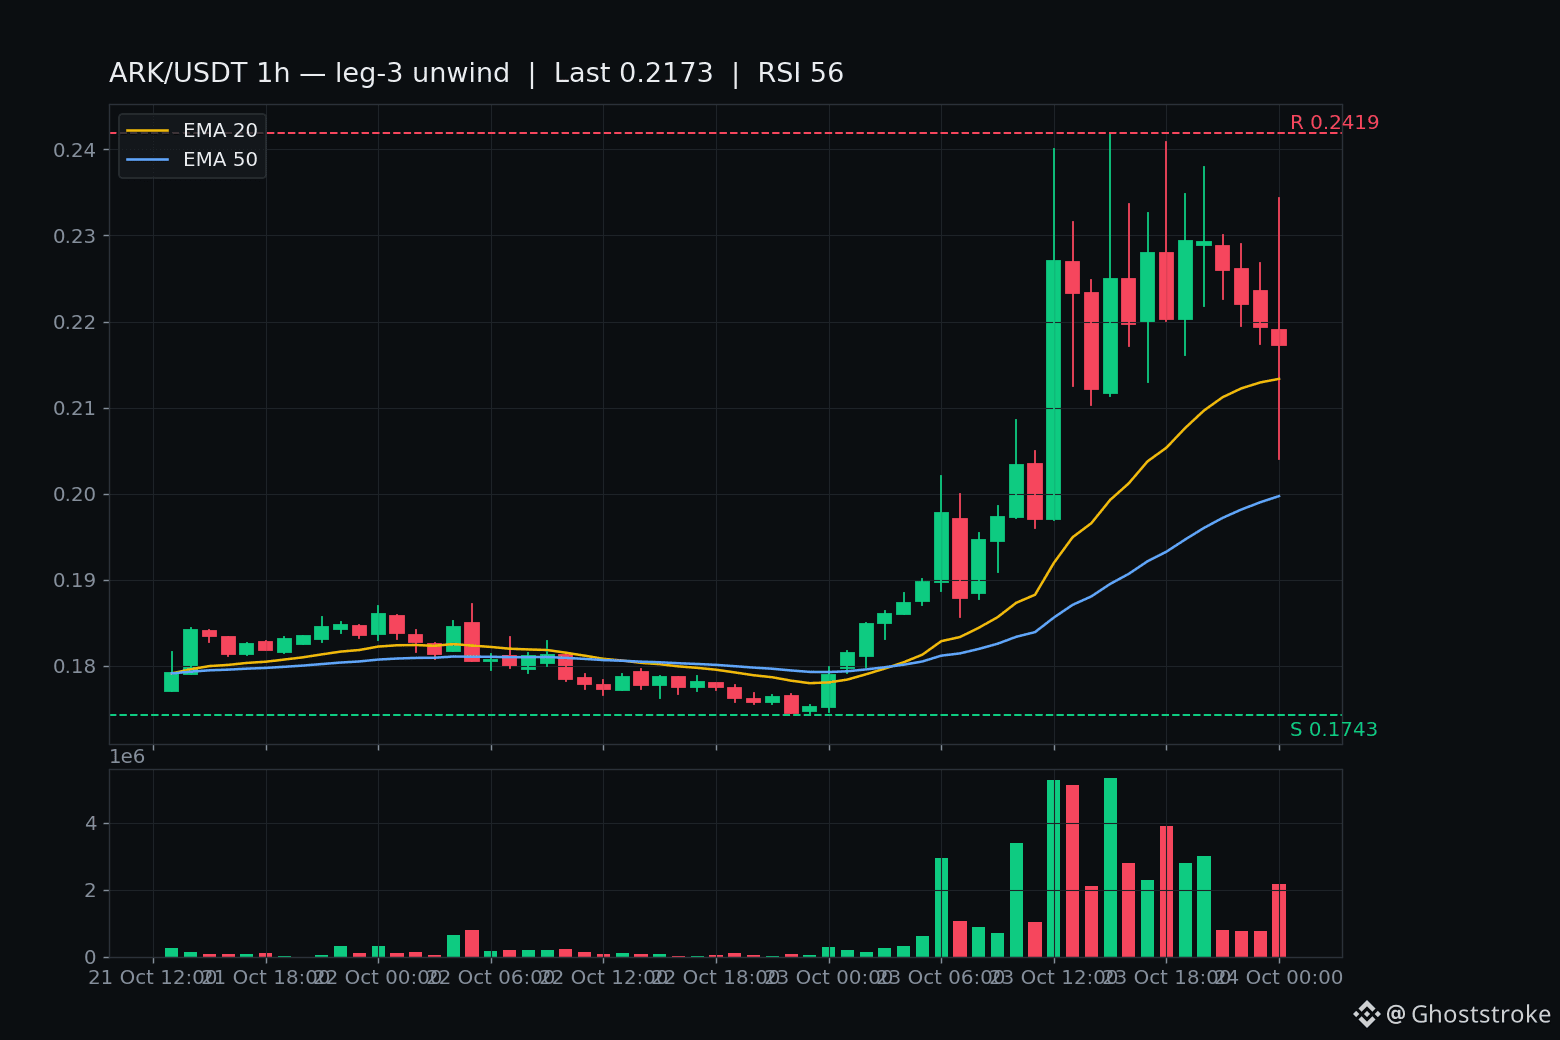
$ARK just flushed $0.2343 → $0.2040 in one hour — the chop is broken.
Six hours of $0.22–$0.24 sideways, then the 00:00 UTC candle (still forming) ripped the floor out: high $0.2343, low $0.2040, on $460k — the heaviest hourly bar in six hours. That $0.2040 print is the lowest since leg 3 started, and it came within 1% of the line named in the last post: a flush under $0.2021 means the Sept-30 shape is repeating.
Buyers stepped in though — live $0.22, right back on the 1h EMA20 ($0.2133). One violent leg, not a trend yet.
Facts: CoinGecko rank #506, $42.7M market cap — genuinely micro. $10.66M Binance volume, 154k trades; global volume $69.6M ≈ 1.6x the entire market cap changing hands in a day. ~98% below the $10.22 ATH, all 200M tokens circulating — no unlock cliff.
Chart: 1h RSI 56, cooled from 65. Price parked on EMA20; EMA50 $0.1997 below. Resistance $0.2419 (spike ceiling), then the flush-bar open $0.2343.
No fresh catalyst — still the same testnet-reset front-run (Mainsail EVM "targeted mid-October", no launch announcement this week). Sept 30's version of this story: +69% to $0.4262, closed $0.2395 the SAME day, then bled to $0.1664 over 18 days.
Levels: $0.2021 is the line — a closed hourly candle under it and the leg-3 unwind is confirmed, Sept-30 shape on. Hold above it and the bounce has a case. Below: $0.174–$0.178 base (flush finale).
Not a call. These small caps wreck accounts on exactly this bounce-or-break moment.
Was $0.2040 the washout, or is $0.2021 still coming?
$ARK just flushed $0.2343 → $0.2040 in one hour — the chop is broken.
Six hours of $0.22–$0.24 sideways, then the 00:00 UTC candle (still forming) ripped the floor out: high $0.2343, low $0.2040, on $460k — the heaviest hourly bar in six hours. That $0.2040 print is the lowest since leg 3 started, and it came within 1% of the line named in the last post: a flush under $0.2021 means the Sept-30 shape is repeating.
Buyers stepped in though — live $0.22, right back on the 1h EMA20 ($0.2133). One violent leg, not a trend yet.
Facts: CoinGecko rank #506, $42.7M market cap — genuinely micro. $10.66M Binance volume, 154k trades; global volume $69.6M ≈ 1.6x the entire market cap changing hands in a day. ~98% below the $10.22 ATH, all 200M tokens circulating — no unlock cliff.
Chart: 1h RSI 56, cooled from 65. Price parked on EMA20; EMA50 $0.1997 below. Resistance $0.2419 (spike ceiling), then the flush-bar open $0.2343.
No fresh catalyst — still the same testnet-reset front-run (Mainsail EVM "targeted mid-October", no launch announcement this week). Sept 30's version of this story: +69% to $0.4262, closed $0.2395 the SAME day, then bled to $0.1664 over 18 days.
Levels: $0.2021 is the line — a closed hourly candle under it and the leg-3 unwind is confirmed, Sept-30 shape on. Hold above it and the bounce has a case. Below: $0.174–$0.178 base (flush finale).
Not a call. These small caps wreck accounts on exactly this bounce-or-break moment.
Was $0.2040 the washout, or is $0.2021 still coming?
Six hours of $0.22–$0.24 sideways, then the 00:00 UTC candle (still forming) ripped the floor out: high $0.2343, low $0.2040, on $460k — the heaviest hourly bar in six hours. That $0.2040 print is the lowest since leg 3 started, and it came within 1% of the line named in the last post: a flush under $0.2021 means the Sept-30 shape is repeating.
Buyers stepped in though — live $0.22, right back on the 1h EMA20 ($0.2133). One violent leg, not a trend yet.
Facts: CoinGecko rank #506, $42.7M market cap — genuinely micro. $10.66M Binance volume, 154k trades; global volume $69.6M ≈ 1.6x the entire market cap changing hands in a day. ~98% below the $10.22 ATH, all 200M tokens circulating — no unlock cliff.
Chart: 1h RSI 56, cooled from 65. Price parked on EMA20; EMA50 $0.1997 below. Resistance $0.2419 (spike ceiling), then the flush-bar open $0.2343.
No fresh catalyst — still the same testnet-reset front-run (Mainsail EVM "targeted mid-October", no launch announcement this week). Sept 30's version of this story: +69% to $0.4262, closed $0.2395 the SAME day, then bled to $0.1664 over 18 days.
Levels: $0.2021 is the line — a closed hourly candle under it and the leg-3 unwind is confirmed, Sept-30 shape on. Hold above it and the bounce has a case. Below: $0.174–$0.178 base (flush finale).
Not a call. These small caps wreck accounts on exactly this bounce-or-break moment.
Was $0.2040 the washout, or is $0.2021 still coming?
54

·
--
KGEN suddenly plunges 5.2% in 5 minutes! Panic or opportunity? A quick look at support levelsAt 17:26 (6 minutes ago), KGEN dropped 5.2% within 5 minutes (5-minute window: 17:21→17:26). As of 17:33:10, its current price is 0.1492, up 4.6% over 24h. GWEI and RVN also saw unusual moves around the same time.
📅 Data as of 17:33:10 (event trigger times are noted for each item; prices are real-time snapshots at the time of writing)
📌 In a nutshell: Short-term momentum is concentrated, and pullbacks can come quickly—placing limit orders in batches is safer than chasing prices higher
Market overview: BTC 83,453.00 (+0.56%) · ETH 2,553.00 (+2.13%); across the market, 239 rose and 250 fell over 24h; top gainer: W +75.59%, top loser: LUMIA -33.88%.
KGEN suddenly plunges 5.2% in 5 minutes! Panic or opportunity? A quick look at support levels
At 17:26 (6 minutes ago), KGEN dropped 5.2% within 5 minutes (5-minute window: 17:21→17:26). As of 17:33:10, its current price is 0.1492, up 4.6% over 24h. GWEI and RVN also saw unusual moves around the same time.
📅 Data as of 17:33:10 (event trigger times are noted for each item; prices are real-time snapshots at the time of writing)
📌 In a nutshell: Short-term momentum is concentrated, and pullbacks can come quickly—placing limit orders in batches is safer than chasing prices higher
Market overview: BTC 83,453.00 (+0.56%) · ETH 2,553.00 (+2.13%); across the market, 239 rose and 250 fell over 24h; top gainer: W +75.59%, top loser: LUMIA -33.88%.
📅 Data as of 17:33:10 (event trigger times are noted for each item; prices are real-time snapshots at the time of writing)
📌 In a nutshell: Short-term momentum is concentrated, and pullbacks can come quickly—placing limit orders in batches is safer than chasing prices higher
Market overview: BTC 83,453.00 (+0.56%) · ETH 2,553.00 (+2.13%); across the market, 239 rose and 250 fell over 24h; top gainer: W +75.59%, top loser: LUMIA -33.88%.
2


·
--
We're excited to share the latest trending tokens with our community, sourced from CoinGecko. Our focus is on the top-performing tokens that are making waves in the market. We're seeing a mix of established players and newcomers, all vying for attention from investors and traders.
We're looking at tokens like Pudgy Penguins (PENGU), Siren (SIREN), and Backpack (BP), which are gaining traction despite being ranked #116, #506, and #253 in market capitalization, respectively. On the other hand, established tokens like Bitcoin (BTC) and Solana (SOL) continue to hold strong, ranked #1 and #7. Other notable mentions include SpaceX xStock (SPCXX) and Bittensor (TAO), with changes of -2.1% and 1.5% in the last 24 hours.
We're seeing significant fluctuations in the market, with some tokens experiencing substantial % changes. We're hopeful that our community will find opportunities in these trending tokens 🚀💰. As we move forward, we're committed to keeping our community informed about the latest developments in the crypto space 📊.
$BANANAS31, $ADX, $EVAA
We're excited to share the latest trending tokens with our community, sourced from CoinGecko. Our focus is on the top-performing tokens that are making waves in the market. We're seeing a mix of established players and newcomers, all vying for attention from investors and traders.
We're looking at tokens like Pudgy Penguins (PENGU), Siren (SIREN), and Backpack (BP), which are gaining traction despite being ranked #116, #506, and #253 in market capitalization, respectively. On the other hand, established tokens like Bitcoin (BTC) and Solana (SOL) continue to hold strong, ranked #1 and #7. Other notable mentions include SpaceX xStock (SPCXX) and Bittensor (TAO), with changes of -2.1% and 1.5% in the last 24 hours.
We're seeing significant fluctuations in the market, with some tokens experiencing substantial % changes. We're hopeful that our community will find opportunities in these trending tokens 🚀💰. As we move forward, we're committed to keeping our community informed about the latest developments in the crypto space 📊.
$BANANAS31 , $ADX , $EVAA
We're looking at tokens like Pudgy Penguins (PENGU), Siren (SIREN), and Backpack (BP), which are gaining traction despite being ranked #116, #506, and #253 in market capitalization, respectively. On the other hand, established tokens like Bitcoin (BTC) and Solana (SOL) continue to hold strong, ranked #1 and #7. Other notable mentions include SpaceX xStock (SPCXX) and Bittensor (TAO), with changes of -2.1% and 1.5% in the last 24 hours.
We're seeing significant fluctuations in the market, with some tokens experiencing substantial % changes. We're hopeful that our community will find opportunities in these trending tokens 🚀💰. As we move forward, we're committed to keeping our community informed about the latest developments in the crypto space 📊.
$BANANAS31 , $ADX , $EVAA
11

·
--
** How to Create a Daily Trade Plan and Make Profit on Binance Square? 📈💡Concordium (CCDUSDT) is trending right now!
Rank: #506
** --- ### 1️⃣ Daily Market Summary – “Don’t Hit the Road Without a Map” **Why is it important?** Knowing market conditions prevents you from veering in the wrong direction. - **Top Movers (24 hours):** - **AVAXUSDT** + 7.56 % → 1.465 - **NEARUSDT** + 2.01 % → .919 - **SOLUSDT** + 0.47 % → 19.27 - **Losers (24 hours):** - **LINKUSDT** ‑ 6.21 % → 4.564 - **LTCUSDT** ‑ 3.27 % → 6.83 > **Practical:** On Binance Square, check the **Top Movers** and **Losers** lists from the “Market Overview” tab once at 08:00 UTC in the morning. This is the first step in deciding which parts to focus on. --- ### 2️⃣ Choose Target Coins – “Hunter’s Cage” **Why is it important?** Randomly looking at too many coins is time-wasting and increases risk. | Coin | Daily % Change | Description | Example Trade | |------|------------------|----------|-------------| | **** | +7.56 % | High volume, strong upward trend. | **Long** 10 k @ 1.30 (≈885 AVAX) | | **** | +2.01 % | Medium volume, a steady uptrend. | **Long** 5 k @ .85 (≈1030 NEAR) | | **** | -6.21 % | Downtrend, a short-term rebound opportunity. | **Short** 4 k @ 4.70 (≈272 LINK) | > **Practical:** Add the 2–3 coins you chose to a “Watchlist.” Use the “Add to Watchlist” button on Binance Square. --- ### 3️⃣ Technical Analysis – “Decode the Chart Language” **Why is it important?** By spotting recurring patterns in price moves, you’ll be able to clarify when to enter and exit. #### a) **AVAX – Bullish Flag (Rising Flag)**
** How to Create a Daily Trade Plan and Make Profit on Binance Square? 📈💡
Concordium (CCDUSDT) is trending right now!
Rank: #506
** --- ### 1️⃣ Daily Market Summary – “Don’t Hit the Road Without a Map” **Why is it important?** Knowing market conditions prevents you from veering in the wrong direction. - **Top Movers (24 hours):** - **AVAXUSDT** + 7.56 % → 1.465 - **NEARUSDT** + 2.01 % → .919 - **SOLUSDT** + 0.47 % → 19.27 - **Losers (24 hours):** - **LINKUSDT** ‑ 6.21 % → 4.564 - **LTCUSDT** ‑ 3.27 % → 6.83 > **Practical:** On Binance Square, check the **Top Movers** and **Losers** lists from the “Market Overview” tab once at 08:00 UTC in the morning. This is the first step in deciding which parts to focus on. --- ### 2️⃣ Choose Target Coins – “Hunter’s Cage” **Why is it important?** Randomly looking at too many coins is time-wasting and increases risk. | Coin | Daily % Change | Description | Example Trade | |------|------------------|----------|-------------| | **** | +7.56 % | High volume, strong upward trend. | **Long** 10 k @ 1.30 (≈885 AVAX) | | **** | +2.01 % | Medium volume, a steady uptrend. | **Long** 5 k @ .85 (≈1030 NEAR) | | **** | -6.21 % | Downtrend, a short-term rebound opportunity. | **Short** 4 k @ 4.70 (≈272 LINK) | > **Practical:** Add the 2–3 coins you chose to a “Watchlist.” Use the “Add to Watchlist” button on Binance Square. --- ### 3️⃣ Technical Analysis – “Decode the Chart Language” **Why is it important?** By spotting recurring patterns in price moves, you’ll be able to clarify when to enter and exit. #### a) **AVAX – Bullish Flag (Rising Flag)**
Rank: #506
** --- ### 1️⃣ Daily Market Summary – “Don’t Hit the Road Without a Map” **Why is it important?** Knowing market conditions prevents you from veering in the wrong direction. - **Top Movers (24 hours):** - **AVAXUSDT** + 7.56 % → 1.465 - **NEARUSDT** + 2.01 % → .919 - **SOLUSDT** + 0.47 % → 19.27 - **Losers (24 hours):** - **LINKUSDT** ‑ 6.21 % → 4.564 - **LTCUSDT** ‑ 3.27 % → 6.83 > **Practical:** On Binance Square, check the **Top Movers** and **Losers** lists from the “Market Overview” tab once at 08:00 UTC in the morning. This is the first step in deciding which parts to focus on. --- ### 2️⃣ Choose Target Coins – “Hunter’s Cage” **Why is it important?** Randomly looking at too many coins is time-wasting and increases risk. | Coin | Daily % Change | Description | Example Trade | |------|------------------|----------|-------------| | **** | +7.56 % | High volume, strong upward trend. | **Long** 10 k @ 1.30 (≈885 AVAX) | | **** | +2.01 % | Medium volume, a steady uptrend. | **Long** 5 k @ .85 (≈1030 NEAR) | | **** | -6.21 % | Downtrend, a short-term rebound opportunity. | **Short** 4 k @ 4.70 (≈272 LINK) | > **Practical:** Add the 2–3 coins you chose to a “Watchlist.” Use the “Add to Watchlist” button on Binance Square. --- ### 3️⃣ Technical Analysis – “Decode the Chart Language” **Why is it important?** By spotting recurring patterns in price moves, you’ll be able to clarify when to enter and exit. #### a) **AVAX – Bullish Flag (Rising Flag)**
78
Log in to explore more content
Join global crypto users on Binance Square
⚡️ Get latest and useful information about crypto.
💬 Trusted by the world’s largest crypto exchange.
👍 Discover real insights from verified creators.
Email / Phone number
Trending Topics
1
#USPPIMissMayEaseBTCPressure
1 views
31 Discussing
2
#WhatWillDriveCryptoandStocks’NextRebound?
76,201 views
1,062 Discussing
3
#BitcoinBreaksBelow200WeekMovingAverage
3,272 views
136 Discussing
4
#SpaceXTeslaMergerTalksWouldCombine30220BTC
696 views
50 Discussing
5
#Anthropic’s6xIPODemandSignalsPotentialRecordRaise
24,278 views
497 Discussing
6
#USCryptoETFsLose$1.48BInFiveDays
601 views
18 Discussing
7
#KoreaDigitalAssetBasicActFinalDraftExpectedEarlyJanuary
543 views
12 Discussing
8
#RippleRLUSDMarketCapSurpassesPayPalPYUSD
608 views
47 Discussing
9
#JaneStreetNearlyOctuplesFidelityBitcoinETFHoldings
8,972 views
159 Discussing
10
#HuangExitNvidiaStrategyInFocus
228,460 views
1,857 Discussing