

#bitcoin 's value has dropped about 5% in the past five days, to $26,776.
Bulls and bears are fighting it out on the weekly chart.
The daily chart looks positive for $BTC , which might mean that a fast upswing is in the cards.
The weekly time frame of the Bitcoin (BTC) market is at a crossroads, with bulls and bears vying for control. Multi-time-frame research, however, reveals that daily BTC is bullish and set for a rally.
On a weekly scale, the structure of Bitcoin's price has not changed.
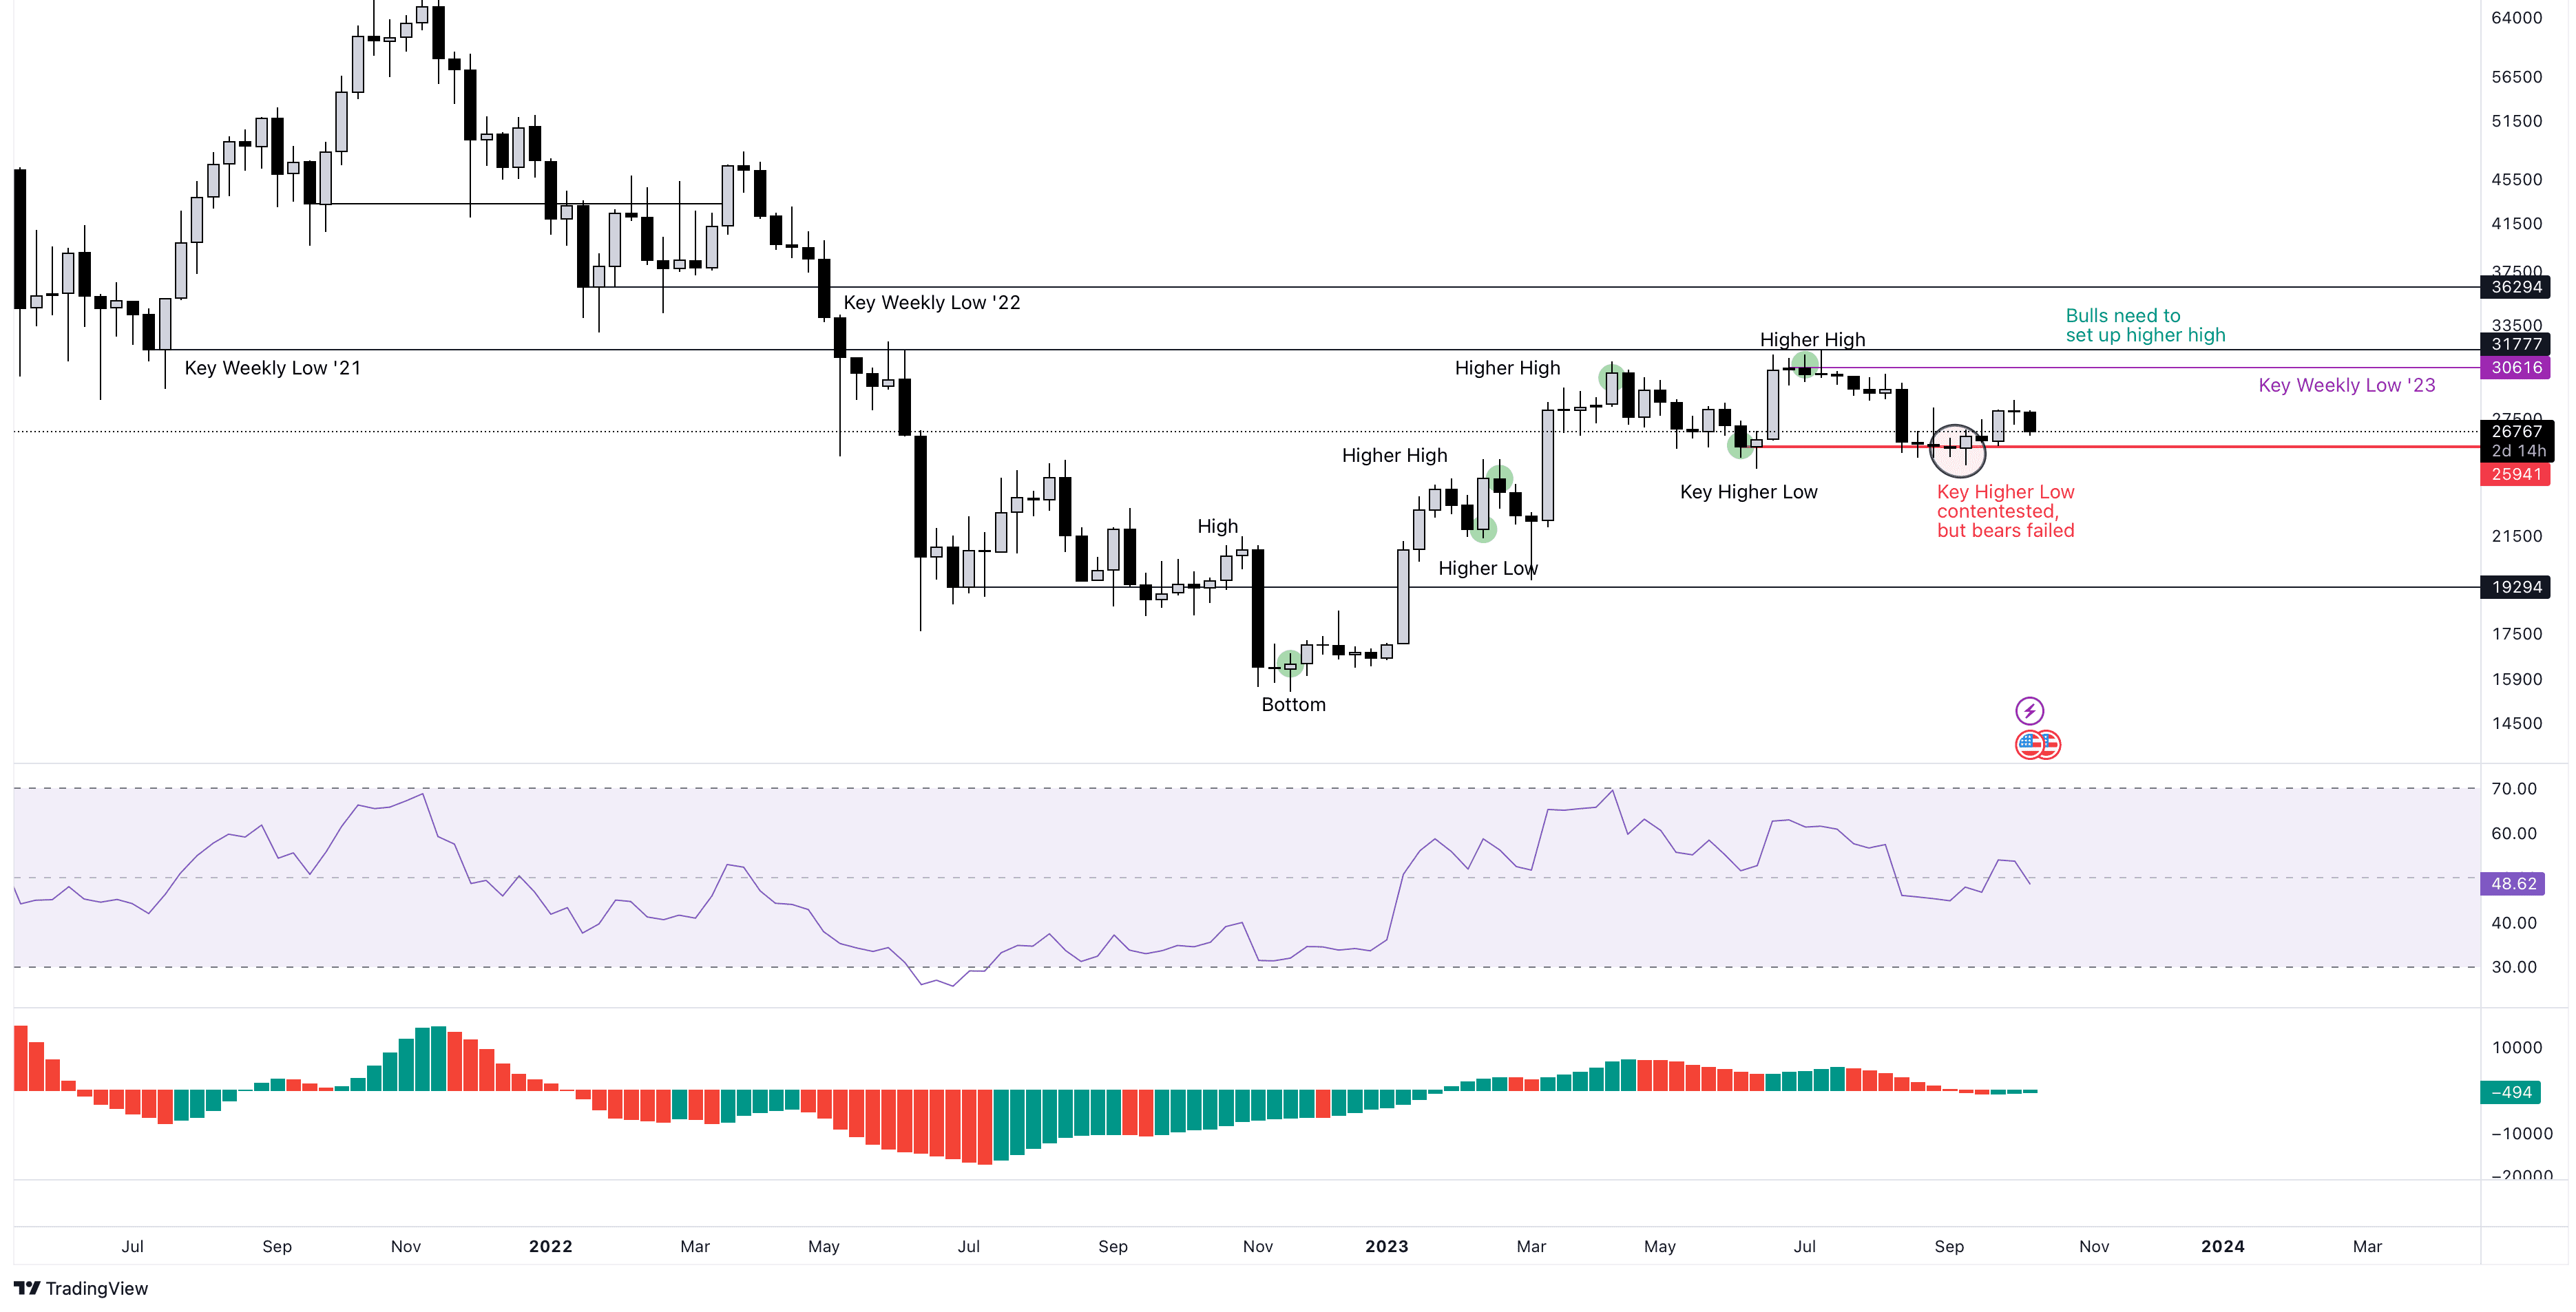
On the weekly time scale, the price of bitcoin (BTC) has made several higher highs and higher lows in 2023, demonstrating its bull run. As Bitcoin (BTC) tried to break below June's critical bottom of $25,941, this upward moving market was met with resistance. This move was a failed breakout since bears didn't follow through after a weekly candlestick closed below this level. Due to the absence of selling pressure from the bears, BTC bulls were able to push the cryptocurrency to a possible local high of $28,592.
A decisive weekly closing below $25,941 would indicate that $28,592 was a local top.
If the bulls are still in charge, though, Bitcoin's price should continue to rise and set a new all-time high above $30,616.
In the first scenario, a break of a critical low has historically been associated with a wild swing of 20% to 60%. There are instances of things happening in the 2021 and 2022 timelines.
However, bulls need to make a new high above $30,616 to keep the upper hand, which might lead to a retest and possible break over the 2021 weekly low at $31,777.
The daily BTC chart highlights major events.
The weekly milestone of $25,941 was tested and rejected by Bitcoin's (BTC) price on the daily chart, followed by a small upward trend. With a current market price of $26,783, Bitcoin has seen three higher lows and two higher highs over the course of the last month.
In the last week of September, as can be seen in the chart, Bitcoin's price dropped below the $26,500 support level. Both the Relative Strength Index (RSI) and the Awesome Oscillator (AO) nearly flipped below zero during this aborted bearish effort. However, a rapid improvement caused the RSI and AO to increase.
The recent Bitcoin price drop below $27,400 has caused the Relative Strength Index (RSI) to drop below 50 and the Average True Range (ATR) to approach zero. If past is prologue, then the market should quickly recover over the $27,400 resistance level and aim to post a greater high than the $27,992 peak seen on October 2.
Bitcoin bulls, if successful, may push the price to $30,000.

Short sellers should remain patient despite the fact that Bitcoin's weekly price forecast seems enticing. Investors wanting to purchase the dip should focus on whether or not the $25,900 support level holds in the daily time frame.
Bulls need Bitcoin's price to continue to rise and achieve a weekly candlestick close over $30,616 for the 2023 bull market surge to remain in bulls' favour.
