
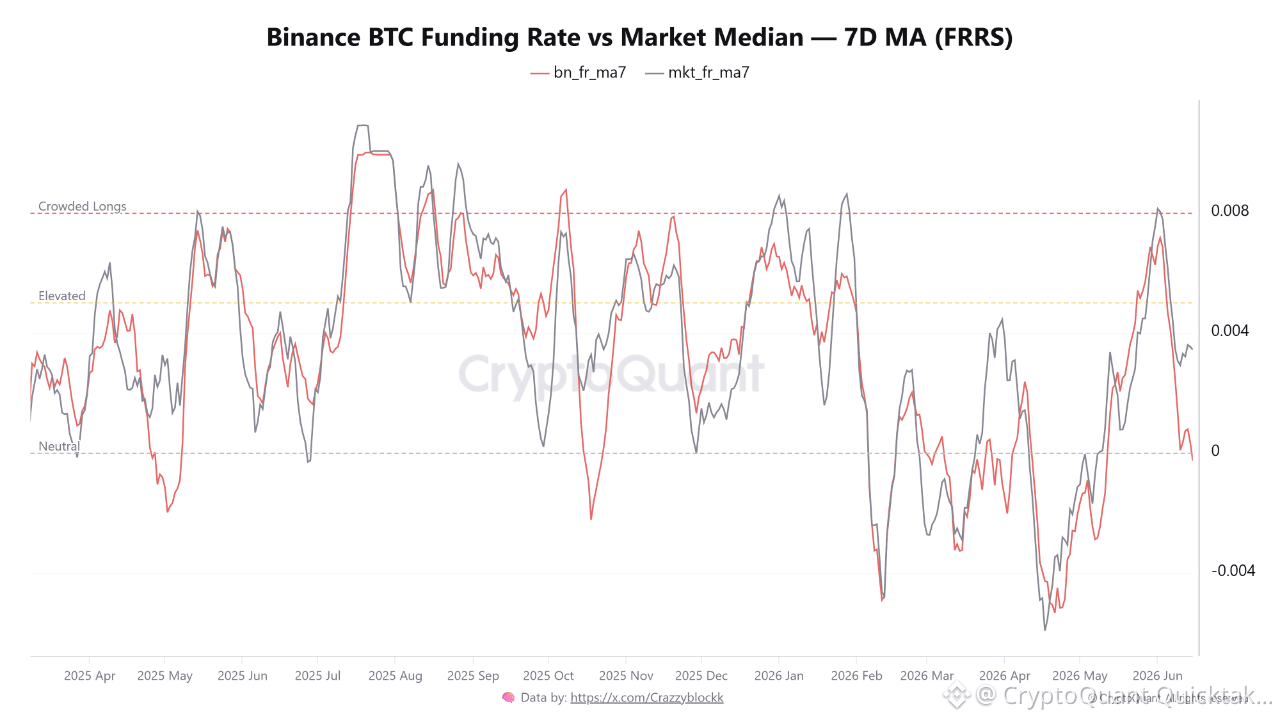
Binance funding rate is running 370bps below the 3-exchange median — bottom 2.8% of all readings since 2021. The dominant BTC futures venue is structurally more short than OKX and Bybit combined. That doesn't happen often.
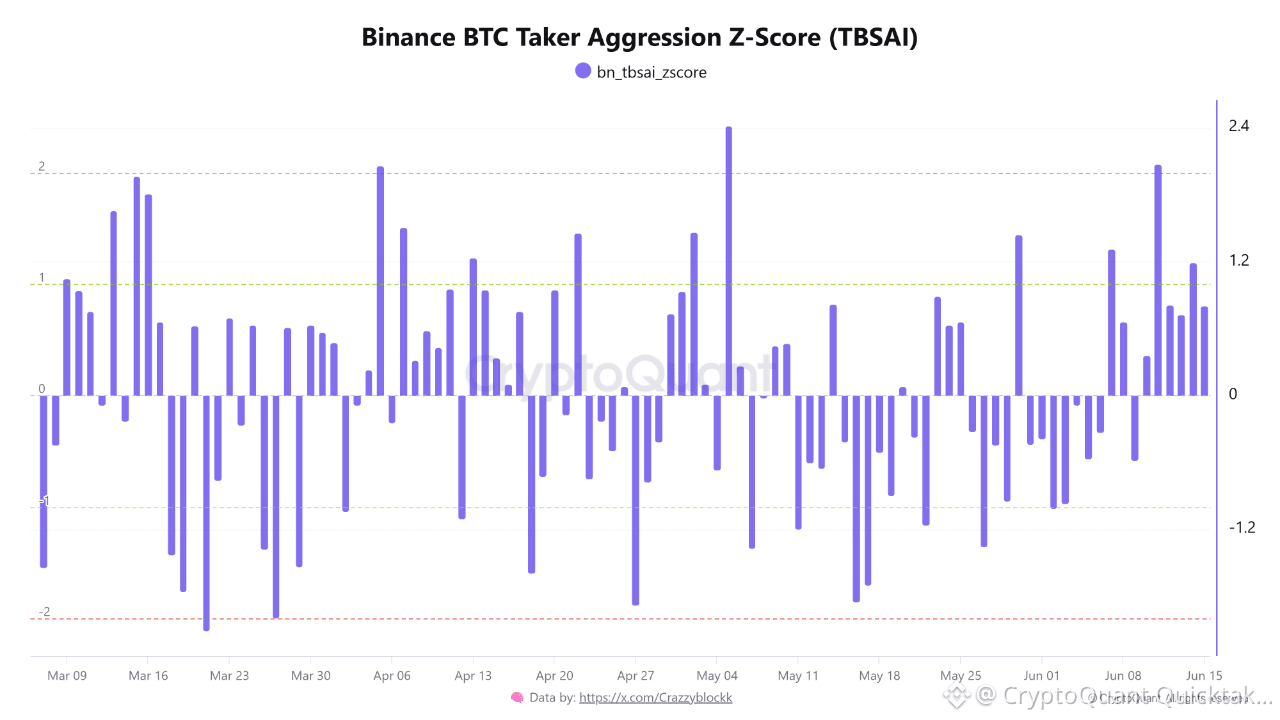
At the same time, taker buy aggression flipped hard. TBSAI z-score went from −1.85σ in mid-May to +0.809σ today — a +2.66σ swing in 30 days. Retail is hitting asks with real conviction. Someone is buying this dip aggressively.
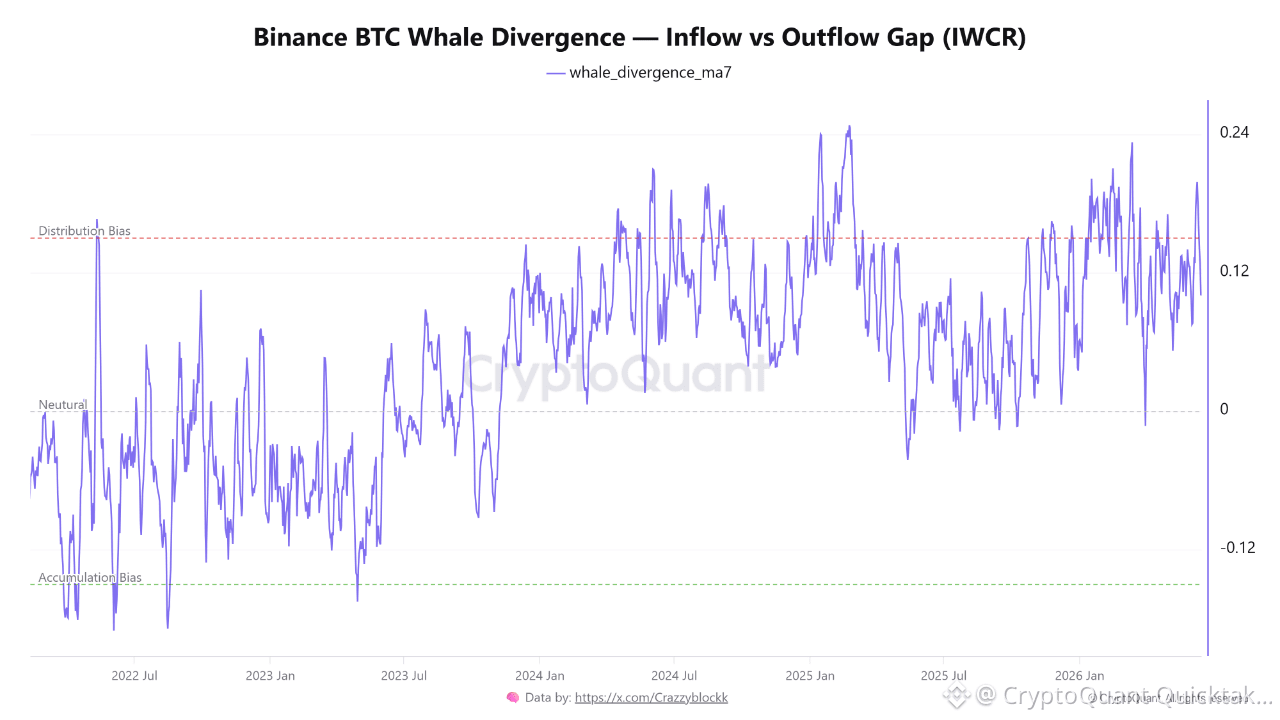
But who's selling it to them? The whale divergence tells you. IWCR inflow-outflow gap reads +0.1024, top 22.5% historically. Large wallets have been net distributors for weeks. The bid is retail. The ask is whales.
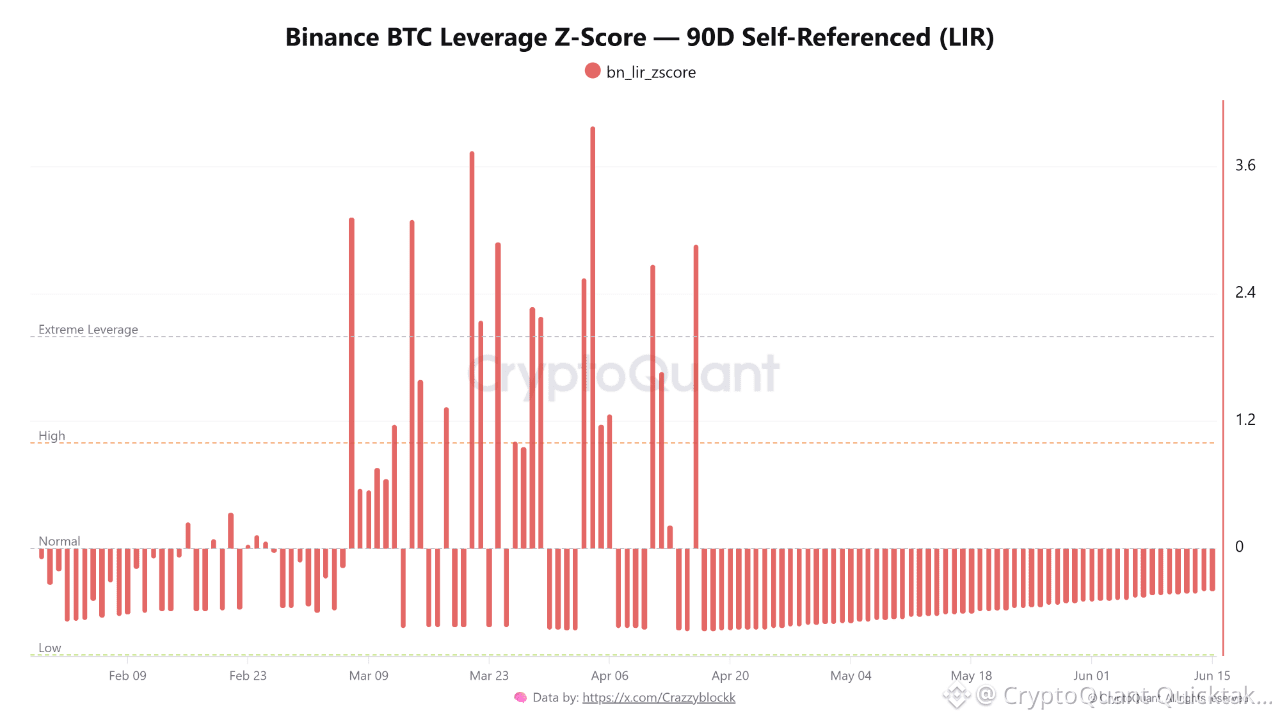
Leverage backdrop is clean — LIR z-score at −0.40σ, fully neutral after the April flush that peaked at +3.99σ. No crowding. No cascade setup. Whatever happens next, it won't be a leverage accident.
This is distribution-into-strength. Either the shorts get squeezed (TBSAI momentum supports it) or whales are right and this rolls over. LIR crossing +1.0σ is your tell — new leverage entering means the market picked a direction.
Binance is the single most data-rich exchange in crypto — highest derivatives volume, deepest order book, most active trader base. It deserves dedicated analytics, not recycled market-wide metrics that don't account for its structural uniqueness.
That's why I built this dashboard: 14 Binance-specific metrics across flows, whale activity, derivatives, stablecoins, and market structure. Every signal calibrated to Binance's own history. Built for the traders who use it every day.
Dashboard link below. The data is yours.
Written by Crazzyblockk