
密智君 Crypto Plus AI
1.8k Posts

密智君 Crypto Plus AI
分享AI Crypto创新洞见,AI实用工具 & 技巧分享,心得,热门话题探讨#CryptoAGI
106 Following
1.0K+ Followers
1.8K+ Liked
Posts
All
Quotes
Videos
Live
PINNED
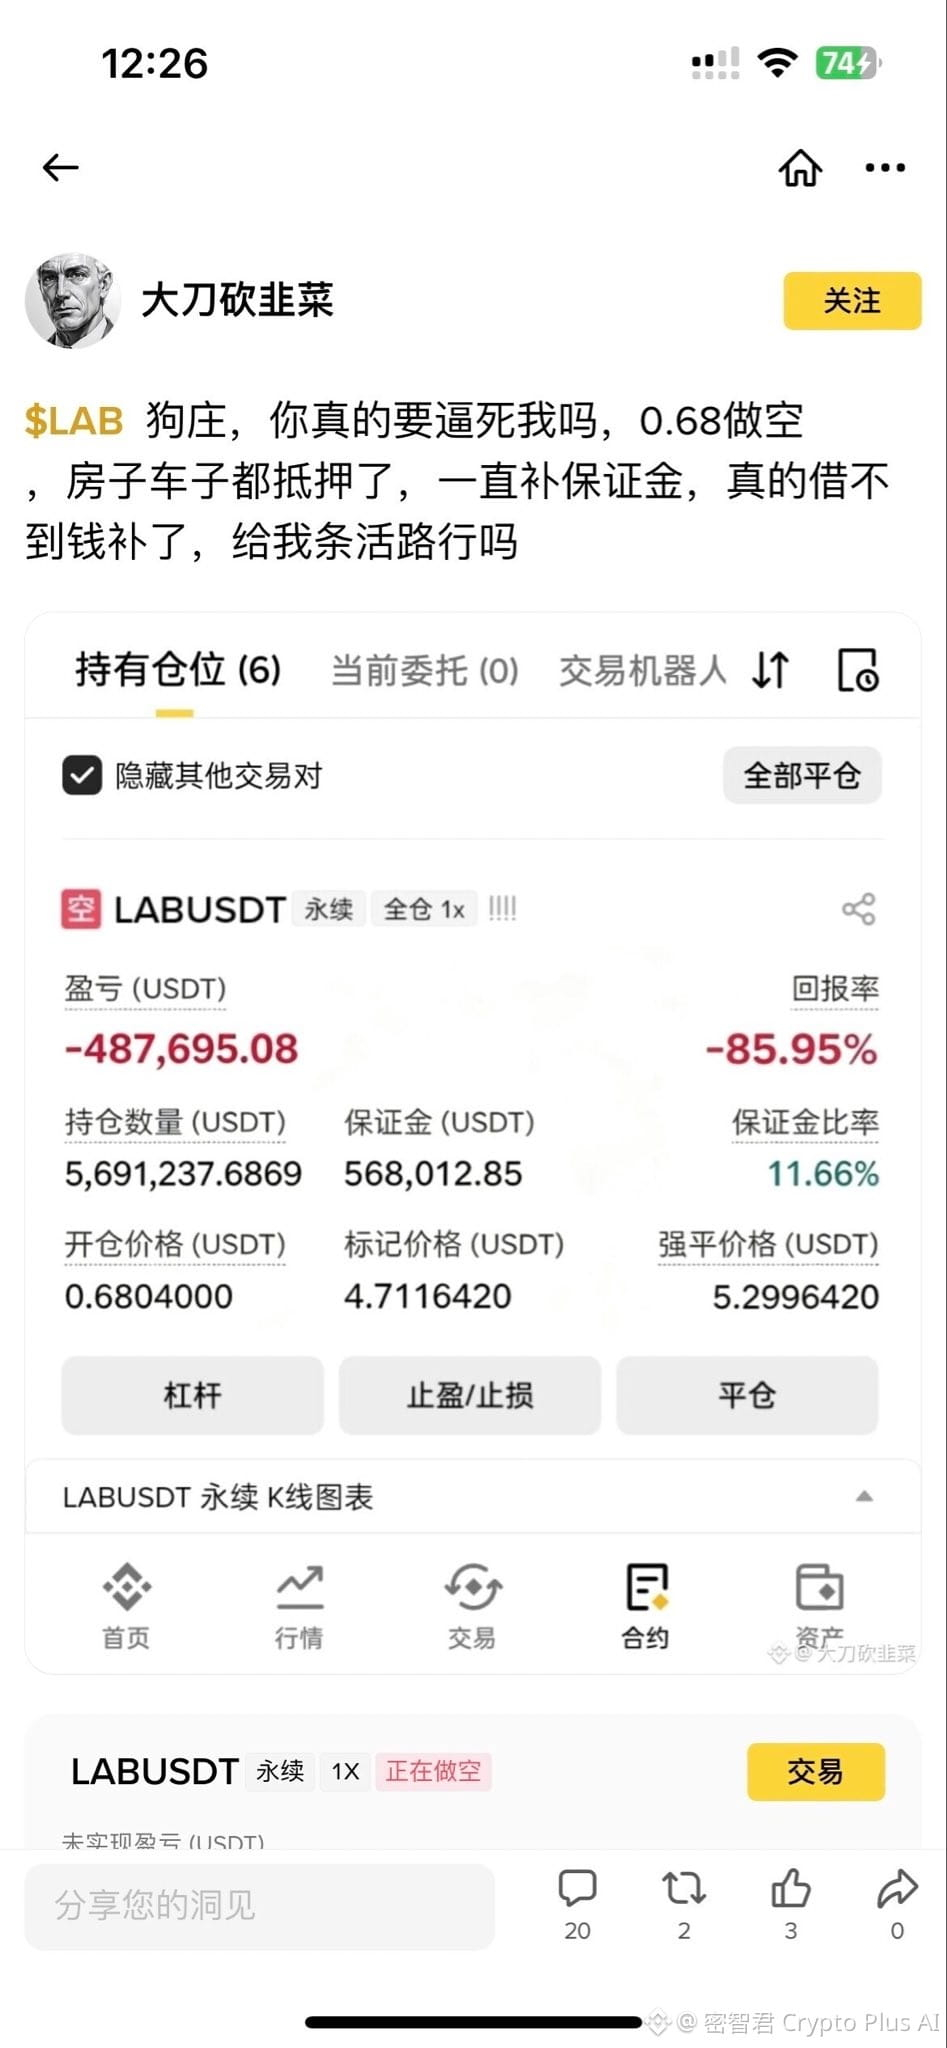
Whoa, I just saw this chart in the square, and I'm completely stunned. This isn't trading; it's practically a real-life 'suicidal attack'.
Brothers, did you see clearly? This dude went short on $LAB at 0.68, and now the price has skyrocketed to 4.7. He's sitting on a paper loss of $487,000, with a return rate of negative 85.95%. What's heartbreaking is his message: he's mortgaged his house and car, and has been margin-calling ever since; he really can't borrow any more money now. The liquidation price is at 5.29, just a step away from the current price.
Honestly, looking at this chart really reminds me of my past self. That desperate feeling of watching the price jump toward the liquidation line while being completely powerless is enough to drive anyone insane. This isn't shorting; it's like playing a 'life swap' game with the market makers. You thought 0.68 was a high point, but the market makers are telling you there's always a higher high.
What I admire (and feel sorry for) is his obsession. Going all-in short with 1x leverage, enduring nearly a 7x increase. That takes some serious 'courage' and a thick wallet, huh? But the trading market doesn’t care about tears, and definitely doesn’t believe in 'holding on for dear life'. You try to reason with the market makers, but they just want to drain your last drop of blood. $BTC #LAB
Brothers, did you see clearly? This dude went short on $LAB at 0.68, and now the price has skyrocketed to 4.7. He's sitting on a paper loss of $487,000, with a return rate of negative 85.95%. What's heartbreaking is his message: he's mortgaged his house and car, and has been margin-calling ever since; he really can't borrow any more money now. The liquidation price is at 5.29, just a step away from the current price.
Honestly, looking at this chart really reminds me of my past self. That desperate feeling of watching the price jump toward the liquidation line while being completely powerless is enough to drive anyone insane. This isn't shorting; it's like playing a 'life swap' game with the market makers. You thought 0.68 was a high point, but the market makers are telling you there's always a higher high.
What I admire (and feel sorry for) is his obsession. Going all-in short with 1x leverage, enduring nearly a 7x increase. That takes some serious 'courage' and a thick wallet, huh? But the trading market doesn’t care about tears, and definitely doesn’t believe in 'holding on for dear life'. You try to reason with the market makers, but they just want to drain your last drop of blood. $BTC #LAB
PINNED
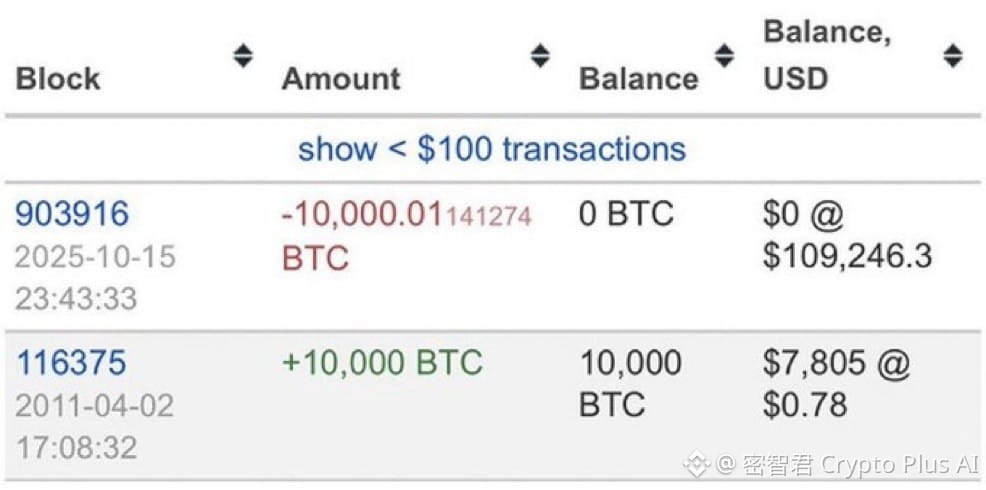
Wow, this guy made 140,000 times his investment in 14 years. Who else can be as awesome as him? In 2011, he spent less than $8,000 to buy 10,000 $BTC , when one Bitcoin was only $0.78.
So what happened? He just held on for 14 years! By October 2025, when Bitcoin broke through $109,000, he sold everything and cashed out over $1 billion. A 140,000 times return, this is not just investment, this is simply like cultivating immortality.
To be honest, what I admire most is not that he bought early, but that he was able to hold on. Over these 14 years, he experienced hundreds of crashes and endured four long bear markets lasting several years. How many times did the market halve, how many times did the media shout 'Bitcoin will go to zero', and he never wavered once. This kind of determination is really not something ordinary people can possess.
I used to have quite a few good stocks, but I sold when they rose two or three times, and cut losses when they fell by 20%. Seeing others get a 140,000 times increase, I can only mock myself: people like us who can't hold on deserve to miss out on big money.
Risk Warning: This kind of 'get rich quick myth' is an extreme case of survivor bias. Just because he made a fortune after 14 years, don’t think you can do the same. Investment requires caution; first, ask yourself if you can withstand a 90% drawdown.
What do you think? If you bought 10,000 Bitcoins in 2011, could you still hold on until now? Be honest in the comments, at which point would you get off the ride?
$BTC
So what happened? He just held on for 14 years! By October 2025, when Bitcoin broke through $109,000, he sold everything and cashed out over $1 billion. A 140,000 times return, this is not just investment, this is simply like cultivating immortality.
To be honest, what I admire most is not that he bought early, but that he was able to hold on. Over these 14 years, he experienced hundreds of crashes and endured four long bear markets lasting several years. How many times did the market halve, how many times did the media shout 'Bitcoin will go to zero', and he never wavered once. This kind of determination is really not something ordinary people can possess.
I used to have quite a few good stocks, but I sold when they rose two or three times, and cut losses when they fell by 20%. Seeing others get a 140,000 times increase, I can only mock myself: people like us who can't hold on deserve to miss out on big money.
Risk Warning: This kind of 'get rich quick myth' is an extreme case of survivor bias. Just because he made a fortune after 14 years, don’t think you can do the same. Investment requires caution; first, ask yourself if you can withstand a 90% drawdown.
What do you think? If you bought 10,000 Bitcoins in 2011, could you still hold on until now? Be honest in the comments, at which point would you get off the ride?
$BTC
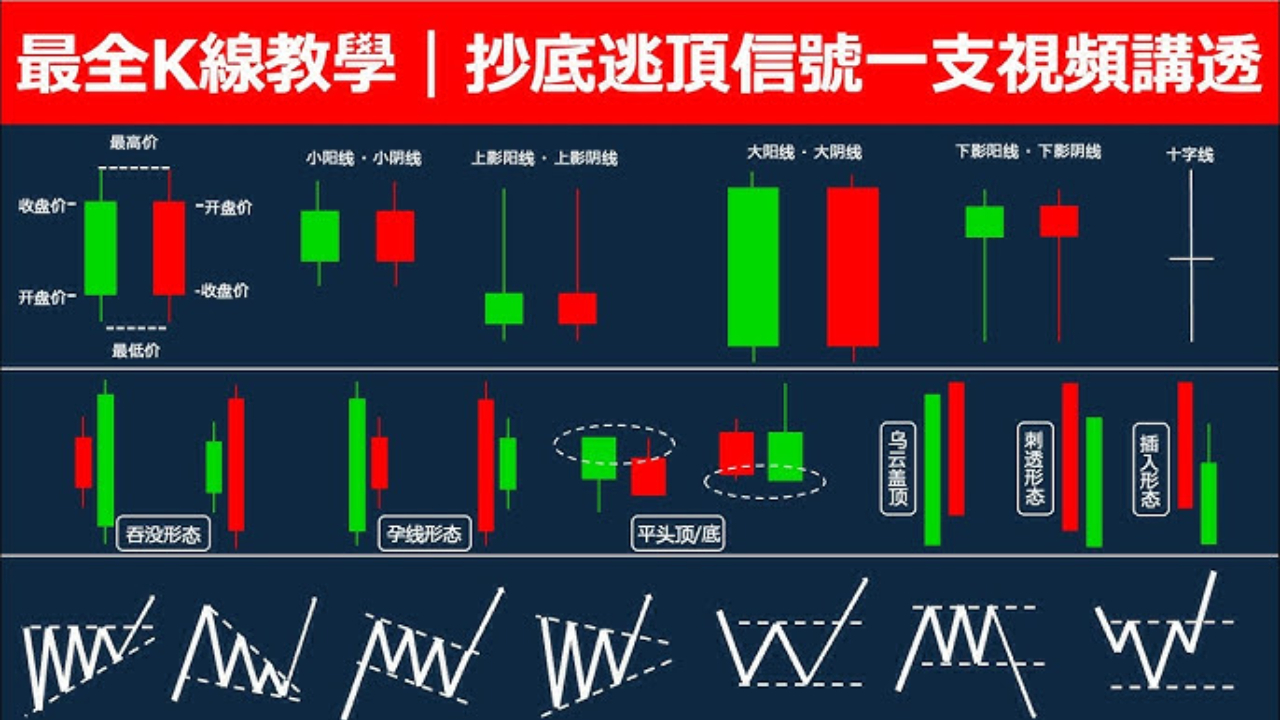
🎙️ K-line Trading Secrets: A Trading Strategy to Earn 100x Returns
End
02 h 02 m 03 s
47

BNB
Holding
-495.11
0
August 23, 2026|BTC holds at 77,000, after ETH’s lagging rally catches up it first hits the brakes—are people in the US stock market not paying attention anymore?
This morning $BTC quoted at $77,249, down 0.77% over 24 hours; $ETH quoted at $2,430, down 3.58%. BTC and ETH have not shown any clear pullback. I believe they’re starting to stabilize: BTC is up nearly 20% over the week; US spot BTC ETFs have seen net inflows for 5 straight trading days totaling about $1.92 billion; there’s no obvious capital outflow—only divergence starting around the $80,000 area.
In the US stock market’s last trading day, it rebounded: the Dow rose 0.98%, while the S&P 500 and Nasdaq each gained about 0.43%. Coinbase and Robinhood surged 8.2% and 13.7%, respectively; but on the weekly chart, all three major indices still closed lower. The yield on the 30-year US Treasury held at 5.276%; Brent crude is near $94. Fiscal pressure and energy-driven inflation have not been resolved. Now the market is simultaneously buying BTC and gold while also pressuring the dollar lower—the same logic as “the purchasing power of the dollar is being diluted.” Even if US stocks rise by 0.something percent, the funds have clearly shifted to the crypto track!
Over the weekend I’ll watch BTC at $76,500 and ETH at $2,390. Hold the levels—on the weekend it feels more like a turnover at high levels. If it continues to break down below and trading volume expands, that would suggest the chasing-buy capital is concentrating its exit.
Do you think BTC will climb above $80,000 sooner, or will it break below $75,000 and blow up the short side? #标普500结束周线连涨 #美股三大股指周线下跌
This morning $BTC quoted at $77,249, down 0.77% over 24 hours; $ETH quoted at $2,430, down 3.58%. BTC and ETH have not shown any clear pullback. I believe they’re starting to stabilize: BTC is up nearly 20% over the week; US spot BTC ETFs have seen net inflows for 5 straight trading days totaling about $1.92 billion; there’s no obvious capital outflow—only divergence starting around the $80,000 area.
In the US stock market’s last trading day, it rebounded: the Dow rose 0.98%, while the S&P 500 and Nasdaq each gained about 0.43%. Coinbase and Robinhood surged 8.2% and 13.7%, respectively; but on the weekly chart, all three major indices still closed lower. The yield on the 30-year US Treasury held at 5.276%; Brent crude is near $94. Fiscal pressure and energy-driven inflation have not been resolved. Now the market is simultaneously buying BTC and gold while also pressuring the dollar lower—the same logic as “the purchasing power of the dollar is being diluted.” Even if US stocks rise by 0.something percent, the funds have clearly shifted to the crypto track!
Over the weekend I’ll watch BTC at $76,500 and ETH at $2,390. Hold the levels—on the weekend it feels more like a turnover at high levels. If it continues to break down below and trading volume expands, that would suggest the chasing-buy capital is concentrating its exit.
Do you think BTC will climb above $80,000 sooner, or will it break below $75,000 and blow up the short side? #标普500结束周线连涨 #美股三大股指周线下跌
🎙️ The Bull Market Is Here: The Trader’s Last Chance to Turn the Tables in 2026

End
50 m 54 s
4
BNB
Holding
-471.54
0
August 22, 2026|BTC surges toward $80,000, lifting the entire Shansai coin market—has the bull run arrived?
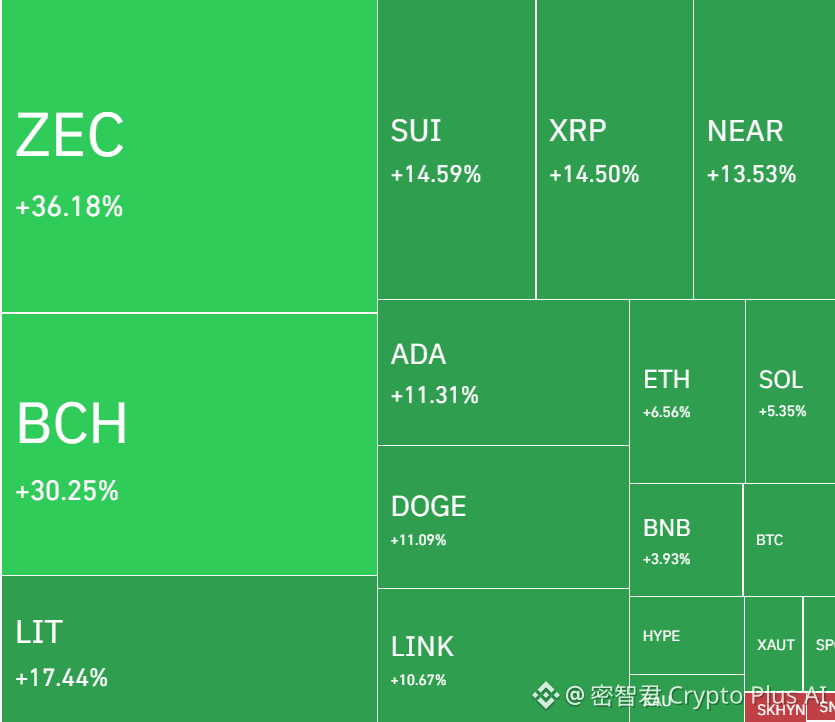
As of now $BTC is trading at $77,877, up 4.58% in 24 hours; $ETH is trading at $2,524, up 6.86%. I believe this round is no longer just short covering: U.S. spot BTC ETFs saw net inflows of $1.6 billion from Monday to Thursday, with $606 million inflow on Thursday alone—spot buying is starting to take the baton.
Last night, the Dow rose 0.98%, while the S&P 500 and Nasdaq both rose 0.43%, but all three major indexes still closed lower on the weekly chart. At the same time, the yield on 30-year U.S. Treasuries rose to 5.276%, and Brent crude broke above $94. The market is worrying about fiscal deficits, energy-driven inflation, and the purchasing power of the dollar, while pushing funds toward BTC and gold. This logic seems more sustained than simply betting on rate cuts.
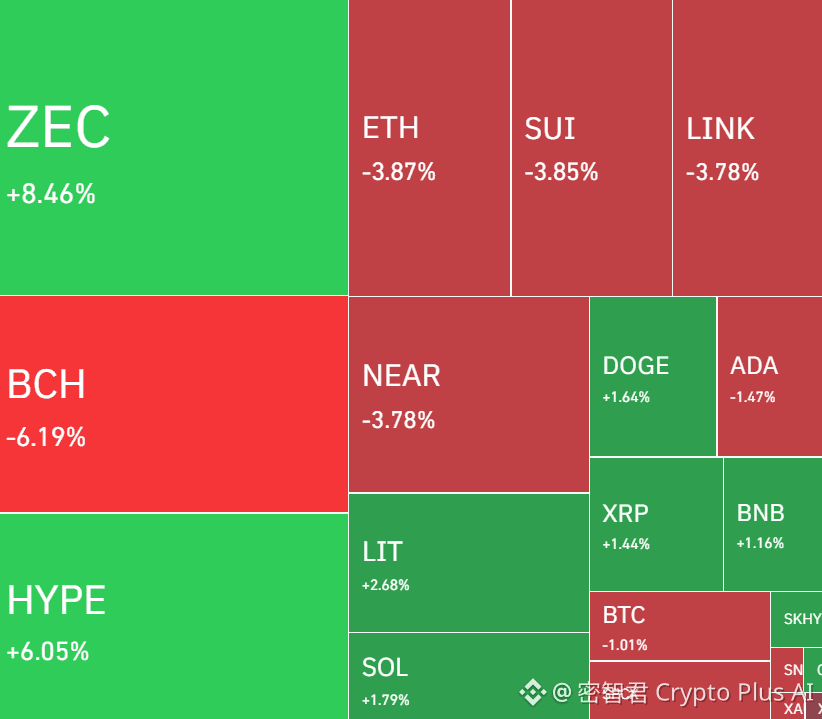
On the board, BTC has already reached $79,464. Near the $80,000 mark, there will inevitably be profit-taking orders. ETH is up nearly 30% over the past seven days, showing stronger catch-up momentum—but the risk of chasing is also higher. $ZEC , $BCH is up more than 30% in a day; funds are rotating into the crypto sector. U.S. stocks have already gone quiet!
Over the weekend, I mainly want to see whether BTC can hold $76,000 and whether ETH can stay above $2,500. Holding indicates that capital is willing to re-buy on pullbacks; if it breaks down and trading volume shrinks, the market is more likely to enter a high-range consolidation phase.
Do you think this time BTC will directly break above $80,000, or will it first shake out a batch of chasing buyers? #比特币创2023年3月来最佳周表现 #比特币日内触及75500美元
As of now $BTC is trading at $77,877, up 4.58% in 24 hours; $ETH is trading at $2,524, up 6.86%. I believe this round is no longer just short covering: U.S. spot BTC ETFs saw net inflows of $1.6 billion from Monday to Thursday, with $606 million inflow on Thursday alone—spot buying is starting to take the baton.
Last night, the Dow rose 0.98%, while the S&P 500 and Nasdaq both rose 0.43%, but all three major indexes still closed lower on the weekly chart. At the same time, the yield on 30-year U.S. Treasuries rose to 5.276%, and Brent crude broke above $94. The market is worrying about fiscal deficits, energy-driven inflation, and the purchasing power of the dollar, while pushing funds toward BTC and gold. This logic seems more sustained than simply betting on rate cuts.
On the board, BTC has already reached $79,464. Near the $80,000 mark, there will inevitably be profit-taking orders. ETH is up nearly 30% over the past seven days, showing stronger catch-up momentum—but the risk of chasing is also higher. $ZEC , $BCH is up more than 30% in a day; funds are rotating into the crypto sector. U.S. stocks have already gone quiet!
Over the weekend, I mainly want to see whether BTC can hold $76,000 and whether ETH can stay above $2,500. Holding indicates that capital is willing to re-buy on pullbacks; if it breaks down and trading volume shrinks, the market is more likely to enter a high-range consolidation phase.
Do you think this time BTC will directly break above $80,000, or will it first shake out a batch of chasing buyers? #比特币创2023年3月来最佳周表现 #比特币日内触及75500美元
At 30, I was laid off and carried an 80 million yuan mortgage; by 35, I can’t even find a job anymore! Does this world not need people over 35?
A self-described graduate of a “Project 211” university with both a bachelor’s and master’s degree said that at 30, they were laid off from an internet company. They interviewed at four or five companies but still couldn’t find a suitable position, all while still having an 8-million-yuan mortgage.
When internet salaries were high, an 8-million-yuan mortgage was only part of the monthly cash flow. After the layoffs, wages could disappear overnight, while monthly payments, interest, and living costs would not pause.
The house doesn’t immediately drop to zero in value, but people may lose their negotiating power first—afraid to take time off, afraid to switch careers, and also having a hard time refusing pay cuts.
In the past, people understood high education, a big-company resume, and prime-city property as three layers of safety nets. Now we realize they may all depend on the same high salary. Once income breaks off, the heavier the assets are, the fewer choices you actually have.
If it were you, would you first accept a pay cut to secure cash flow, or sell the house and start over?#AI $BTC
A self-described graduate of a “Project 211” university with both a bachelor’s and master’s degree said that at 30, they were laid off from an internet company. They interviewed at four or five companies but still couldn’t find a suitable position, all while still having an 8-million-yuan mortgage.
When internet salaries were high, an 8-million-yuan mortgage was only part of the monthly cash flow. After the layoffs, wages could disappear overnight, while monthly payments, interest, and living costs would not pause.
The house doesn’t immediately drop to zero in value, but people may lose their negotiating power first—afraid to take time off, afraid to switch careers, and also having a hard time refusing pay cuts.
In the past, people understood high education, a big-company resume, and prime-city property as three layers of safety nets. Now we realize they may all depend on the same high salary. Once income breaks off, the heavier the assets are, the fewer choices you actually have.
If it were you, would you first accept a pay cut to secure cash flow, or sell the house and start over?#AI $BTC
After Evergrande collapsed, Evergrande had 1,318 unfinished residential projects nationwide, 1.62 million apartments, leaving roughly 5 million people homeless...
Xü Jiayin was sentenced to life in prison, but what he left behind is a mess that cannot be handled by a single court judgment.
At its peak, Evergrande carried debts of over 300 billion US dollars and developed about 1,300 projects across roughly 280 cities nationwide.
The punishment for Xu Jiayin only resolved the issue of the responsible individuals. Whether the remaining projects can be completed, where the funding will come from, and how much cost local governments and financial institutions will bear—these factors will determine when this crisis ends.
If an uncompleted home can make homebuyers shoulder a 30-year mortgage in advance, then who, exactly, is the pre-sale system truly protecting? #许家印认罪 $BTC #美国初请失业金人数降至20.6万
Xü Jiayin was sentenced to life in prison, but what he left behind is a mess that cannot be handled by a single court judgment.
At its peak, Evergrande carried debts of over 300 billion US dollars and developed about 1,300 projects across roughly 280 cities nationwide.
The punishment for Xu Jiayin only resolved the issue of the responsible individuals. Whether the remaining projects can be completed, where the funding will come from, and how much cost local governments and financial institutions will bear—these factors will determine when this crisis ends.
If an uncompleted home can make homebuyers shoulder a 30-year mortgage in advance, then who, exactly, is the pre-sale system truly protecting? #许家印认罪 $BTC #美国初请失业金人数降至20.6万
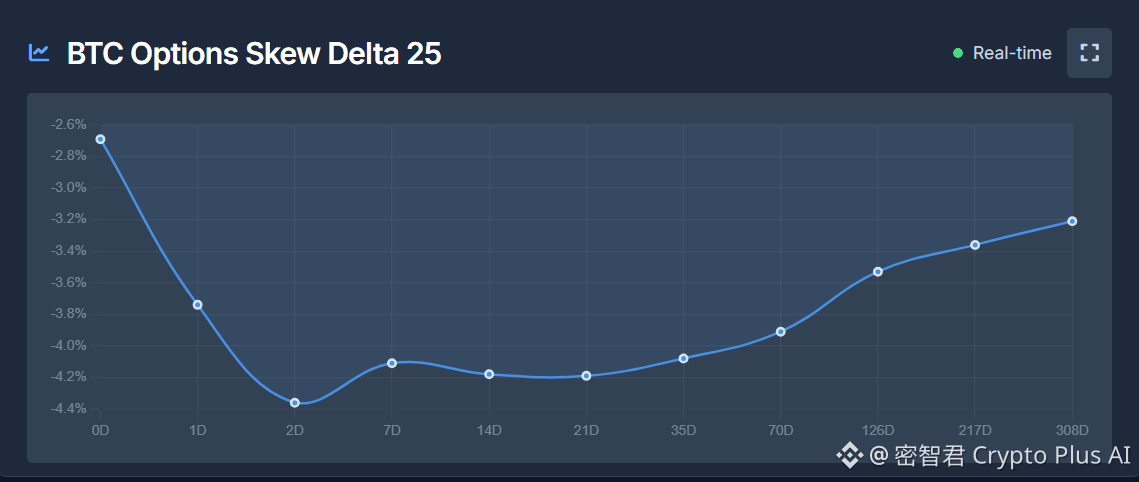
In-Depth Analysis: Is a New BTC Bull Market Coming?
Current Indicator vs. Historical Comparison
$BTC Around $73,800 is still 41.5% down from the prior peak of $126,200
$ETH Around $2,338 is still 52.8% down from the prior peak of $4,954
BTC futures OI is around $55.3B; leverage has risen back to a high level
BTC 24h liquidations of about $781M indicate that the rally includes a clear short-covering component
BTC 30-day realized volatility rebounded to about 27.2% before
Long-term mean is close to 80%; in the past 30 days, long-term holder supply decreased by 356,000 BTC
There are still real sell orders above BTC
Yesterday’s rise was driven by three sources of capital:
The U.S. Treasury expanded long-term bond repurchase operations, easing liquidity panic;
Trump promoted the “CLARITY Act,” reducing regulatory discounting;
After the price broke out, shorts were forced to cover.
Spot capital is indeed participating, but the continuity is still not enough.
The BTC ETF saw an initial single-day inflow of about $517M, but in the latest trading day it switched back to a net outflow of 1,132 BTC;
Meanwhile, the ETH ETF had a large inflow of $189M, then fell to a net inflow of 3,947 ETH.
Institutions have not retreated, but they have also not formed continuous “buying everything” flows.
Updated scenario assessment:
45%: BTC trades back in the $68,000—$80,000 range, rotating to digest short-covering and long-term holder sell supply.
35%: Weekly closes hold above $76,000, then a breakout above $80,000 occurs; ETF flows resume continuously, confirming a new bull market.
20%: A drop below $68,000 and a loss of $63,500 prove that this time is mainly a bear-market rebound driven by policy stimulus.
For ETH to prove that capital is shifting from defensive positioning to fully risk-on trading, it needs to hold above $2,500 and continue to outperform BTC. Otherwise, when BTC rises and ETH lags, it still belongs to a large-cap core-asset “crowd trade” with big funds in the lead.
October does have a pullback window, but it’s not due to a “October curse.” On September 15—16 and October 27—28, there were Federal Reserve meetings; combined with oil prices, long-term Treasury yields, regulatory voting, and expectations for U.S. midterm elections, any item turning worse could trigger a 15%—25% adjustment.
My subjective probability that there will be a drawdown of more than 15% in October is about 40%; it hasn’t reached the baseline scenario yet.
In crypto, people are always overly optimistic about bull markets and misjudge bear markets. If BTC rises 10% in a day, it could still fall 50% over three months—holding on is the biggest success! What do you think?#BTC突破$72000 #ETH突破$2300
Current Indicator vs. Historical Comparison
$BTC Around $73,800 is still 41.5% down from the prior peak of $126,200
$ETH Around $2,338 is still 52.8% down from the prior peak of $4,954
BTC futures OI is around $55.3B; leverage has risen back to a high level
BTC 24h liquidations of about $781M indicate that the rally includes a clear short-covering component
BTC 30-day realized volatility rebounded to about 27.2% before
Long-term mean is close to 80%; in the past 30 days, long-term holder supply decreased by 356,000 BTC
There are still real sell orders above BTC
Yesterday’s rise was driven by three sources of capital:
The U.S. Treasury expanded long-term bond repurchase operations, easing liquidity panic;
Trump promoted the “CLARITY Act,” reducing regulatory discounting;
After the price broke out, shorts were forced to cover.
Spot capital is indeed participating, but the continuity is still not enough.
The BTC ETF saw an initial single-day inflow of about $517M, but in the latest trading day it switched back to a net outflow of 1,132 BTC;
Meanwhile, the ETH ETF had a large inflow of $189M, then fell to a net inflow of 3,947 ETH.
Institutions have not retreated, but they have also not formed continuous “buying everything” flows.
Updated scenario assessment:
45%: BTC trades back in the $68,000—$80,000 range, rotating to digest short-covering and long-term holder sell supply.
35%: Weekly closes hold above $76,000, then a breakout above $80,000 occurs; ETF flows resume continuously, confirming a new bull market.
20%: A drop below $68,000 and a loss of $63,500 prove that this time is mainly a bear-market rebound driven by policy stimulus.
For ETH to prove that capital is shifting from defensive positioning to fully risk-on trading, it needs to hold above $2,500 and continue to outperform BTC. Otherwise, when BTC rises and ETH lags, it still belongs to a large-cap core-asset “crowd trade” with big funds in the lead.
October does have a pullback window, but it’s not due to a “October curse.” On September 15—16 and October 27—28, there were Federal Reserve meetings; combined with oil prices, long-term Treasury yields, regulatory voting, and expectations for U.S. midterm elections, any item turning worse could trigger a 15%—25% adjustment.
My subjective probability that there will be a drawdown of more than 15% in October is about 40%; it hasn’t reached the baseline scenario yet.
In crypto, people are always overly optimistic about bull markets and misjudge bear markets. If BTC rises 10% in a day, it could still fall 50% over three months—holding on is the biggest success! What do you think?#BTC突破$72000 #ETH突破$2300
August 21, 2026|BTC surges to 75,000, ETH to 2,300—Is the bull market really coming?
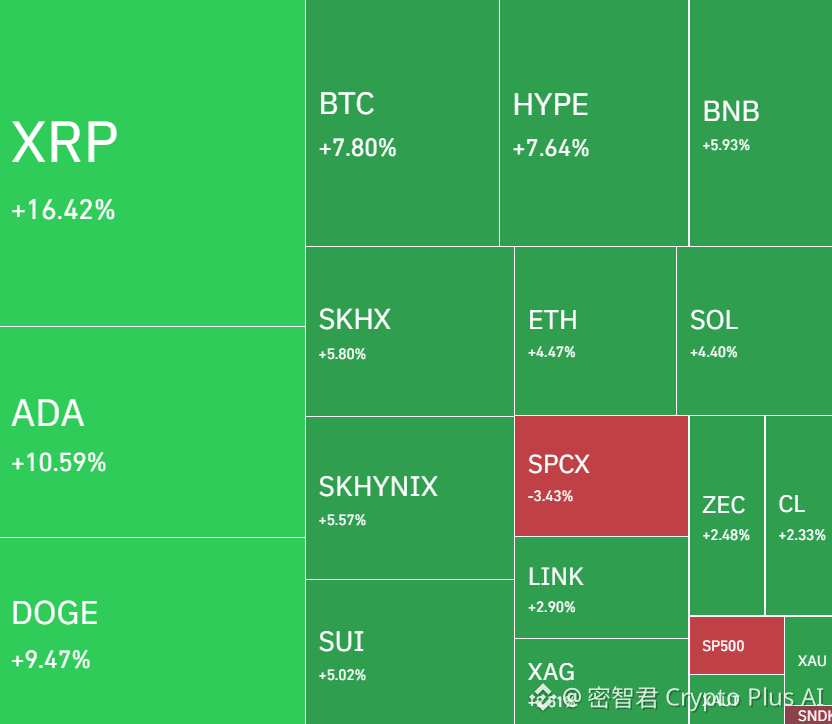
The biggest signal from yesterday was that BTC and ETH’s rally lifted altcoins across the board. Meanwhile, last night’s U.S. stocks were broadly weaker: the S&P 500 fell 0.87%, the Nasdaq dropped 1%, $SPCX briefly slid more than 4%, the 10-year U.S. Treasury yield rose again to around 4.70%, and oil prices continued to climb after talks between the U.S. and Iran were stalled. By conventional logic, high interest rates and high oil prices should suppress risk assets—but $BTC instead jumped to around $74,800, up more than 7.8% in 24 hours, with trading volume rising to $56 billion.
The immediate catalyst came from Trump again urging Congress to advance a bill on the crypto market structure. Coinbase and Strategy both moved up more than 7% in tandem. Also, short-covering triggered by the prior day’s bond repo activity pushed BTC further toward $74,000. $ETH is about $2,340, up only roughly 4.4% in 24 hours, suggesting that capital is moving from yesterday’s ETH catch-up rally back to BTC dominance.
Today, I’ll first watch whether $74,000 can hold on increased volume. If it holds, capital may continue to spread into ETH and major altcoins. But if it quickly falls back below $70,000, then this sharp rally over the past two days may look more like a combo effect of policy headlines plus panic-driven short covering.
Risk warning: Bond yields and oil prices are still trending upward—chasing at high levels can easily run into a fast pullback.
For this breakout, do you think it marks the start of a new trend, or just a sudden surge that squeezes the shorts out? #BTC突破$72000 #ETH突破$2300
The biggest signal from yesterday was that BTC and ETH’s rally lifted altcoins across the board. Meanwhile, last night’s U.S. stocks were broadly weaker: the S&P 500 fell 0.87%, the Nasdaq dropped 1%, $SPCX briefly slid more than 4%, the 10-year U.S. Treasury yield rose again to around 4.70%, and oil prices continued to climb after talks between the U.S. and Iran were stalled. By conventional logic, high interest rates and high oil prices should suppress risk assets—but $BTC instead jumped to around $74,800, up more than 7.8% in 24 hours, with trading volume rising to $56 billion.
The immediate catalyst came from Trump again urging Congress to advance a bill on the crypto market structure. Coinbase and Strategy both moved up more than 7% in tandem. Also, short-covering triggered by the prior day’s bond repo activity pushed BTC further toward $74,000. $ETH is about $2,340, up only roughly 4.4% in 24 hours, suggesting that capital is moving from yesterday’s ETH catch-up rally back to BTC dominance.
Today, I’ll first watch whether $74,000 can hold on increased volume. If it holds, capital may continue to spread into ETH and major altcoins. But if it quickly falls back below $70,000, then this sharp rally over the past two days may look more like a combo effect of policy headlines plus panic-driven short covering.
Risk warning: Bond yields and oil prices are still trending upward—chasing at high levels can easily run into a fast pullback.
For this breakout, do you think it marks the start of a new trend, or just a sudden surge that squeezes the shorts out? #BTC突破$72000 #ETH突破$2300
So tragic! The middle class dies from financial management, the big shots die from ambition, and the rich die from trusts.
With one highly impactful line, the big brother described the financial risks different social classes may face, and said that in these years he’s seen many cases of the middle class going bankrupt and falling back into poverty.
Case details: Income and losses: The person involved once earned tens of millions a year, and within 5 years wiped out 25 million yuan in savings, taking on 3.2 million yuan in debt.
Current situation: From owning six companies to “returning to poverty in middle age”—high income can’t offset wrong choices.
So, reincarnation is a technical skill, isn’t it? $GOOGL.US #信托基金
With one highly impactful line, the big brother described the financial risks different social classes may face, and said that in these years he’s seen many cases of the middle class going bankrupt and falling back into poverty.
Case details: Income and losses: The person involved once earned tens of millions a year, and within 5 years wiped out 25 million yuan in savings, taking on 3.2 million yuan in debt.
Current situation: From owning six companies to “returning to poverty in middle age”—high income can’t offset wrong choices.
So, reincarnation is a technical skill, isn’t it? $GOOGL.US #信托基金
So damn unlucky! Millennials born in the 1980s may be the unluckiest generation in China’s history.
Some data illustrates the debt pressure on those born in the 1980s: in 2026, about 212 million of them, with per-capita liabilities reportedly ranging from 210,000 to 687,000 yuan. Mortgage loans make up more than 70% of their debt.
The video also says that, on average, monthly mortgage payments for the post-80s group account for about 57% of their income, and in first-tier cities it even exceeds 65%. From buying a home and starting a family to now carrying huge debt—how much pressure has this generation really had to endure?$BNB #80后
Some data illustrates the debt pressure on those born in the 1980s: in 2026, about 212 million of them, with per-capita liabilities reportedly ranging from 210,000 to 687,000 yuan. Mortgage loans make up more than 70% of their debt.
The video also says that, on average, monthly mortgage payments for the post-80s group account for about 57% of their income, and in first-tier cities it even exceeds 65%. From buying a home and starting a family to now carrying huge debt—how much pressure has this generation really had to endure?$BNB #80后
The 30 million yuan movie box office from Niulai—this theme song should be worth 10 million! <r>“After the Rain, the Clear Breeze Has a Fragrance”</r>—the animated film Niulai theme song. Someone says this is the best movie ending they’ve seen even decades later. Just on that point alone, Niulai ushered in a new era of cinema.
The comments section is full of praise for this film: Picasso’s style, Van Gogh’s colors, a return to childlike innocence, simplicity that leads to the truth—time will prove the classics on every page of Niulai.
Niulai’s worldview, social value, emotional value, and market value are just beginning to be explored. Calling it “bad” is a shallow kind of understanding.
This mother is truly remarkable [Strong]. On the road of a child’s growth, the mother tells you to love the land where you grow, and to love your own life. The painstaking effort behind it is truly not easy!
So Niulai is a heartfelt, sincere animated film—it’s absolutely not some trash movie. Do you agree? #牛来 $牛来
The comments section is full of praise for this film: Picasso’s style, Van Gogh’s colors, a return to childlike innocence, simplicity that leads to the truth—time will prove the classics on every page of Niulai.
Niulai’s worldview, social value, emotional value, and market value are just beginning to be explored. Calling it “bad” is a shallow kind of understanding.
This mother is truly remarkable [Strong]. On the road of a child’s growth, the mother tells you to love the land where you grow, and to love your own life. The painstaking effort behind it is truly not easy!
So Niulai is a heartfelt, sincere animated film—it’s absolutely not some trash movie. Do you agree? #牛来 $牛来
August 20, 2026|Wow, did the “bull show up”? ETH surges 18%, most major coins move together, yet US stocks start to fall—has capital rotation finally reached Crypto?
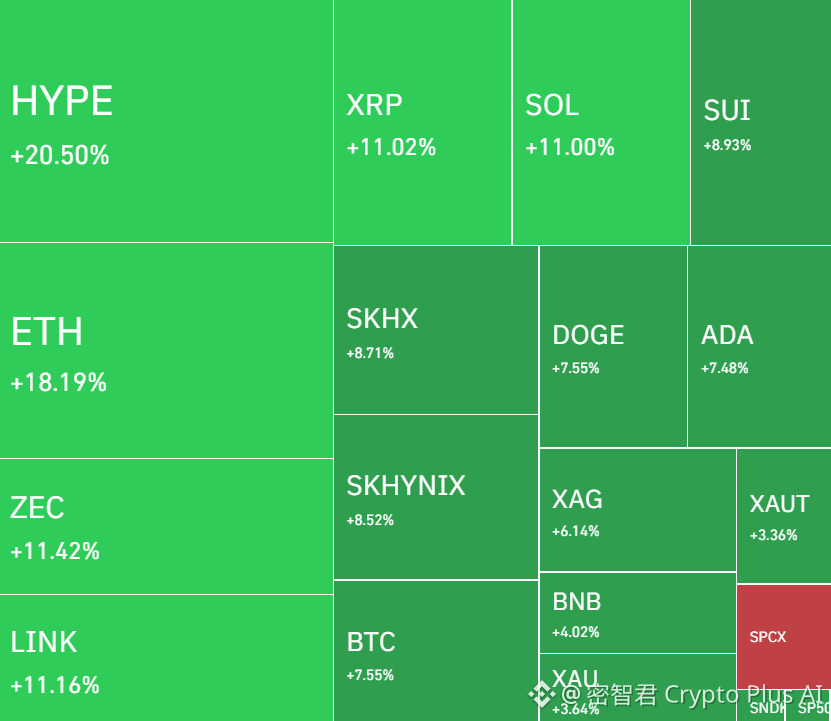
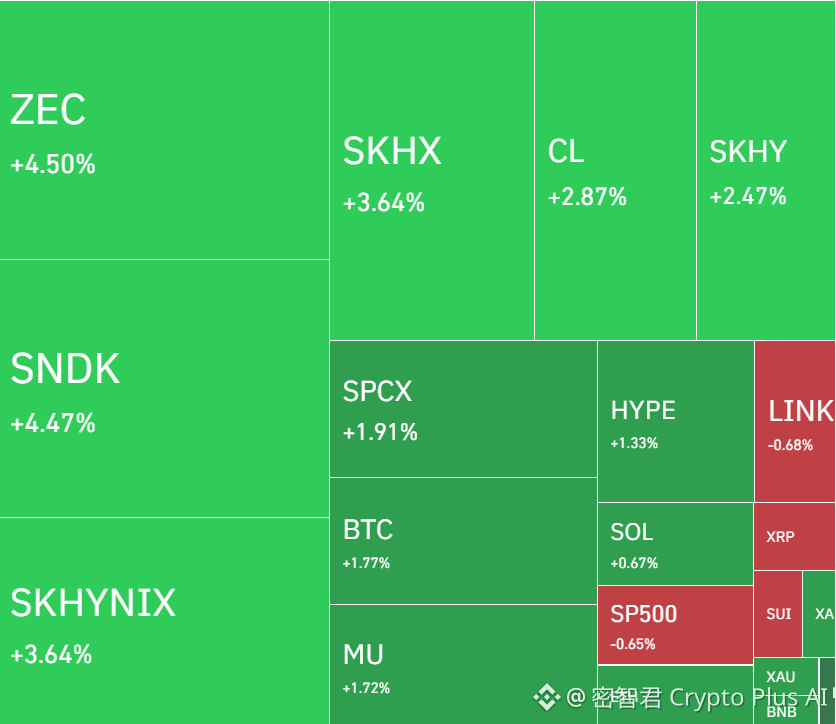
After a night’s sleep, $BTC surged to around $69,500, up 7.7% in 24 hours; $ETH is even stronger—at one point it even touched $2,328, up more than 18% in 24 hours, with trading volume expanding to $30.4 billion. US stocks are broadly down: SNDK and SPCX both show small declines!
The trigger may come from the bond market. The U.S. Treasury increased its long-term bond repo size from $2 billion to $4 billion, temporarily easing pressure on long bonds, and risk capital quickly flowed back. BTC first broke through, then ETH played catch-up—suggesting the market has shifted from “only holding the big pie” to high-volatility assets, though such a steep rally also includes short-covering.
Asian tech stocks have another catalyst: $SKHY Hynix announced a buyback and cancellation of about $28.6 billion worth of treasury shares—storage-related sectors may see a rebound. However, oil prices are still around $92, and inflation and geopolitical risks have not gone away. In China A-shares, Unitree Technology saw a huge jump at the open; as of yesterday, it was up 680%, briefly pushing toward the 1,200 yuan level.
Today, I mainly watch whether BTC can hold above $68,000, and whether ETH, after pulling back to $2,100–$2,200, will have good support. If it can hold, BTC should start an upward trend. Do you think BTC will break above 75,000 by the end of the month, or fall back to 61,000? #美国30年期国债收益率创2002年来新高 #美国存储股延续跌势
After a night’s sleep, $BTC surged to around $69,500, up 7.7% in 24 hours; $ETH is even stronger—at one point it even touched $2,328, up more than 18% in 24 hours, with trading volume expanding to $30.4 billion. US stocks are broadly down: SNDK and SPCX both show small declines!
The trigger may come from the bond market. The U.S. Treasury increased its long-term bond repo size from $2 billion to $4 billion, temporarily easing pressure on long bonds, and risk capital quickly flowed back. BTC first broke through, then ETH played catch-up—suggesting the market has shifted from “only holding the big pie” to high-volatility assets, though such a steep rally also includes short-covering.
Asian tech stocks have another catalyst: $SKHY Hynix announced a buyback and cancellation of about $28.6 billion worth of treasury shares—storage-related sectors may see a rebound. However, oil prices are still around $92, and inflation and geopolitical risks have not gone away. In China A-shares, Unitree Technology saw a huge jump at the open; as of yesterday, it was up 680%, briefly pushing toward the 1,200 yuan level.
Today, I mainly watch whether BTC can hold above $68,000, and whether ETH, after pulling back to $2,100–$2,200, will have good support. If it can hold, BTC should start an upward trend. Do you think BTC will break above 75,000 by the end of the month, or fall back to 61,000? #美国30年期国债收益率创2002年来新高 #美国存储股延续跌势
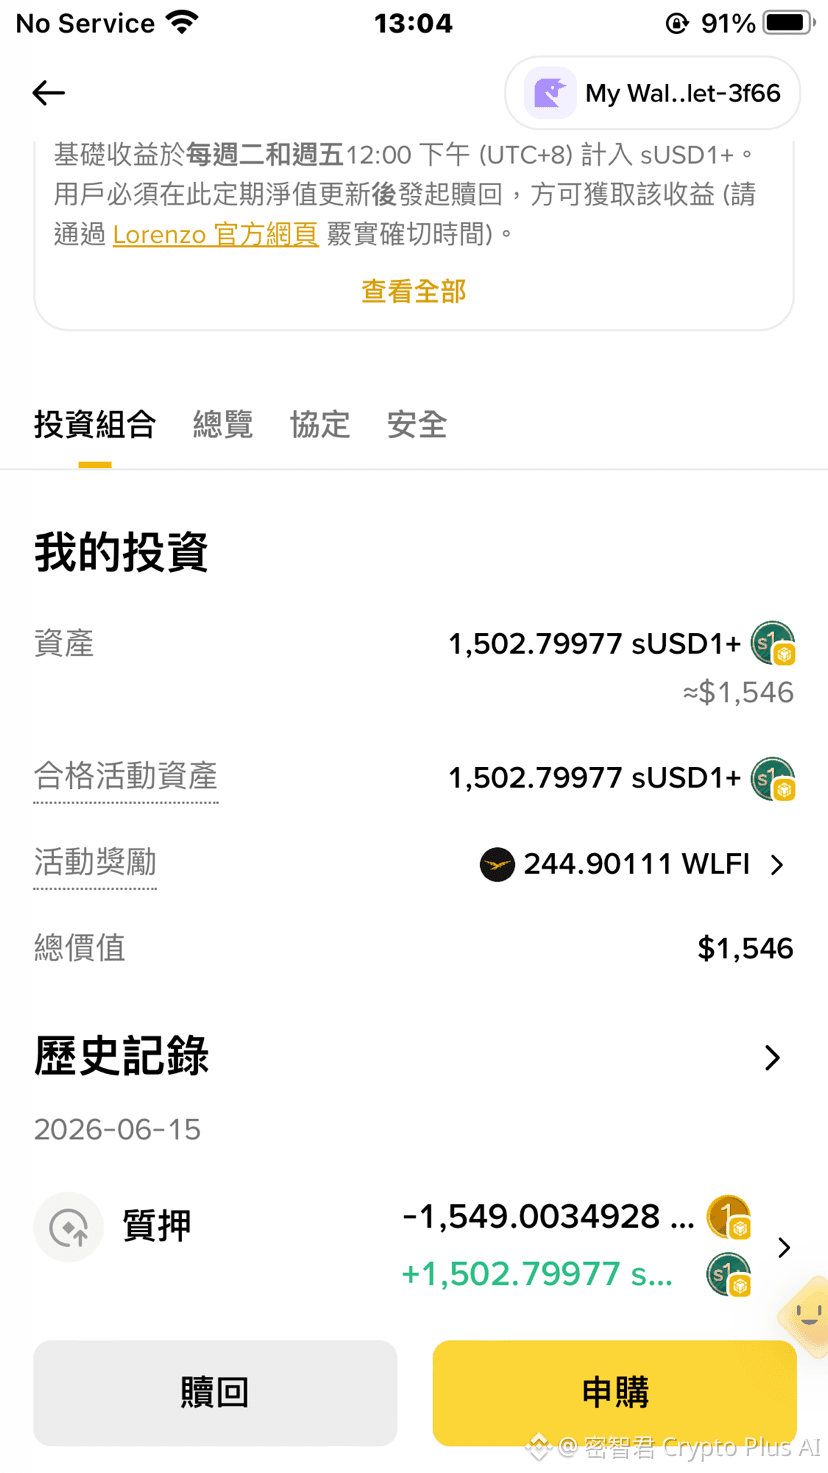
It’s really not easy! I staked $1500, and after a month of the $USD1 airdrop, it was only $14. Today I can treat myself to an extra chicken leg. Does anyone have more than me? #wefi
August 19, 2026|So terrible—AI stocks are all down across the board, and BTC is still holding around 64,000.
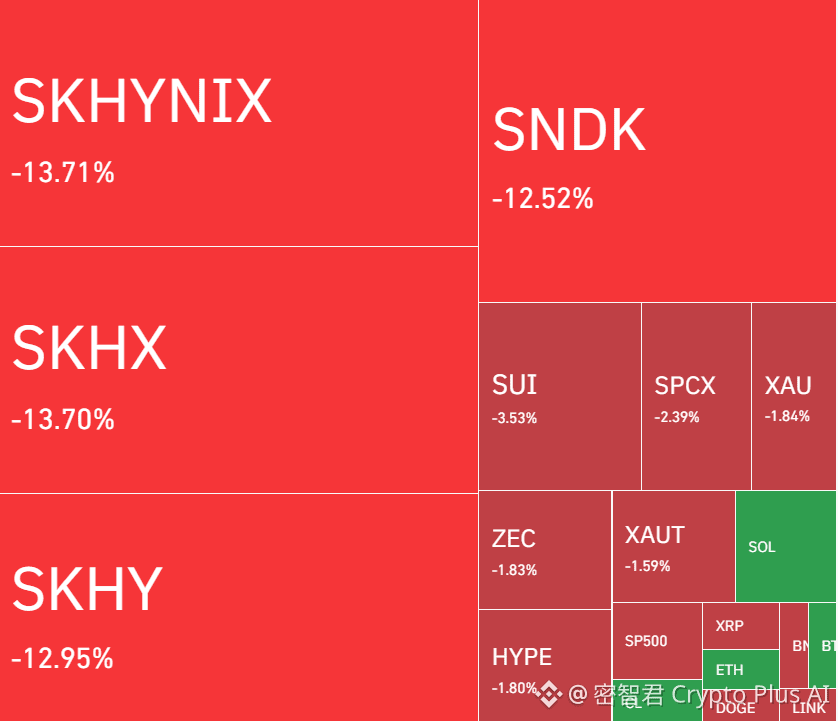
The most obvious change in last night’s market was that capital started to simultaneously dislike both “expensive” and “slow.” The Nasdaq fell 1.33%, the S&P 500 dropped 0.69%, <$SKHY > Hynix plunged about 13.7%, <SNDK> slid 12.52%, Micron crashed 7%, Nvidia fell 2.3%, and Broadcom dropped 3.2%. The 30-year U.S. Treasury yield once surged to 5.34%. Folks, how are your U.S. stock positions doing?
The situation in the Middle East pushed Brent crude up to $91.02 again. Oil price gains can raise inflation expectations, and Treasury yields are not likely to drop quickly, creating double pressure on overvalued tech stocks. South Korea’s KOSPI also fell 1.5%; the memory stocks that surged earlier are now even more sensitive to interest rates and profit-taking.
Crypto, on the other hand, is comparatively resilient. As of this morning, <$BTC > is around $64,580, up 0.3% over 24 hours; <$ETH > is about $1,915, up slightly. This still can’t be called an independent bull market—it’s more like during a tech-stock selloff, Crypto has not yet shown synchronized de-risking.
Today I’m watching two levels: whether BTC can build volume and hold above $65,000, and whether ETH can stay above $1,900. If oil prices keep pressing higher and long-bond yields remain around 5.3%, rebounds are still likely to be sold into. But if BTC can reclaim $65,000 in this environment, then resilience could turn into strength.
AI stocks are down, but coins aren’t falling in tandem—on this trade, would you rather pick up tech stocks, or keep holding BTC? <#美国存储股延续涨势闪迪涨10.5% >
The most obvious change in last night’s market was that capital started to simultaneously dislike both “expensive” and “slow.” The Nasdaq fell 1.33%, the S&P 500 dropped 0.69%, <$SKHY > Hynix plunged about 13.7%, <SNDK> slid 12.52%, Micron crashed 7%, Nvidia fell 2.3%, and Broadcom dropped 3.2%. The 30-year U.S. Treasury yield once surged to 5.34%. Folks, how are your U.S. stock positions doing?
The situation in the Middle East pushed Brent crude up to $91.02 again. Oil price gains can raise inflation expectations, and Treasury yields are not likely to drop quickly, creating double pressure on overvalued tech stocks. South Korea’s KOSPI also fell 1.5%; the memory stocks that surged earlier are now even more sensitive to interest rates and profit-taking.
Crypto, on the other hand, is comparatively resilient. As of this morning, <$BTC > is around $64,580, up 0.3% over 24 hours; <$ETH > is about $1,915, up slightly. This still can’t be called an independent bull market—it’s more like during a tech-stock selloff, Crypto has not yet shown synchronized de-risking.
Today I’m watching two levels: whether BTC can build volume and hold above $65,000, and whether ETH can stay above $1,900. If oil prices keep pressing higher and long-bond yields remain around 5.3%, rebounds are still likely to be sold into. But if BTC can reclaim $65,000 in this environment, then resilience could turn into strength.
AI stocks are down, but coins aren’t falling in tandem—on this trade, would you rather pick up tech stocks, or keep holding BTC? <#美国存储股延续涨势闪迪涨10.5% >
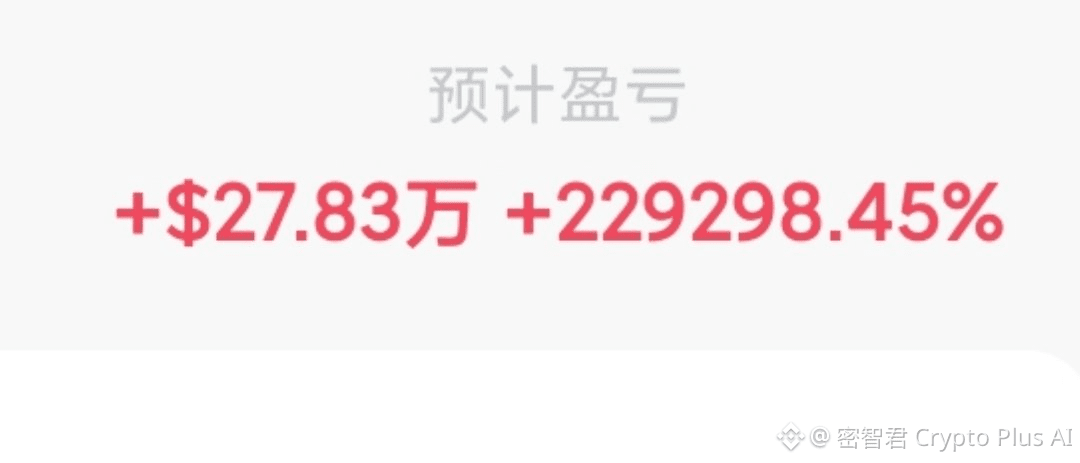
If in 2013, you used 1 million USD to buy both Bitcoin and gold at the same time, how different would the results be today? I’ll tell you—it could be a difference of 100,000 times.
Gold is a traditional safe-haven asset. It relies on scarcity, historical consensus, and global liquidity.
Bitcoin, on the other hand, is a scarce asset of the digital era. It relies on fixed supply, network consensus, and a growth curve driven by higher volatility.
Both are often called "inflation-hedging assets," but over longer time horizons, the difference in returns actually reflects how much premium the market is willing to pay for a new consensus.
Of course, the volatility of $BTC is also far higher than that of $XAU for gold. Any bear market in between could make people question everything—being able to hold on is the biggest investment. What do you think? #黄金
Gold is a traditional safe-haven asset. It relies on scarcity, historical consensus, and global liquidity.
Bitcoin, on the other hand, is a scarce asset of the digital era. It relies on fixed supply, network consensus, and a growth curve driven by higher volatility.
Both are often called "inflation-hedging assets," but over longer time horizons, the difference in returns actually reflects how much premium the market is willing to pay for a new consensus.
Of course, the volatility of $BTC is also far higher than that of $XAU for gold. Any bear market in between could make people question everything—being able to hold on is the biggest investment. What do you think? #黄金
Damn! Trump demands South Korea pay $10 billion in compensation. The reason is that the U.S. has long protected South Korea and provided military technology. Looks like Wall Street hasn’t made enough money on South Korean stocks yet. Do you think South Korean stocks will keep falling next? $SKHY #川普
“Bull Comes” token surges more than 2,700x—I can almost smell the vibe of a bull market!
The worst-quality animated film in history originally had dismal box office results, but thanks to the rough visuals and the internet-famous “mother and son hand-rub it for five years,” it unexpectedly went viral in reverse; user-created remixes spread rapidly. “Bull Comes” also naturally corresponds to “the bull market is here,” making it especially suitable for the Chinese Crypto community to wrap as a Meme. The token kicked off with a market cap of around $10,000; with just a few hundred thousand dollars, traders can push the bid up dozens or even over a hundred times. Then platforms like HTX went live, turning off-platform attention into FOMO chasing bids—at its peak, the market cap even approached $47 million.
Do you think “Bull Comes” can become the leading Chinese Meme, or once the listing hype fades, will it start getting overtaken by the next runner?
The worst-quality animated film in history originally had dismal box office results, but thanks to the rough visuals and the internet-famous “mother and son hand-rub it for five years,” it unexpectedly went viral in reverse; user-created remixes spread rapidly. “Bull Comes” also naturally corresponds to “the bull market is here,” making it especially suitable for the Chinese Crypto community to wrap as a Meme. The token kicked off with a market cap of around $10,000; with just a few hundred thousand dollars, traders can push the bid up dozens or even over a hundred times. Then platforms like HTX went live, turning off-platform attention into FOMO chasing bids—at its peak, the market cap even approached $47 million.
Do you think “Bull Comes” can become the leading Chinese Meme, or once the listing hype fades, will it start getting overtaken by the next runner?

August 18, 2026|Oil prices surge above $91, and BTC is still clinging around $64,000!
This morning, I didn’t look at the crypto price first—I checked crude oil and U.S. Treasuries. Brent crude rose to $91.06, and the yield on the 30-year U.S. Treasury jumped to 5.31%, the highest since 2007. Rising oil prices lift inflation expectations, and long-end yields raise funding costs; this combination isn’t easy for either tech stocks or Crypto.
Overnight, the S&P 500 fell 0.5% and the Nasdaq dropped 0.3%. In Asia, though, things were mixed: the KOSPI rebounded more than 3%, while the Nikkei slipped 0.3%. This looks more like capital searching for oversold opportunities rather than a broad return of risk appetite.
$BTC is currently around $64,150, and $ETH is about $1,910—both gains are not large. Yet in a backdrop where oil prices and interest rates are rising at the same time, prices are still holding, suggesting selling pressure hasn’t expanded further for now. However, until BTC recaptures $65,000 with strong volume, I’ll treat it only as “resilience,” not as a confirmed reversal. If it breaks back below $62,500 again, the sideways structure may still loosen to the downside. As for ETH, it needs to first hold above $1,900 to have a chance to sustain relative strength.
Risk warning: The U.S.-Iran situation, oil prices, and long-term Treasury yields may still amplify short-term volatility.
In today’s tape, will you treat BTC’s stubbornness as a bullish signal, or keep waiting for $65,000 confirmation?#比特币徘徊63500美元 #以色列空袭黎巴嫩击毙真主党指挥官
This morning, I didn’t look at the crypto price first—I checked crude oil and U.S. Treasuries. Brent crude rose to $91.06, and the yield on the 30-year U.S. Treasury jumped to 5.31%, the highest since 2007. Rising oil prices lift inflation expectations, and long-end yields raise funding costs; this combination isn’t easy for either tech stocks or Crypto.
Overnight, the S&P 500 fell 0.5% and the Nasdaq dropped 0.3%. In Asia, though, things were mixed: the KOSPI rebounded more than 3%, while the Nikkei slipped 0.3%. This looks more like capital searching for oversold opportunities rather than a broad return of risk appetite.
$BTC is currently around $64,150, and $ETH is about $1,910—both gains are not large. Yet in a backdrop where oil prices and interest rates are rising at the same time, prices are still holding, suggesting selling pressure hasn’t expanded further for now. However, until BTC recaptures $65,000 with strong volume, I’ll treat it only as “resilience,” not as a confirmed reversal. If it breaks back below $62,500 again, the sideways structure may still loosen to the downside. As for ETH, it needs to first hold above $1,900 to have a chance to sustain relative strength.
Risk warning: The U.S.-Iran situation, oil prices, and long-term Treasury yields may still amplify short-term volatility.
In today’s tape, will you treat BTC’s stubbornness as a bullish signal, or keep waiting for $65,000 confirmation?#比特币徘徊63500美元 #以色列空袭黎巴嫩击毙真主党指挥官
Log in to explore more content