
VantaChain
5 Paylaşımlar

VantaChain
Şikayət et
İstifadəçini blokla
Decoding market trends, tracking smart money & identifying opportunities. Technical analysis | Market psychology | Risk management. Research over hype. Always
1 İzlənilir
0 İzləyicilər
0 Bəyəndi
Postlar
·
--
Tərcüməyə bax
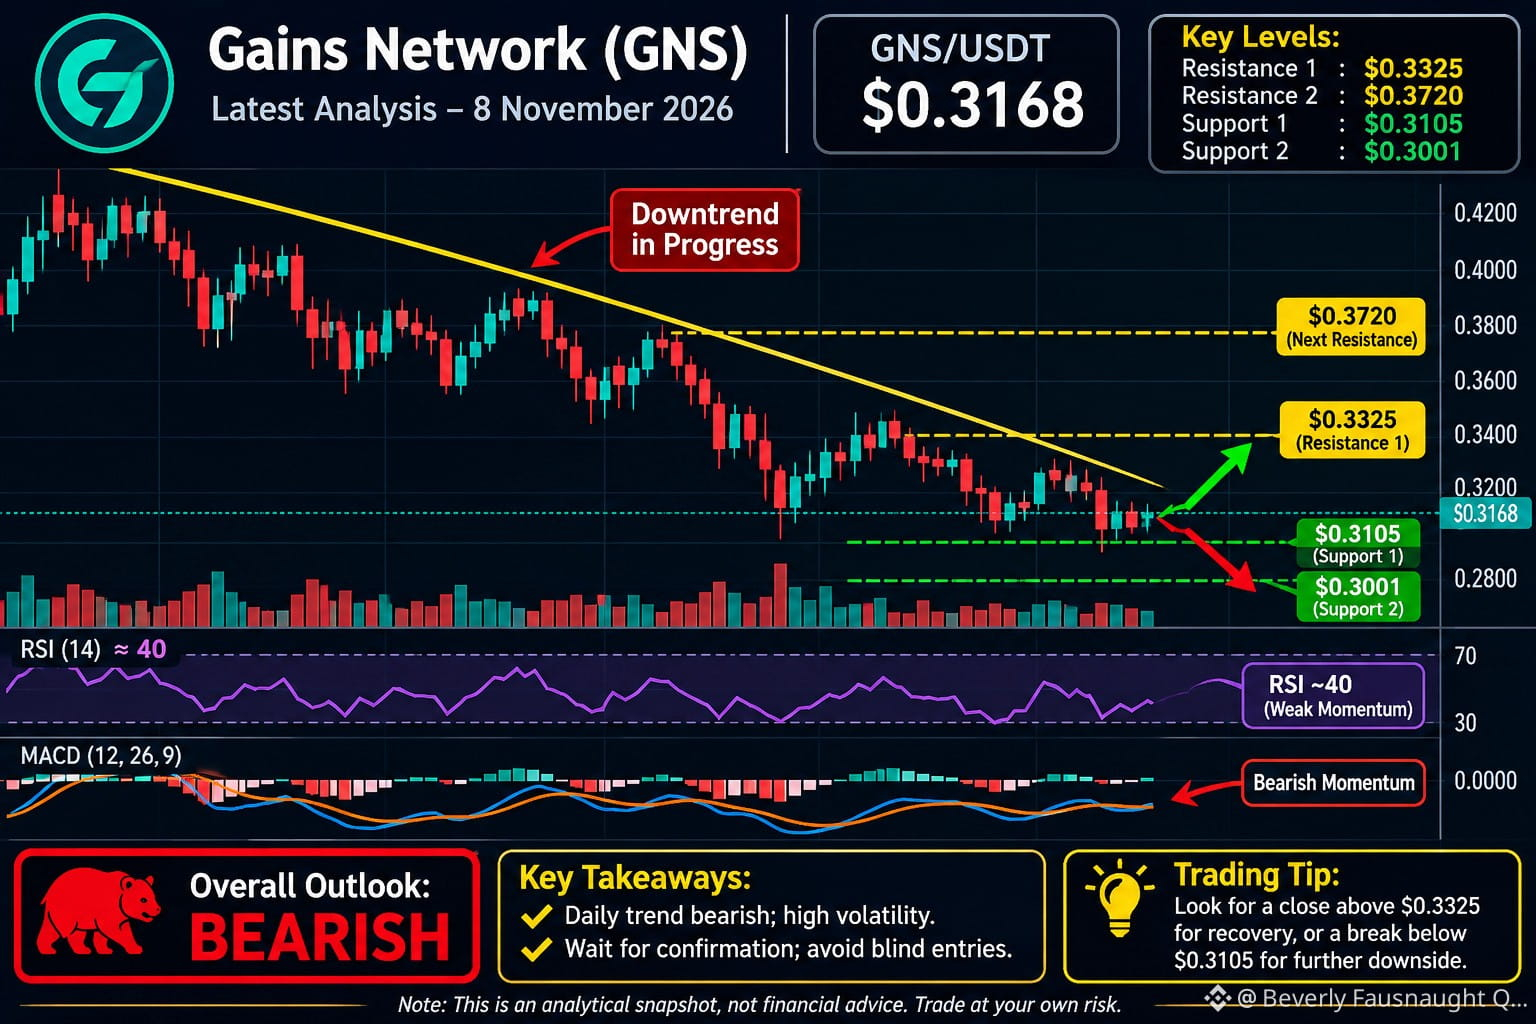
$GNS Technical overview:
RSI: approximately 40 – weak momentum.
Daily trend: Bearish.
Moving averages: Bearish alignment.
Volatility: High.
Important price levels:
Level
Price
Support 1
$0.3105
Support 2
$0.3001
Resistance 1
$0.3325
Resistance 2
$0.3720
Sources:
Live Price, Market Cap & Chart+2
Analytical chart – GNS/USDT
Trading insight: A close above $0.3325 may signal recovery. A breakdown below $0.3105 could expose $0.3001.#BinanceReopensWithdrawalsForHYPE&APT #SouthKoreaDraftLawTargets15To20%ShareholderCap #KeplrAdvisesSocialLoginUsersToTransferAssets
{spot}(GNSUSDT)
$GNS Technical overview:
RSI: approximately 40 – weak momentum.
Daily trend: Bearish.
Moving averages: Bearish alignment.
Volatility: High.
Important price levels:
Level
Price
Support 1
$0.3105
Support 2
$0.3001
Resistance 1
$0.3325
Resistance 2
$0.3720
Sources:
Live Price, Market Cap & Chart+2
Analytical chart – GNS/USDT
Trading insight: A close above $0.3325 may signal recovery. A breakdown below $0.3105 could expose $0.3001.#BinanceReopensWithdrawalsForHYPE&APT #SouthKoreaDraftLawTargets15To20%ShareholderCap #KeplrAdvisesSocialLoginUsersToTransferAssets
RSI: approximately 40 – weak momentum.
Daily trend: Bearish.
Moving averages: Bearish alignment.
Volatility: High.
Important price levels:
Level
Price
Support 1
$0.3105
Support 2
$0.3001
Resistance 1
$0.3325
Resistance 2
$0.3720
Sources:
Live Price, Market Cap & Chart+2
Analytical chart – GNS/USDT
Trading insight: A close above $0.3325 may signal recovery. A breakdown below $0.3105 could expose $0.3001.#BinanceReopensWithdrawalsForHYPE&APT #SouthKoreaDraftLawTargets15To20%ShareholderCap #KeplrAdvisesSocialLoginUsersToTransferAssets
32
·
--
Tərcüməyə bax
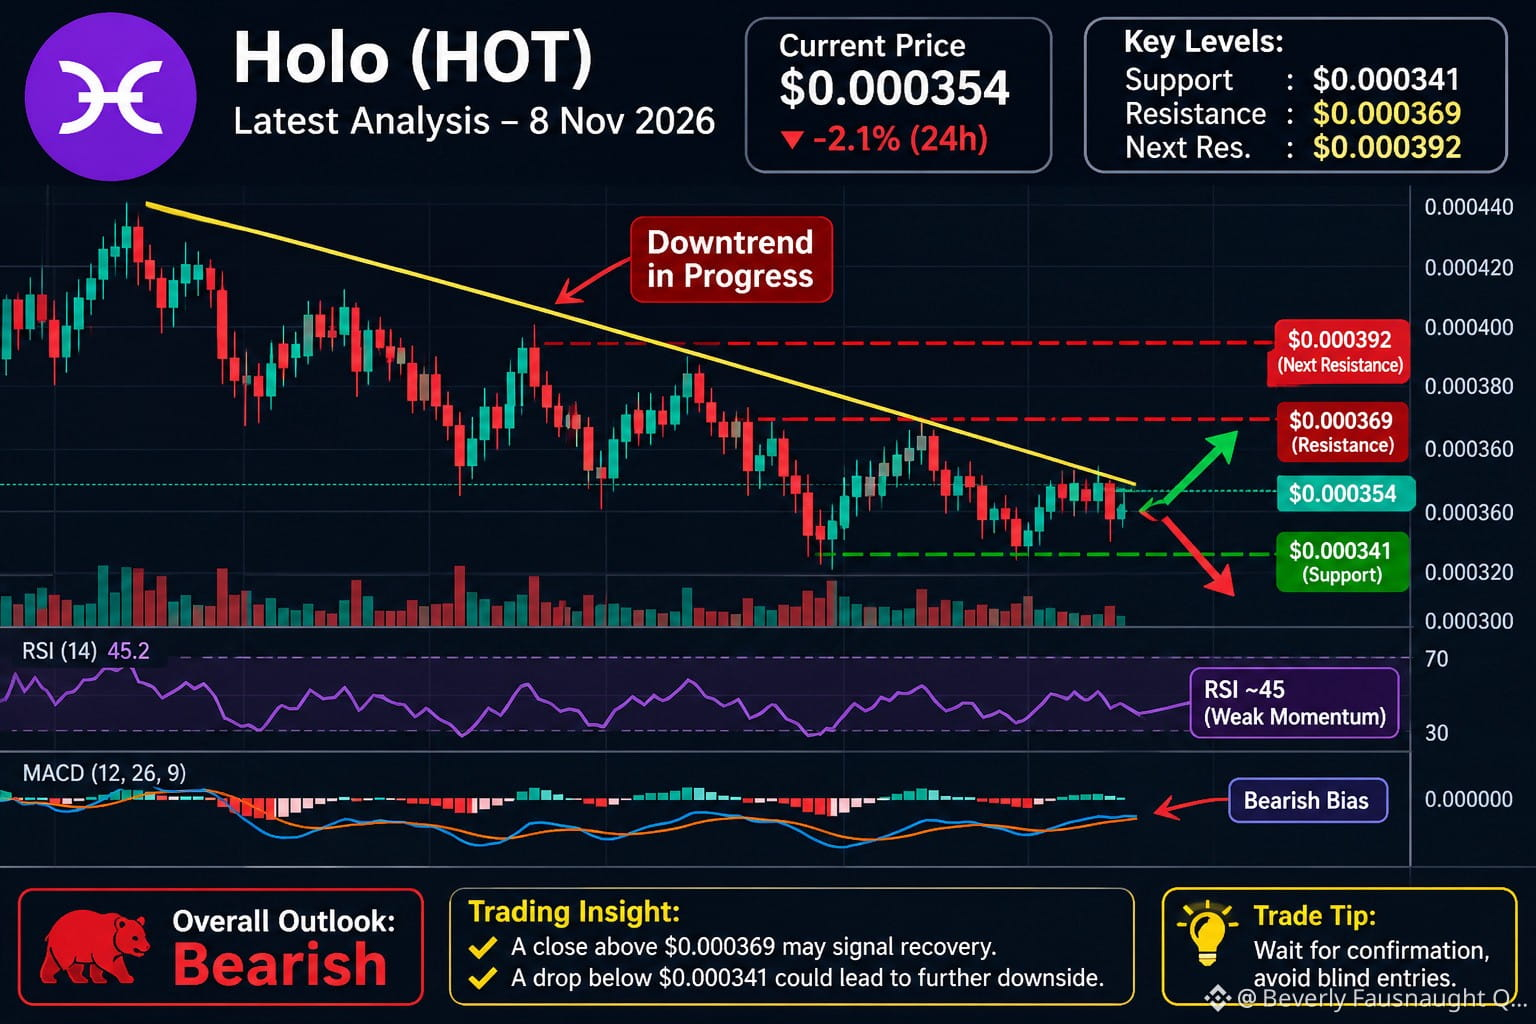
Market analysis; $HOT is showing a bearish trend on the daily chart. RSI is around 45, indicating weak momentum. Buyers need to defend support before a stronger recovery can develop.
CoinMarketCap+2
Key price levels
HOT/USDT approximate technical levels in USD.
$0$0.00015$0.0003$0.00045SupportCurrentResistanceNext resistance
Support: $0.000341
Resistance: $0.000369
Next resistance: $0.000392
Overall outlook: Bearish
Trading view: A daily close above $0.000369 could indicate recovery. A breakdown below $0.000341 may lead to further downside
#BinanceReopensWithdrawalsForHYPE&APT #SouthKoreaDraftLawTargets15To20%ShareholderCap #TradFiForBeginners
{spot}(HOTUSDT)
Market analysis; $HOT is showing a bearish trend on the daily chart. RSI is around 45, indicating weak momentum. Buyers need to defend support before a stronger recovery can develop.
CoinMarketCap+2
Key price levels
HOT/USDT approximate technical levels in USD.
$0$0.00015$0.0003$0.00045SupportCurrentResistanceNext resistance
Support: $0.000341
Resistance: $0.000369
Next resistance: $0.000392
Overall outlook: Bearish
Trading view: A daily close above $0.000369 could indicate recovery. A breakdown below $0.000341 may lead to further downside
#BinanceReopensWithdrawalsForHYPE&APT #SouthKoreaDraftLawTargets15To20%ShareholderCap #TradFiForBeginners
CoinMarketCap+2
Key price levels
HOT/USDT approximate technical levels in USD.
$0$0.00015$0.0003$0.00045SupportCurrentResistanceNext resistance
Support: $0.000341
Resistance: $0.000369
Next resistance: $0.000392
Overall outlook: Bearish
Trading view: A daily close above $0.000369 could indicate recovery. A breakdown below $0.000341 may lead to further downside
#BinanceReopensWithdrawalsForHYPE&APT #SouthKoreaDraftLawTargets15To20%ShareholderCap #TradFiForBeginners
144
·
--
Tərcüməyə bax
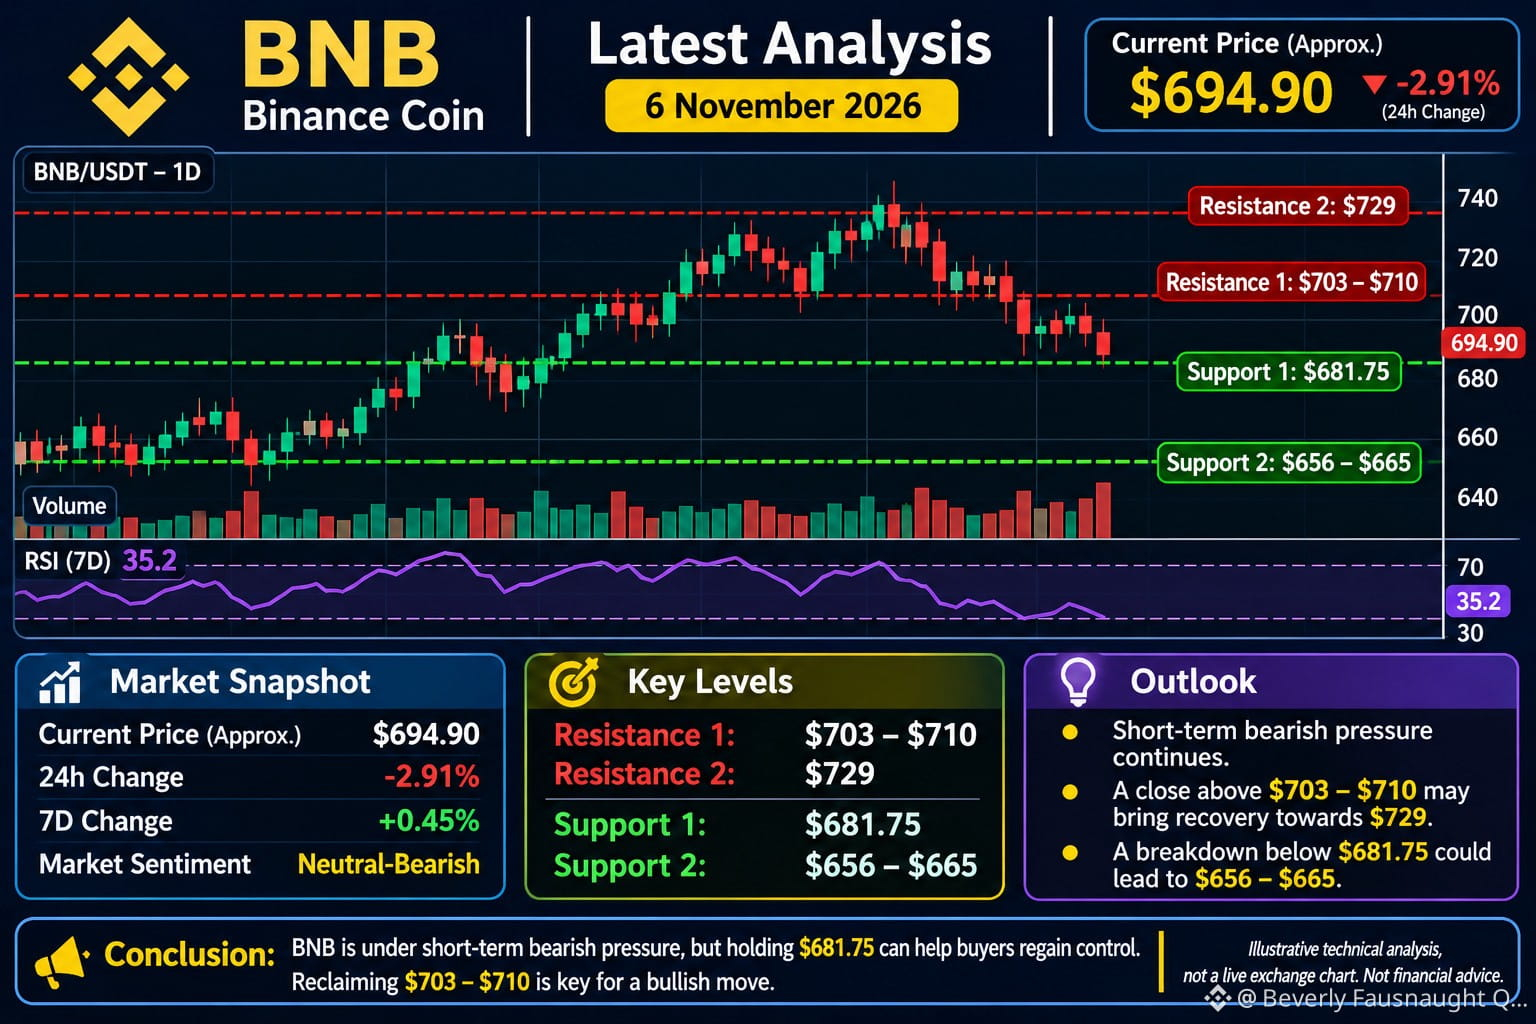
$BNB is facing selling pressure due to the broader crypto-market decline. Its short-term trend remains weak, although the RSI suggests the market is approaching oversold territory.
CoinMarketCap+1
Key technical levels
Support 1: $681.75
Support 2: $656–$665
Resistance 1: $703–$710
Resistance 2: $729
RSI: 35.2 – Weak / near oversold.
Trading outlook
Bullish scenario: If BNB reclaims $710, it could move towards $729.
Bearish scenario: If $681.75 breaks, downside towards $656–$665 becomes possible.
Conclusion: BNB is currently under bearish pressure. Watch the $681.75 support carefully. A recovery above $710 would improve the short-term outlook.
#BinanceReopensWithdrawalsForMoreAssets #ECBTargetsDigitalEuroIssuanceIn2029 #SouthKoreaDelaysCryptoTaxationUntil2029
{spot}(BNBUSDT)
$BNB is facing selling pressure due to the broader crypto-market decline. Its short-term trend remains weak, although the RSI suggests the market is approaching oversold territory.
CoinMarketCap+1
Key technical levels
Support 1: $681.75
Support 2: $656–$665
Resistance 1: $703–$710
Resistance 2: $729
RSI: 35.2 – Weak / near oversold.
Trading outlook
Bullish scenario: If BNB reclaims $710, it could move towards $729.
Bearish scenario: If $681.75 breaks, downside towards $656–$665 becomes possible.
Conclusion: BNB is currently under bearish pressure. Watch the $681.75 support carefully. A recovery above $710 would improve the short-term outlook.
#BinanceReopensWithdrawalsForMoreAssets #ECBTargetsDigitalEuroIssuanceIn2029 #SouthKoreaDelaysCryptoTaxationUntil2029
CoinMarketCap+1
Key technical levels
Support 1: $681.75
Support 2: $656–$665
Resistance 1: $703–$710
Resistance 2: $729
RSI: 35.2 – Weak / near oversold.
Trading outlook
Bullish scenario: If BNB reclaims $710, it could move towards $729.
Bearish scenario: If $681.75 breaks, downside towards $656–$665 becomes possible.
Conclusion: BNB is currently under bearish pressure. Watch the $681.75 support carefully. A recovery above $710 would improve the short-term outlook.
#BinanceReopensWithdrawalsForMoreAssets #ECBTargetsDigitalEuroIssuanceIn2029 #SouthKoreaDelaysCryptoTaxationUntil2029
70
·
--
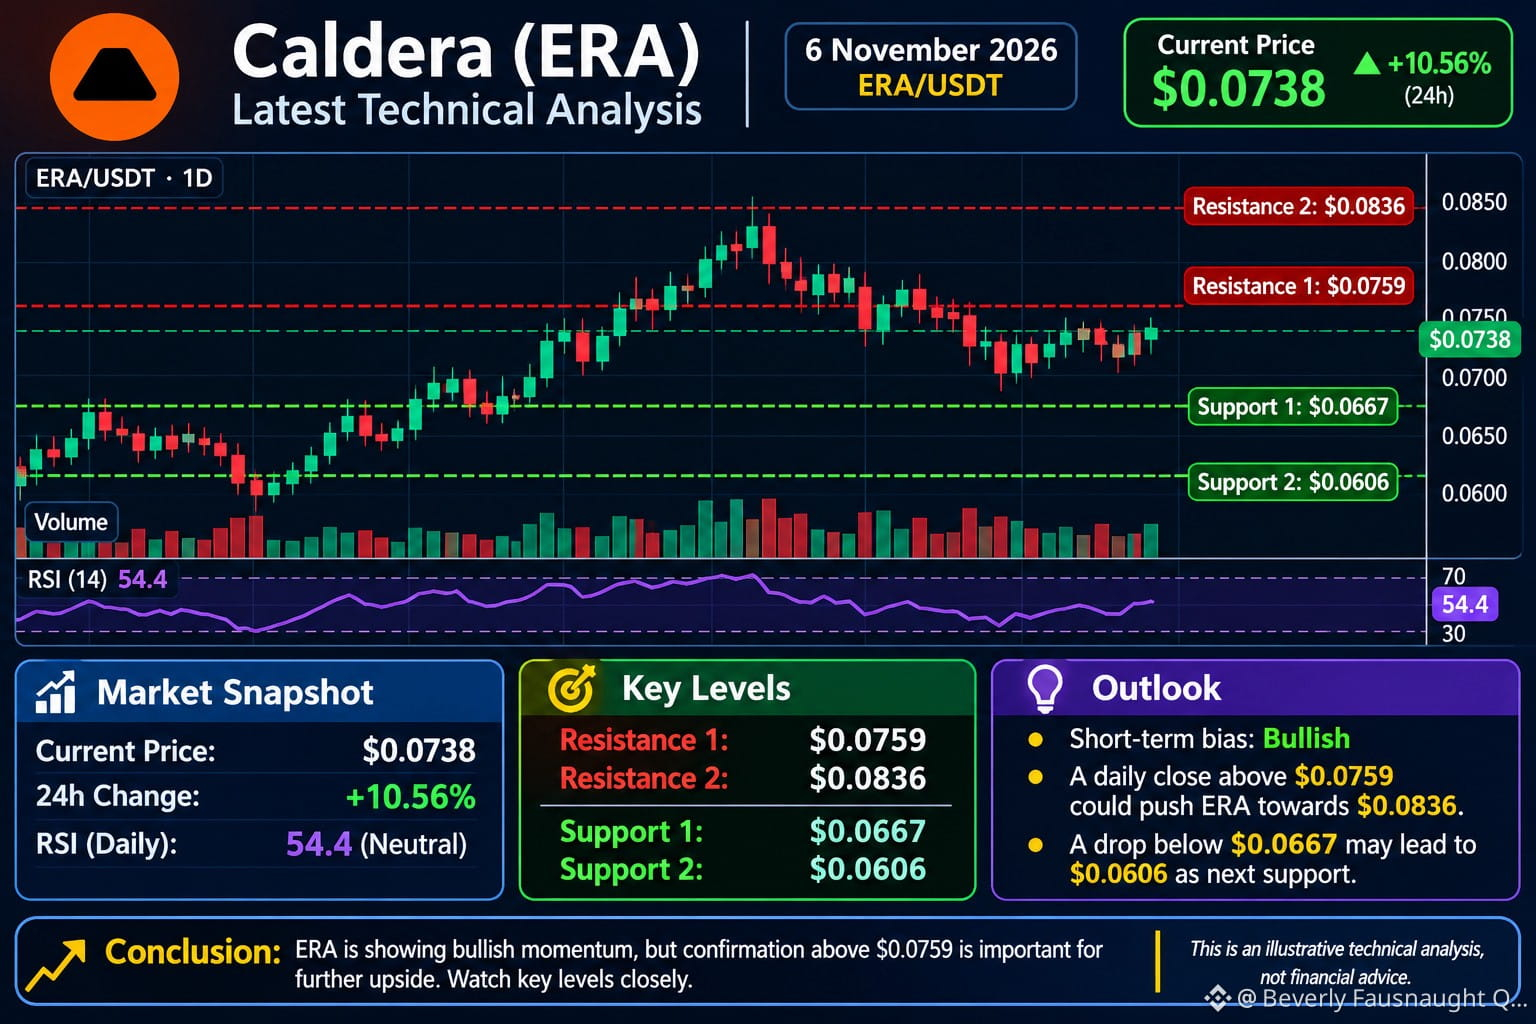
$ERA Cari qiymət: təxminən $0.0738 (24 saat ərzində +10.56%).
CoinMarketCap+1
Texniki təhlil
Dəstək 1: $0.0667
Dəstək 2: $0.0606
Müqavimət 1: $0.0759
Müqavimət 2: $0.0836
RSI: 54.4 – Neytral.
Trend: Gündəlik yüksəliş meyillidir, lakin qısamüddətli volatillik yüksək olaraq qalır.
Nəticə: ERA müsbət impuls nümayiş etdirir. Gündəlik bağlanışın $0.0759-dan yuxarı olması $0.0836 səviyyəsinə doğru yol aça bilər. Lakin $0.0667 səviyyəsinin itirilməsi yüksəliş ssenarisini zəiflədər
#BinanceReopensWithdrawalsForMoreAssets #$2TWipedOutHedgeFundsFaceLiquidation #SouthKoreaDelaysCryptoTaxationUntil2029
{spot}(ERAUSDT)
$ERA Cari qiymət: təxminən $0.0738 (24 saat ərzində +10.56%).
CoinMarketCap+1
Texniki təhlil
Dəstək 1: $0.0667
Dəstək 2: $0.0606
Müqavimət 1: $0.0759
Müqavimət 2: $0.0836
RSI: 54.4 – Neytral.
Trend: Gündəlik yüksəliş meyillidir, lakin qısamüddətli volatillik yüksək olaraq qalır.
Nəticə: ERA müsbət impuls nümayiş etdirir. Gündəlik bağlanışın $0.0759-dan yuxarı olması $0.0836 səviyyəsinə doğru yol aça bilər. Lakin $0.0667 səviyyəsinin itirilməsi yüksəliş ssenarisini zəiflədər
#BinanceReopensWithdrawalsForMoreAssets #$2TWipedOutHedgeFundsFaceLiquidation #SouthKoreaDelaysCryptoTaxationUntil2029
CoinMarketCap+1
Texniki təhlil
Dəstək 1: $0.0667
Dəstək 2: $0.0606
Müqavimət 1: $0.0759
Müqavimət 2: $0.0836
RSI: 54.4 – Neytral.
Trend: Gündəlik yüksəliş meyillidir, lakin qısamüddətli volatillik yüksək olaraq qalır.
Nəticə: ERA müsbət impuls nümayiş etdirir. Gündəlik bağlanışın $0.0759-dan yuxarı olması $0.0836 səviyyəsinə doğru yol aça bilər. Lakin $0.0667 səviyyəsinin itirilməsi yüksəliş ssenarisini zəiflədər
#BinanceReopensWithdrawalsForMoreAssets #$2TWipedOutHedgeFundsFaceLiquidation #SouthKoreaDelaysCryptoTaxationUntil2029
161
·
--
Tərcüməyə bax
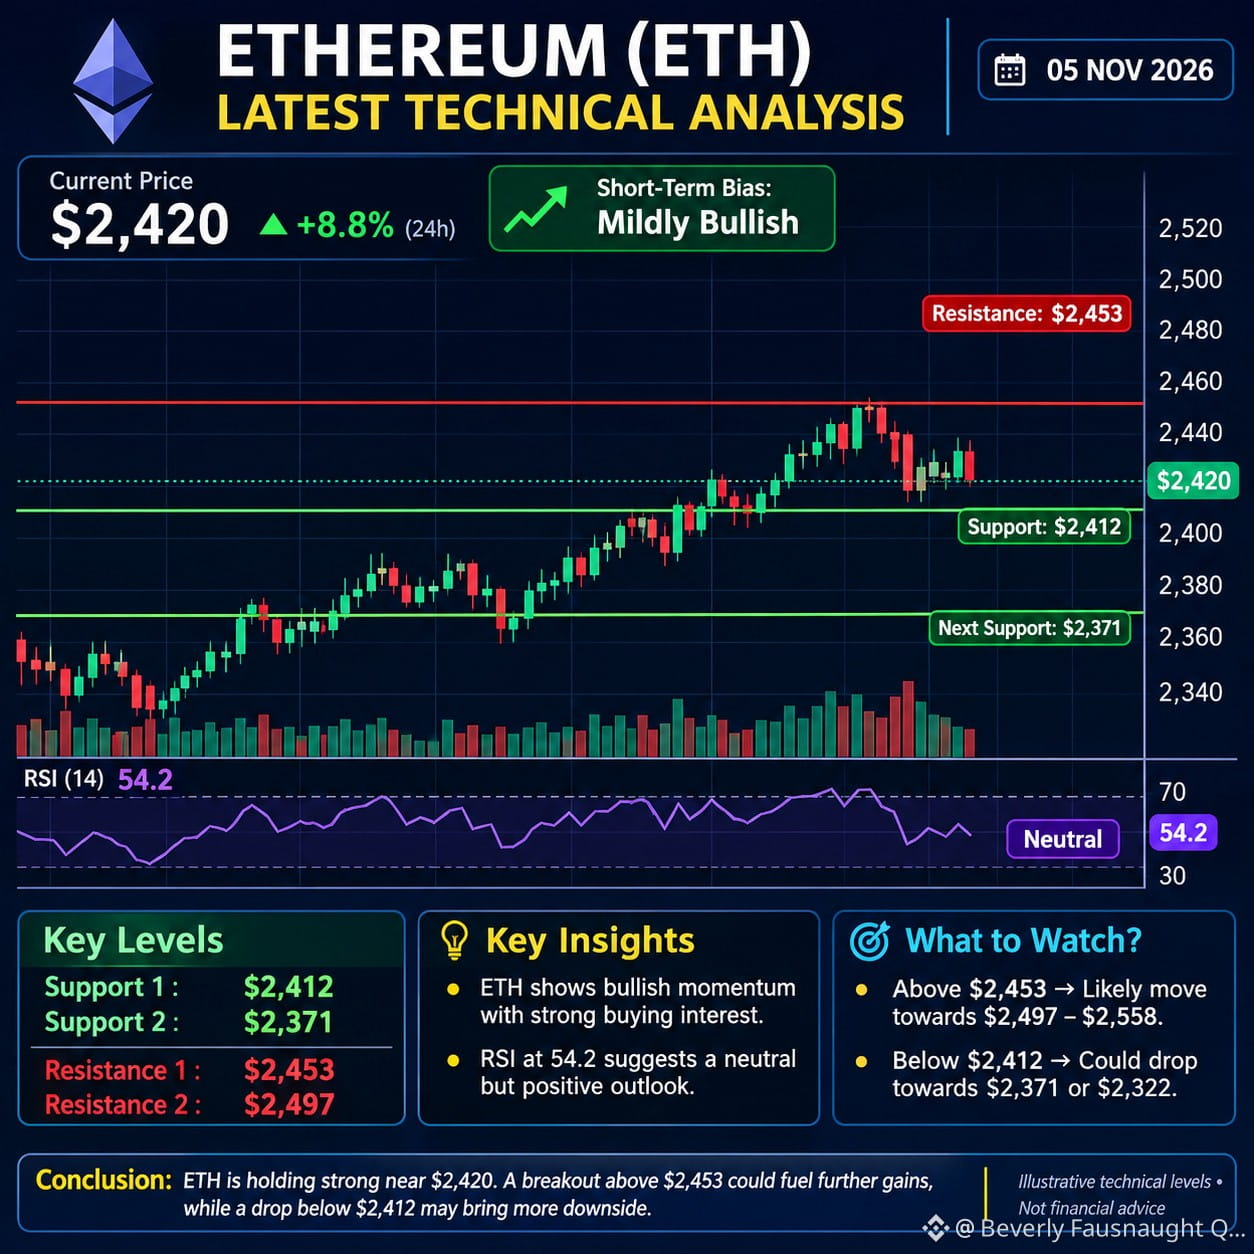
Technical Analysis $ETH
Trend: Short-term bullish momentum.
Support: $2,412, then $2,371.
Resistance: $2,453, then $2,497.
RSI: 54.2 (daily), indicating room for further movement.
Market sentiment: Buyers currently have the advantage, but volatility is high.
Short-term prediction
Bullish scenario: A breakout above $2,453 could push ETH towards $2,497–$2,558.
Bearish scenario: A fall below $2,412 could bring prices towards $2,371 or $2,322.
Conclusion: ETH currently shows bullish momentum, supported by increased trading volume and a broader crypto-market recovery. However, confirmation above $2,453 is important before expecting
{spot}(ETHUSDT)
further upside.
#BinanceReopensWithdrawalsForMoreAssets #BTCRebounds80K #Binance98PercentReplenished
Technical Analysis $ETH
Trend: Short-term bullish momentum.
Support: $2,412, then $2,371.
Resistance: $2,453, then $2,497.
RSI: 54.2 (daily), indicating room for further movement.
Market sentiment: Buyers currently have the advantage, but volatility is high.
Short-term prediction
Bullish scenario: A breakout above $2,453 could push ETH towards $2,497–$2,558.
Bearish scenario: A fall below $2,412 could bring prices towards $2,371 or $2,322.
Conclusion: ETH currently shows bullish momentum, supported by increased trading volume and a broader crypto-market recovery. However, confirmation above $2,453 is important before expecting
further upside.
#BinanceReopensWithdrawalsForMoreAssets #BTCRebounds80K #Binance98PercentReplenished
Trend: Short-term bullish momentum.
Support: $2,412, then $2,371.
Resistance: $2,453, then $2,497.
RSI: 54.2 (daily), indicating room for further movement.
Market sentiment: Buyers currently have the advantage, but volatility is high.
Short-term prediction
Bullish scenario: A breakout above $2,453 could push ETH towards $2,497–$2,558.
Bearish scenario: A fall below $2,412 could bring prices towards $2,371 or $2,322.
Conclusion: ETH currently shows bullish momentum, supported by increased trading volume and a broader crypto-market recovery. However, confirmation above $2,453 is important before expecting
further upside.
#BinanceReopensWithdrawalsForMoreAssets #BTCRebounds80K #Binance98PercentReplenished
73
Daha çox kontent araşdırmaq üçün daxil olun
Binance Square-də qlobal kriptovalyuta istifadəçilərinə qoşulun
⚡️ Kriptovalyuta haqqında ən son və faydalı məlumatları əldə edin.
💬 Dünyanın ən böyük kriptovalyuta birjası tərəfindən etibar edilir.
👍 Doğrulanmış yaradıcılardan gələn real məlumatları kəşf edin.
E-poçt/Telefon nömrəsi
Trenddə olan mövzular
BinanceReopensWithdrawalsForHYPE&APT
70,914 baxış
Müzakirə edir: 887
Binance HYPE və APT üçün vəsait çıxarışlarını yenidən aktivləşdirir, bərpa olunan aktivlərin siyahısını genişləndirir
Binance News
·32 bəyənmə
·22.9k baxış
SouthKoreaDraftLawTargets15To20%ShareholderCap
71,643 baxış
Müzakirə edir: 581
TradFiForBeginners
171,745 baxış
Müzakirə edir: 1,773