
Mr_Trader5246
56 Paylaşımlar

Mr_Trader5246
Şikayət et
İstifadəçini blokla
Old account with 2K followers got suspended. Starting fresh here. Thanks for your support! 🙏
Açıq ticarət
Təsadüfi treyder
5.1 ay
5 İzlənilir
12 İzləyicilər
93 Bəyəndi
Postlar
Portfel
Hamısı
Sitatlar
Videolar
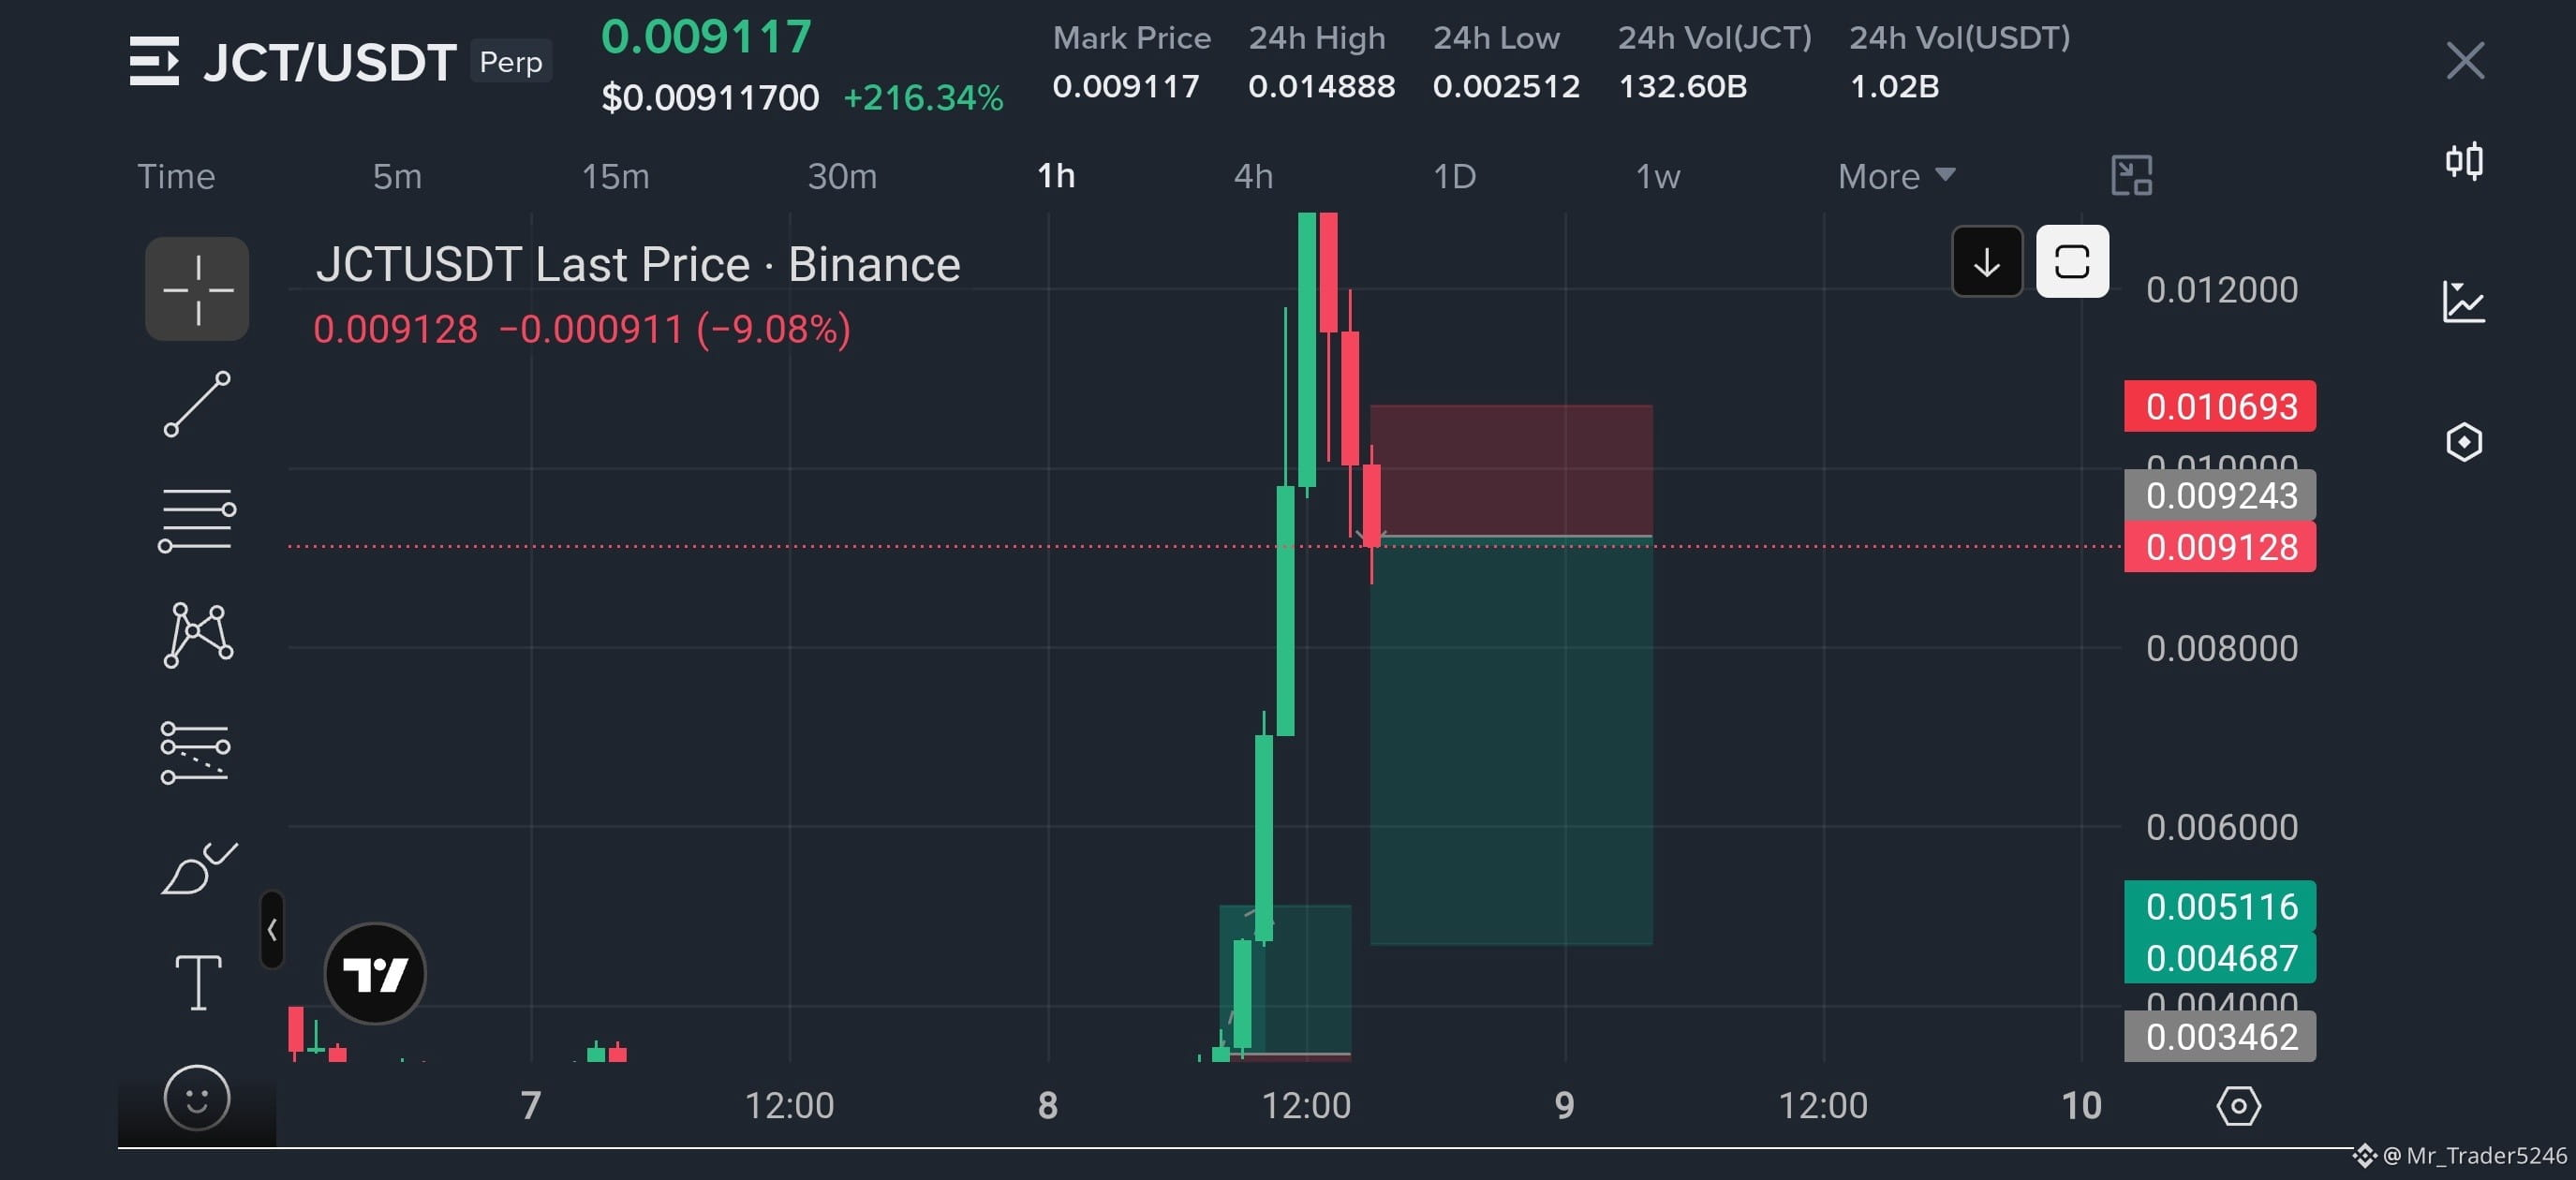
$JCT USDT – Enmə ssenarisi 🔴
JCT 24 saat ərzində 216%-dən çox bahalaşıb. Bu kəskin yüksəlişdən sonra satıcılar nəzarəti ələ almağa başlayır və qiymət geri çəkilmə əlamətləri göstərir.
Potensial SHORT ssenarisi
* Giriş zonası: 0.00920 – 0.00950
* TP1: 0.00850
* TP2: 0.00750
* TP3: 0.00650
* TP4: 0.00550
* TP5: 0.00470
* Stop Loss: 0.01070
$JCT USDT – Enmə ssenarisi 🔴
JCT 24 saat ərzində 216%-dən çox bahalaşıb. Bu kəskin yüksəlişdən sonra satıcılar nəzarəti ələ almağa başlayır və qiymət geri çəkilmə əlamətləri göstərir.
Potensial SHORT ssenarisi
* Giriş zonası: 0.00920 – 0.00950
* TP1: 0.00850
* TP2: 0.00750
* TP3: 0.00650
* TP4: 0.00550
* TP5: 0.00470
* Stop Loss: 0.01070
JCT 24 saat ərzində 216%-dən çox bahalaşıb. Bu kəskin yüksəlişdən sonra satıcılar nəzarəti ələ almağa başlayır və qiymət geri çəkilmə əlamətləri göstərir.
Potensial SHORT ssenarisi
* Giriş zonası: 0.00920 – 0.00950
* TP1: 0.00850
* TP2: 0.00750
* TP3: 0.00650
* TP4: 0.00550
* TP5: 0.00470
* Stop Loss: 0.01070
2
489
·
--
Azalma
$JCT USDT – Enış yönlü ssenari 🔴
JCT 24 saat ərzində 216%-dən çox bahalaşıb. Bu kəskin yüksəlişdən sonra satıcılar nəzarəti ələ almağa başlayır və qiymət geri çəkilmə əlamətləri göstərir.
Potensial SHORT ssenarisi
* Giriş zonası: 0.00920 – 0.00950
* TP1: 0.00850
* TP2: 0.00750
* TP3: 0.00650
* TP4: 0.00550
* TP5: 0.00470
* Stop Loss: 0.01070
Texniki səbəblər:
* 216%-lik kəskin yüksəliş.
* Daha yüksək qiymət səviyyələrindən güclü rədd cavabı.
* Ardıcıl eniş yönlü 1 saatlıq şamlar.
* Kəskin yüksəlişdən sonra mənfəətin reallaşdırılması ehtimalı.
Vacibdir: Mövqeyə girməzdən əvvəl enişin təsdiqlənməsini gözləyin. 0.01070-dən yuxarı qırılma bu SHORT ideyasını etibarsız edir. Bu, volatilliyi yüksək olan kriptovalyutadır, buna görə kiçik mövqe ölçüsündən istifadə edin.
Burada ticarət edin
{future}(JCTUSDT)
$JCT USDT – Enış yönlü ssenari 🔴
JCT 24 saat ərzində 216%-dən çox bahalaşıb. Bu kəskin yüksəlişdən sonra satıcılar nəzarəti ələ almağa başlayır və qiymət geri çəkilmə əlamətləri göstərir.
Potensial SHORT ssenarisi
* Giriş zonası: 0.00920 – 0.00950
* TP1: 0.00850
* TP2: 0.00750
* TP3: 0.00650
* TP4: 0.00550
* TP5: 0.00470
* Stop Loss: 0.01070
Texniki səbəblər:
* 216%-lik kəskin yüksəliş.
* Daha yüksək qiymət səviyyələrindən güclü rədd cavabı.
* Ardıcıl eniş yönlü 1 saatlıq şamlar.
* Kəskin yüksəlişdən sonra mənfəətin reallaşdırılması ehtimalı.
Vacibdir: Mövqeyə girməzdən əvvəl enişin təsdiqlənməsini gözləyin. 0.01070-dən yuxarı qırılma bu SHORT ideyasını etibarsız edir. Bu, volatilliyi yüksək olan kriptovalyutadır, buna görə kiçik mövqe ölçüsündən istifadə edin.
Burada ticarət edin
JCT 24 saat ərzində 216%-dən çox bahalaşıb. Bu kəskin yüksəlişdən sonra satıcılar nəzarəti ələ almağa başlayır və qiymət geri çəkilmə əlamətləri göstərir.
Potensial SHORT ssenarisi
* Giriş zonası: 0.00920 – 0.00950
* TP1: 0.00850
* TP2: 0.00750
* TP3: 0.00650
* TP4: 0.00550
* TP5: 0.00470
* Stop Loss: 0.01070
Texniki səbəblər:
* 216%-lik kəskin yüksəliş.
* Daha yüksək qiymət səviyyələrindən güclü rədd cavabı.
* Ardıcıl eniş yönlü 1 saatlıq şamlar.
* Kəskin yüksəlişdən sonra mənfəətin reallaşdırılması ehtimalı.
Vacibdir: Mövqeyə girməzdən əvvəl enişin təsdiqlənməsini gözləyin. 0.01070-dən yuxarı qırılma bu SHORT ideyasını etibarsız edir. Bu, volatilliyi yüksək olan kriptovalyutadır, buna görə kiçik mövqe ölçüsündən istifadə edin.
Burada ticarət edin
1
3
1k
Tərcüməyə bax
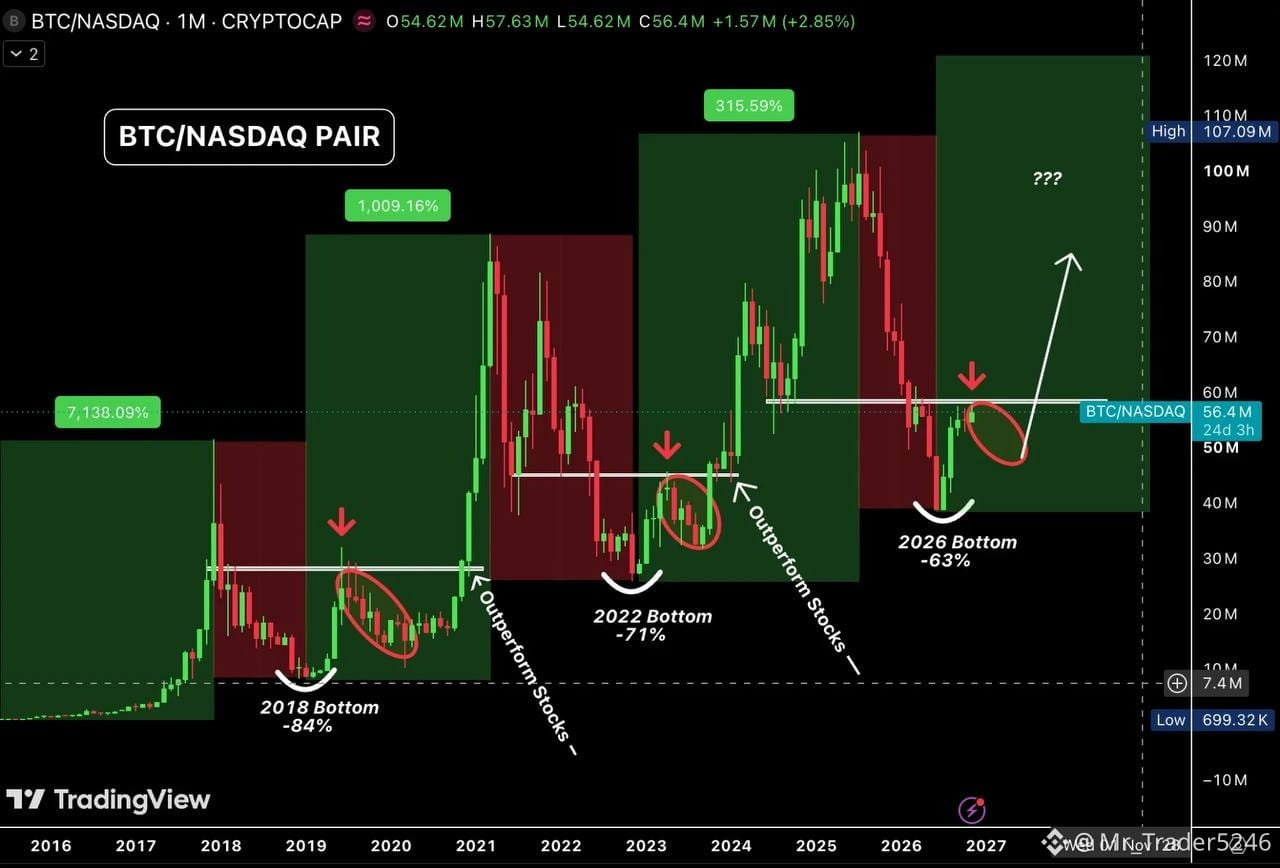
Wall Street has been watching $BTC closely, and this chart tells an interesting story.
Over the past four months, Bitcoin has been outperforming the Nasdaq.
Even this week, while Nasdaq took a hard hit, Bitcoin managed to hold around $75,500. It's also outperforming Nasdaq so far this month.
Now, here's what matters:
-The BTC/Nasdaq pair is testing resistance again.
-If Bitcoin holds its current support, that's a very bullish sign.
-But if it breaks down, we could see another test of the daily MA 200 near $73,240, followed by the weekly MA 200 around $67,760.
Looking at the bigger picture, this structure could take another 6–8 months of sideways movement before the next parabolic rally.
{future}(BTCUSDT)
Wall Street has been watching $BTC closely, and this chart tells an interesting story.
Over the past four months, Bitcoin has been outperforming the Nasdaq.
Even this week, while Nasdaq took a hard hit, Bitcoin managed to hold around $75,500. It's also outperforming Nasdaq so far this month.
Now, here's what matters:
-The BTC/Nasdaq pair is testing resistance again.
-If Bitcoin holds its current support, that's a very bullish sign.
-But if it breaks down, we could see another test of the daily MA 200 near $73,240, followed by the weekly MA 200 around $67,760.
Looking at the bigger picture, this structure could take another 6–8 months of sideways movement before the next parabolic rally.
Over the past four months, Bitcoin has been outperforming the Nasdaq.
Even this week, while Nasdaq took a hard hit, Bitcoin managed to hold around $75,500. It's also outperforming Nasdaq so far this month.
Now, here's what matters:
-The BTC/Nasdaq pair is testing resistance again.
-If Bitcoin holds its current support, that's a very bullish sign.
-But if it breaks down, we could see another test of the daily MA 200 near $73,240, followed by the weekly MA 200 around $67,760.
Looking at the bigger picture, this structure could take another 6–8 months of sideways movement before the next parabolic rally.
1
52
Bu il bazarlarda gördüyümüz ən çılğın həftələrdən biri oldu.
ABŞ səhmləri kəskin ucuzlaşdı, Bitcoin mühüm dəstək səviyyəsini itirdi, Demokratlar isə Konqresə nəzarəti ələ keçirdi.
Bu həftə baş verənlərin hamısı:
1. Demokratlar Nümayəndələr Palatasına və Senata nəzarəti ələ keçirərək qalib gəldilər və Prezident Tramp Konqresi itirdi.
2. Nümayəndələr Palatasından bir demokrat süni intellektə qadağa qoyulmasını tələb etdikdən sonra ABŞ səhmlərinin dəyərindən 3 TRİLYON dollar silindi. Bazarlar 2025-ci ildəki tarif şokundan bəri ən böyük çöküşünü yaşadı.
3. Bitcoin 50 həftəlik hərəkətli ortalamasının altına düşdü və təxminən 2 ay ərzində ilk dəfə 75.000 dollardan aşağı enərək, leverecli mövqelərdə 1 MİLYARD dolları likvidasiya etdi.
4. Bitcoin ETF-ləri 1,28 MİLYARD dollar dəyərində BTC satdı. Bu, 4 ayın ən böyük həftəlik vəsait çıxışı idi.
5. Məlumatlara görə, Demokratlar Prezident Trampın ailəsinin kriptovalyuta bizneslərini araşdırmağı planlaşdırırlar. İddialara görə, bu bizneslər 2,3 MİLYARD dollar gəlir gətirib.
6. Məlumatlara görə, Nümayəndələr Palatasındakı demokratlar SEC-ə bazar üzərində daha çox səlahiyyət verəcək kriptovalyuta qanun layihəsi üzərində işləyirlər.
7. Ağ Ev amerikalılara 401(k) pensiya hesabları vasitəsilə Bitcoin və kriptovalyutalara investisiya etməyə imkan verə biləcək qaydanı nəzərdən keçirir.
8. Coinbase bildirir ki, Konqresə yeni seçilmiş demokratlar əvvəlkindən daha çox KRİPTOVALYUTA TƏRƏFDARIDIR.$JCT $BMT $AKE
Bu il bazarlarda gördüyümüz ən çılğın həftələrdən biri oldu.
ABŞ səhmləri kəskin ucuzlaşdı, Bitcoin mühüm dəstək səviyyəsini itirdi, Demokratlar isə Konqresə nəzarəti ələ keçirdi.
Bu həftə baş verənlərin hamısı:
1. Demokratlar Nümayəndələr Palatasına və Senata nəzarəti ələ keçirərək qalib gəldilər və Prezident Tramp Konqresi itirdi.
2. Nümayəndələr Palatasından bir demokrat süni intellektə qadağa qoyulmasını tələb etdikdən sonra ABŞ səhmlərinin dəyərindən 3 TRİLYON dollar silindi. Bazarlar 2025-ci ildəki tarif şokundan bəri ən böyük çöküşünü yaşadı.
3. Bitcoin 50 həftəlik hərəkətli ortalamasının altına düşdü və təxminən 2 ay ərzində ilk dəfə 75.000 dollardan aşağı enərək, leverecli mövqelərdə 1 MİLYARD dolları likvidasiya etdi.
4. Bitcoin ETF-ləri 1,28 MİLYARD dollar dəyərində BTC satdı. Bu, 4 ayın ən böyük həftəlik vəsait çıxışı idi.
5. Məlumatlara görə, Demokratlar Prezident Trampın ailəsinin kriptovalyuta bizneslərini araşdırmağı planlaşdırırlar. İddialara görə, bu bizneslər 2,3 MİLYARD dollar gəlir gətirib.
6. Məlumatlara görə, Nümayəndələr Palatasındakı demokratlar SEC-ə bazar üzərində daha çox səlahiyyət verəcək kriptovalyuta qanun layihəsi üzərində işləyirlər.
7. Ağ Ev amerikalılara 401(k) pensiya hesabları vasitəsilə Bitcoin və kriptovalyutalara investisiya etməyə imkan verə biləcək qaydanı nəzərdən keçirir.
8. Coinbase bildirir ki, Konqresə yeni seçilmiş demokratlar əvvəlkindən daha çox KRİPTOVALYUTA TƏRƏFDARIDIR.$JCT $BMT $AKE
ABŞ səhmləri kəskin ucuzlaşdı, Bitcoin mühüm dəstək səviyyəsini itirdi, Demokratlar isə Konqresə nəzarəti ələ keçirdi.
Bu həftə baş verənlərin hamısı:
1. Demokratlar Nümayəndələr Palatasına və Senata nəzarəti ələ keçirərək qalib gəldilər və Prezident Tramp Konqresi itirdi.
2. Nümayəndələr Palatasından bir demokrat süni intellektə qadağa qoyulmasını tələb etdikdən sonra ABŞ səhmlərinin dəyərindən 3 TRİLYON dollar silindi. Bazarlar 2025-ci ildəki tarif şokundan bəri ən böyük çöküşünü yaşadı.
3. Bitcoin 50 həftəlik hərəkətli ortalamasının altına düşdü və təxminən 2 ay ərzində ilk dəfə 75.000 dollardan aşağı enərək, leverecli mövqelərdə 1 MİLYARD dolları likvidasiya etdi.
4. Bitcoin ETF-ləri 1,28 MİLYARD dollar dəyərində BTC satdı. Bu, 4 ayın ən böyük həftəlik vəsait çıxışı idi.
5. Məlumatlara görə, Demokratlar Prezident Trampın ailəsinin kriptovalyuta bizneslərini araşdırmağı planlaşdırırlar. İddialara görə, bu bizneslər 2,3 MİLYARD dollar gəlir gətirib.
6. Məlumatlara görə, Nümayəndələr Palatasındakı demokratlar SEC-ə bazar üzərində daha çox səlahiyyət verəcək kriptovalyuta qanun layihəsi üzərində işləyirlər.
7. Ağ Ev amerikalılara 401(k) pensiya hesabları vasitəsilə Bitcoin və kriptovalyutalara investisiya etməyə imkan verə biləcək qaydanı nəzərdən keçirir.
8. Coinbase bildirir ki, Konqresə yeni seçilmiş demokratlar əvvəlkindən daha çox KRİPTOVALYUTA TƏRƏFDARIDIR.$JCT $BMT $AKE
1
50
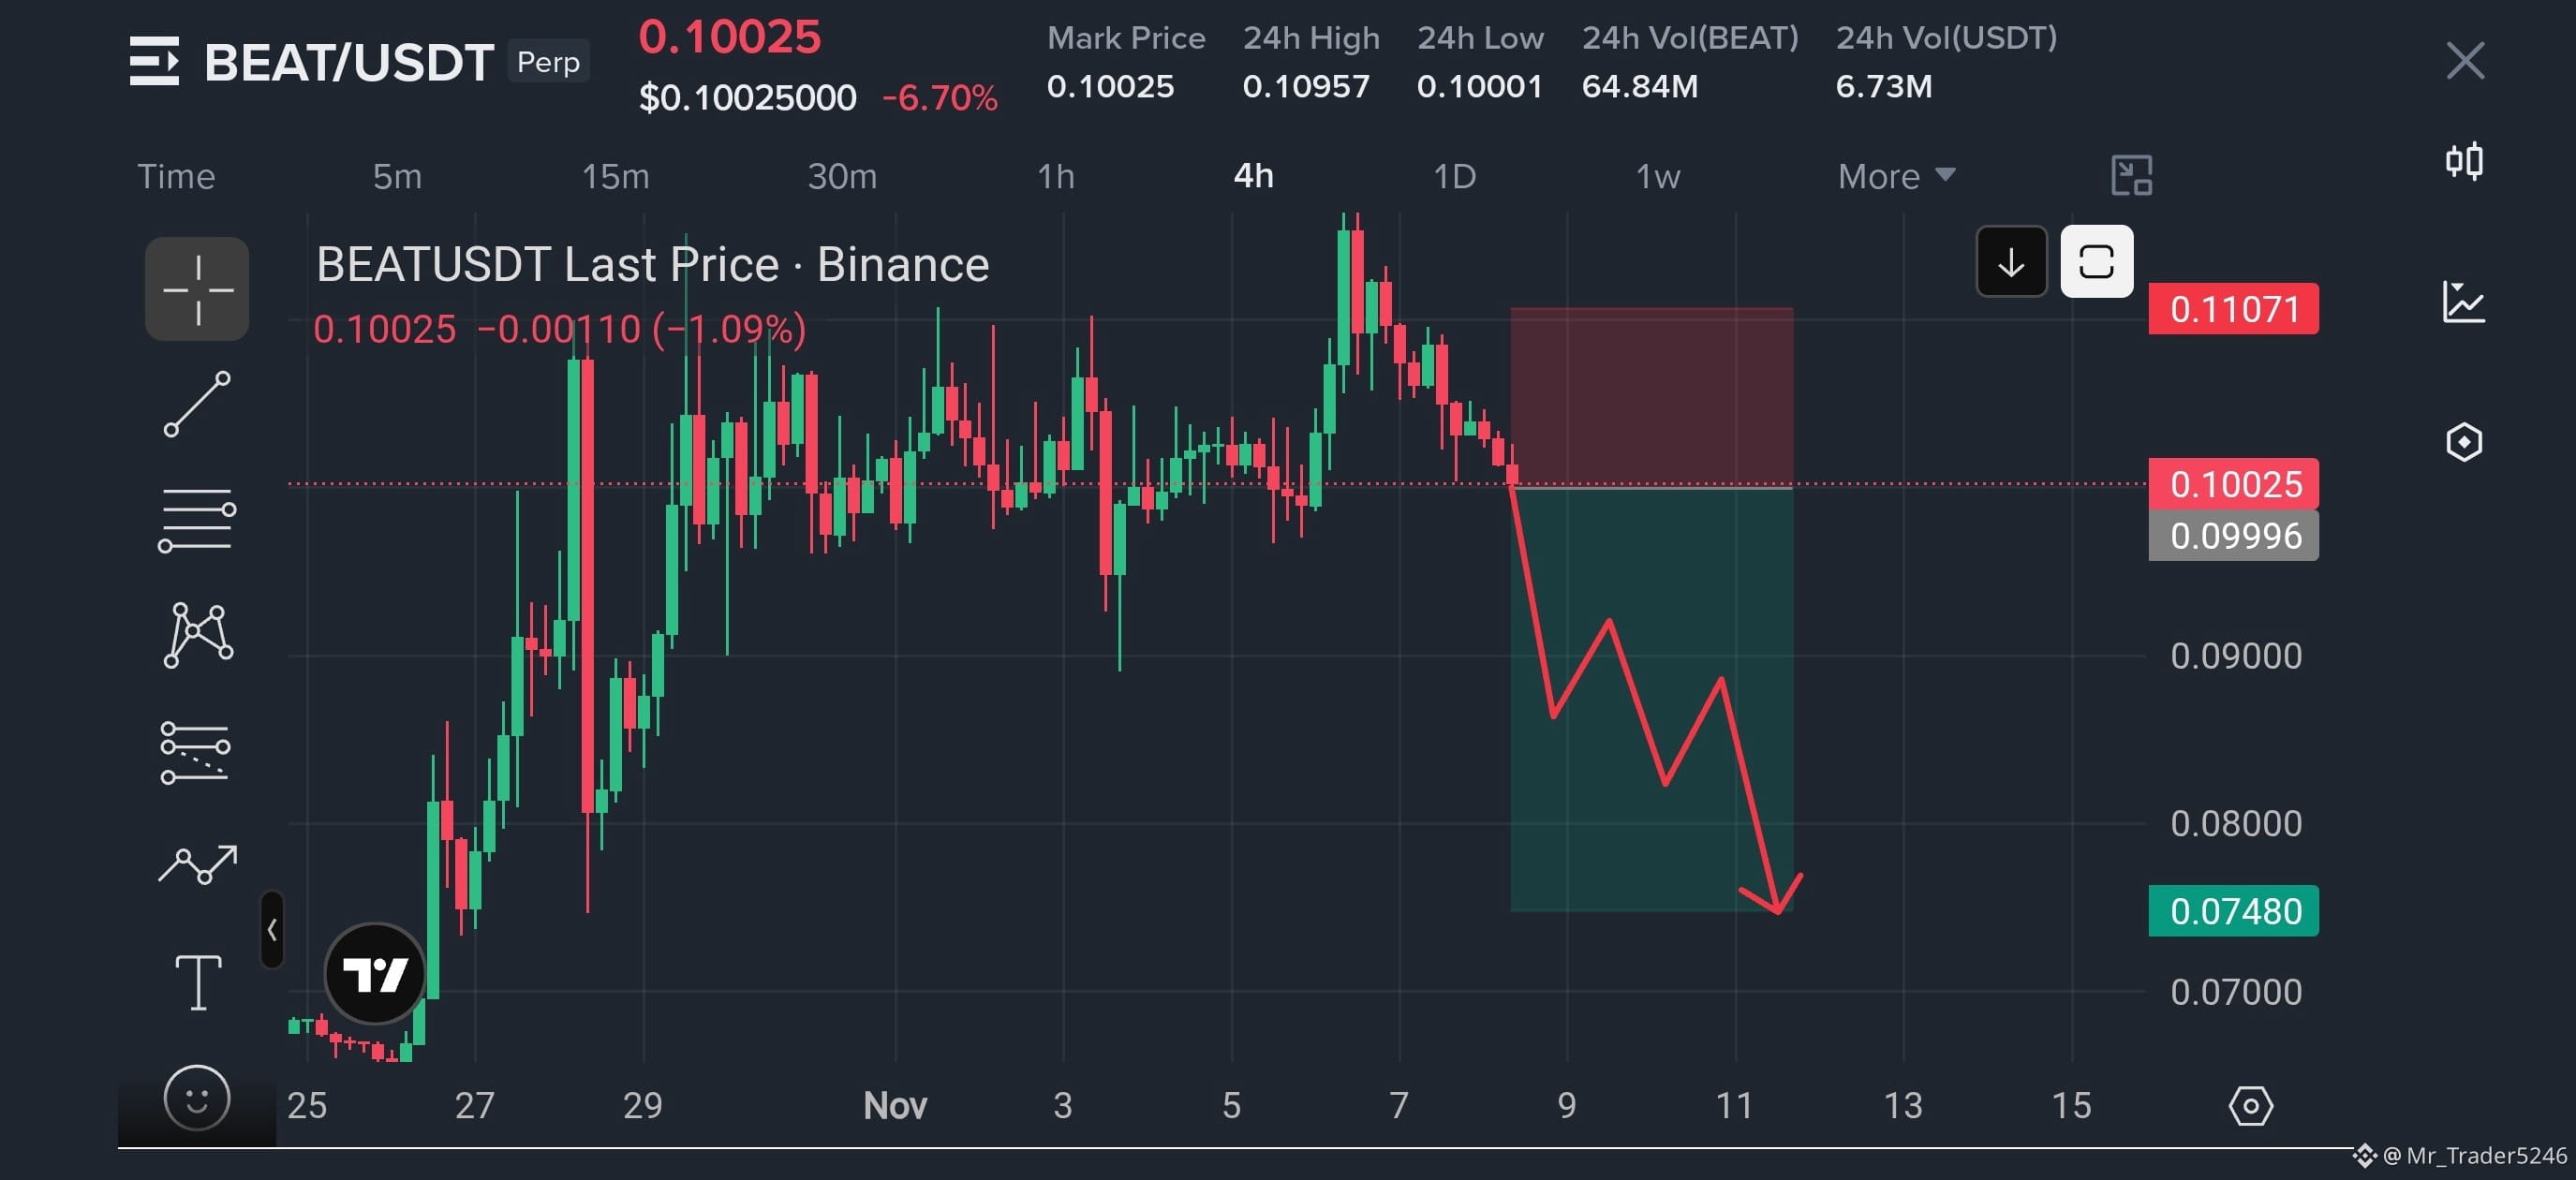
$BEAT USDT – ENİŞ SİQNALI 🔴
Cari qiymət: $0.10025
Qısa mövqe üçün giriş: $0.1000 – $0.1010
Hədəflər 🎯
* TP1: $0.0900
* TP2: $0.0850
* TP3: $0.0800
* TP4: $0.0748
Stop-loss: $0.1107
$BEAT USDT – ENİŞ SİQNALI 🔴
Cari qiymət: $0.10025
Qısa mövqe üçün giriş: $0.1000 – $0.1010
Hədəflər 🎯
* TP1: $0.0900
* TP2: $0.0850
* TP3: $0.0800
* TP4: $0.0748
Stop-loss: $0.1107
Cari qiymət: $0.10025
Qısa mövqe üçün giriş: $0.1000 – $0.1010
Hədəflər 🎯
* TP1: $0.0900
* TP2: $0.0850
* TP3: $0.0800
* TP4: $0.0748
Stop-loss: $0.1107
1
443
·
--
Azalma
$BEAT USDT – ENİŞ YÖNLÜ QURULUŞ 🔴
Cari qiymət: $0.10025
Short giriş: $0.1000 – $0.1010
Hədəflər 🎯
* TP1: $0.0900
* TP2: $0.0850
* TP3: $0.0800
* TP4: $0.0748
Stop-loss: $0.1107
Texniki təhlil:
* BEAT, $0.109–$0.110 müqavimət zonasından geri çəkildikdən sonra eniş impulsu göstərir.
* 4 saatlıq qrafikdə getdikcə daha aşağı zirvələr formalaşır.
* $0.0999 səviyyəsindən aşağı təsdiqlənmiş qırılma enişi daha da sürətləndirə bilər.
* Qırılmış dəstək səviyyəsinin yenidən yoxlanılması başqa bir short fürsəti yarada bilər.
Mənim fikrim: Satış təzyiqi davam edərsə, BEAT $0.0748 səviyyəsinə doğru daha dərin korreksiya görə bilər.
Buradan ticarət edin 👇
{future}(BEATUSDT)
$BEAT USDT – ENİŞ YÖNLÜ QURULUŞ 🔴
Cari qiymət: $0.10025
Short giriş: $0.1000 – $0.1010
Hədəflər 🎯
* TP1: $0.0900
* TP2: $0.0850
* TP3: $0.0800
* TP4: $0.0748
Stop-loss: $0.1107
Texniki təhlil:
* BEAT, $0.109–$0.110 müqavimət zonasından geri çəkildikdən sonra eniş impulsu göstərir.
* 4 saatlıq qrafikdə getdikcə daha aşağı zirvələr formalaşır.
* $0.0999 səviyyəsindən aşağı təsdiqlənmiş qırılma enişi daha da sürətləndirə bilər.
* Qırılmış dəstək səviyyəsinin yenidən yoxlanılması başqa bir short fürsəti yarada bilər.
Mənim fikrim: Satış təzyiqi davam edərsə, BEAT $0.0748 səviyyəsinə doğru daha dərin korreksiya görə bilər.
Buradan ticarət edin 👇
Cari qiymət: $0.10025
Short giriş: $0.1000 – $0.1010
Hədəflər 🎯
* TP1: $0.0900
* TP2: $0.0850
* TP3: $0.0800
* TP4: $0.0748
Stop-loss: $0.1107
Texniki təhlil:
* BEAT, $0.109–$0.110 müqavimət zonasından geri çəkildikdən sonra eniş impulsu göstərir.
* 4 saatlıq qrafikdə getdikcə daha aşağı zirvələr formalaşır.
* $0.0999 səviyyəsindən aşağı təsdiqlənmiş qırılma enişi daha da sürətləndirə bilər.
* Qırılmış dəstək səviyyəsinin yenidən yoxlanılması başqa bir short fürsəti yarada bilər.
Mənim fikrim: Satış təzyiqi davam edərsə, BEAT $0.0748 səviyyəsinə doğru daha dərin korreksiya görə bilər.
Buradan ticarət edin 👇
1
1
330
·
--
Artım
Tərcüməyə bax
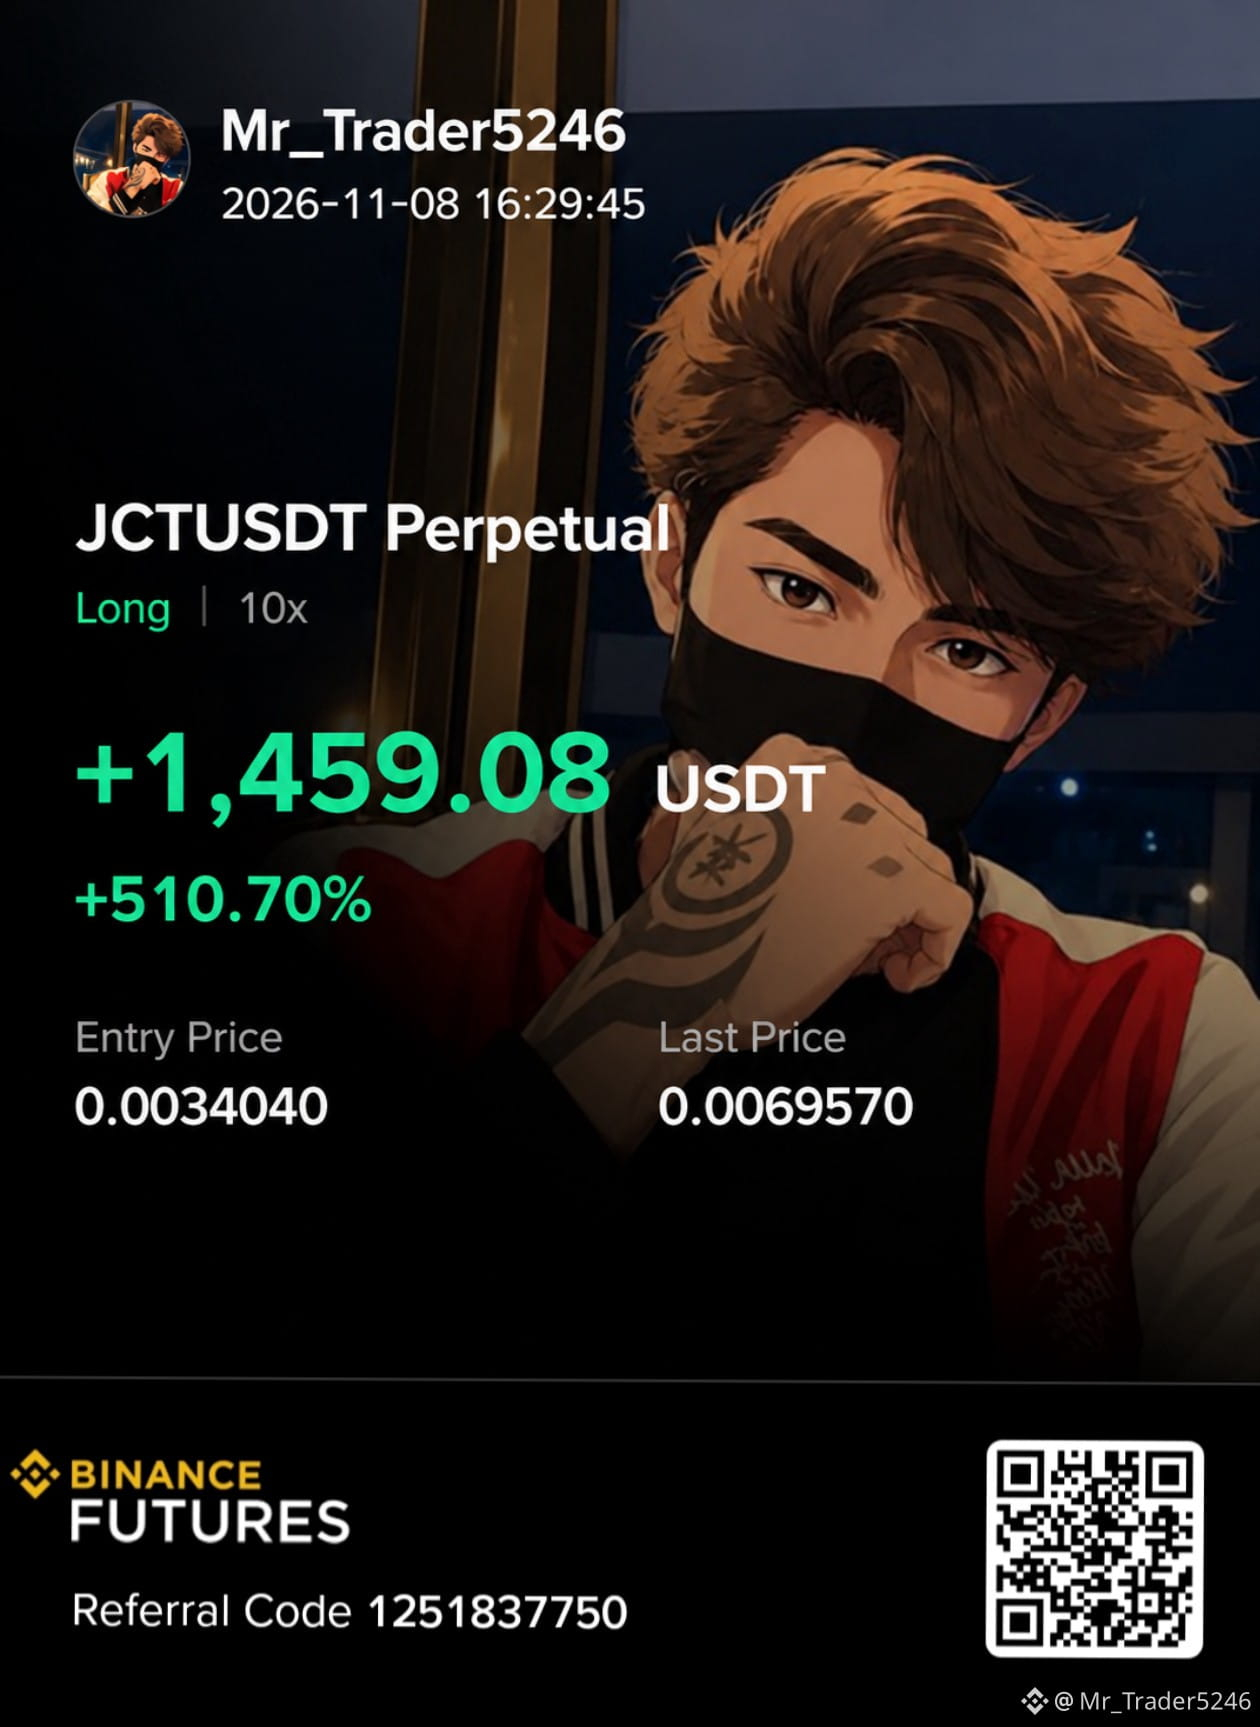
Wtf, I got a little busy with work and just checked my phone. I was shocked to see almost 1,450 USDT in profit 😱
$JCT
{future}(JCTUSDT)
Wtf, I got a little busy with work and just checked my phone. I was shocked to see almost 1,450 USDT in profit 😱
$JCT
$JCT
2
1
38
·
--
Azalma
Tərcüməyə bax
I'm closing my $KOMA trade now! 🔥
I already shared this trade with you earlier. Whoever took this entry must be sitting on a good amount of profit by now. 💰
So make sure to follow me, guys! More trading opportunities and new signals are coming soon. 🚀 Stay tuned!
{future}(KOMAUSDT)
I'm closing my $KOMA trade now! 🔥
I already shared this trade with you earlier. Whoever took this entry must be sitting on a good amount of profit by now. 💰
So make sure to follow me, guys! More trading opportunities and new signals are coming soon. 🚀 Stay tuned!
I already shared this trade with you earlier. Whoever took this entry must be sitting on a good amount of profit by now. 💰
So make sure to follow me, guys! More trading opportunities and new signals are coming soon. 🚀 Stay tuned!
Mr_Trader5246
·
--
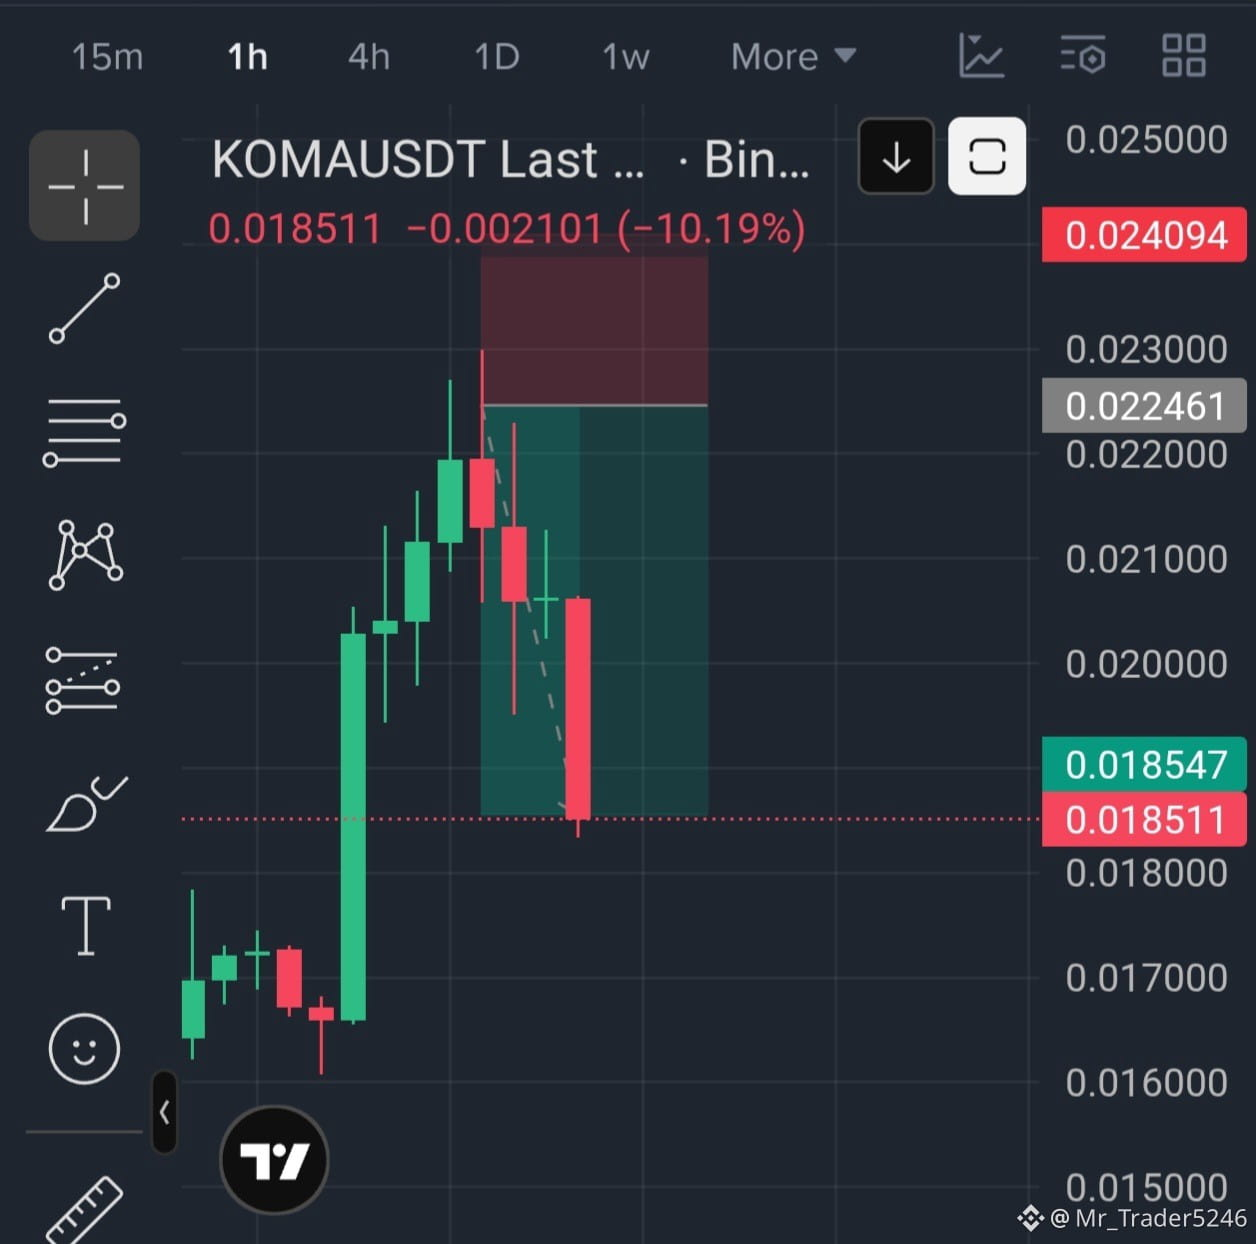
Azalma$KOMA USDT — SHORT Setup 📉
Entry Zone: $0.02240 – $0.02260
Take Profit Targets:
* TP1: $0.02150
* TP2: $0.02050
* TP3: $0.01950
* TP4: $0.01855
Stop Loss: $0.02410
Reason for Short:
* Price has already pumped more than 73%, making a short-term correction possible.
* Strong selling pressure may appear near the $0.0225–$0.0230 resistance zone.
* After such a sharp upward move, profit booking can trigger a pullback.
* Volume is elevated, so volatility may remain high.
Confirmation: Wait for a 15-minute bearish candle close before entering.
Trade here 👇
Entry Zone: $0.02240 – $0.02260
Take Profit Targets:
* TP1: $0.02150
* TP2: $0.02050
* TP3: $0.01950
* TP4: $0.01855
Stop Loss: $0.02410
Reason for Short:
* Price has already pumped more than 73%, making a short-term correction possible.
* Strong selling pressure may appear near the $0.0225–$0.0230 resistance zone.
* After such a sharp upward move, profit booking can trigger a pullback.
* Volume is elevated, so volatility may remain high.
Confirmation: Wait for a 15-minute bearish candle close before entering.
Trade here 👇
2
90
Tərcüməyə bax
$JCT All target done guys 🫡 enjoy and make sure follow up 🫡
$JCT All target done guys 🫡 enjoy and make sure follow up 🫡
Mr_Trader5246
·
--
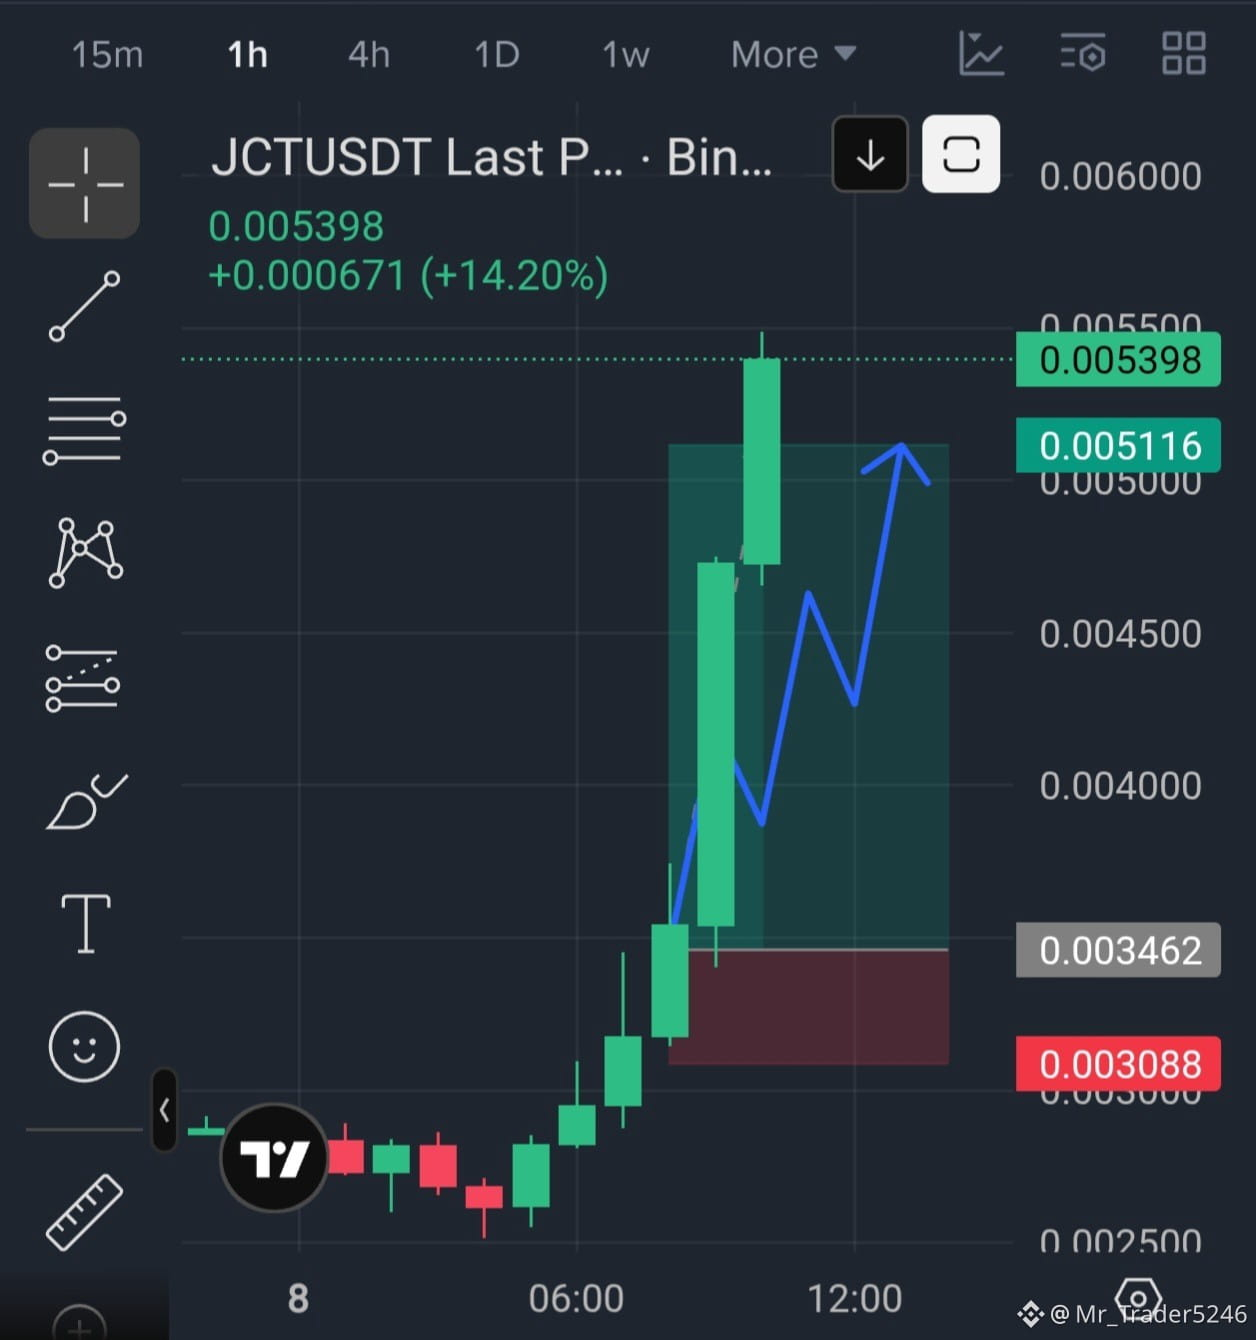
Artım$JCT USDT — LONG Setup 📈
Entry Zone: 0.00340 – 0.00346
Take Profit Targets:
* TP1: 0.00380
* TP2: 0.00420
* TP3: 0.00460
* TP4: 0.00485
* TP5: 0.00511
Stop Loss: 0.003088
Technical Analysis:
* Strong bullish momentum on the 15-minute chart.
* Increasing buying volume indicates strong market participation.
* Price has broken out of its previous consolidation zone.
* A successful retest of 0.00340–0.00346 could support further upside.
* Next major upside target is around 0.00511.
⚠️ Important: Avoid chasing the pump. Wait for a confirmed breakout or retest before entering. The setup can fail if price loses support.
Trade here 👇
Entry Zone: 0.00340 – 0.00346
Take Profit Targets:
* TP1: 0.00380
* TP2: 0.00420
* TP3: 0.00460
* TP4: 0.00485
* TP5: 0.00511
Stop Loss: 0.003088
Technical Analysis:
* Strong bullish momentum on the 15-minute chart.
* Increasing buying volume indicates strong market participation.
* Price has broken out of its previous consolidation zone.
* A successful retest of 0.00340–0.00346 could support further upside.
* Next major upside target is around 0.00511.
⚠️ Important: Avoid chasing the pump. Wait for a confirmed breakout or retest before entering. The setup can fail if price loses support.
Trade here 👇
1
261
·
--
Artım
Tərcüməyə bax
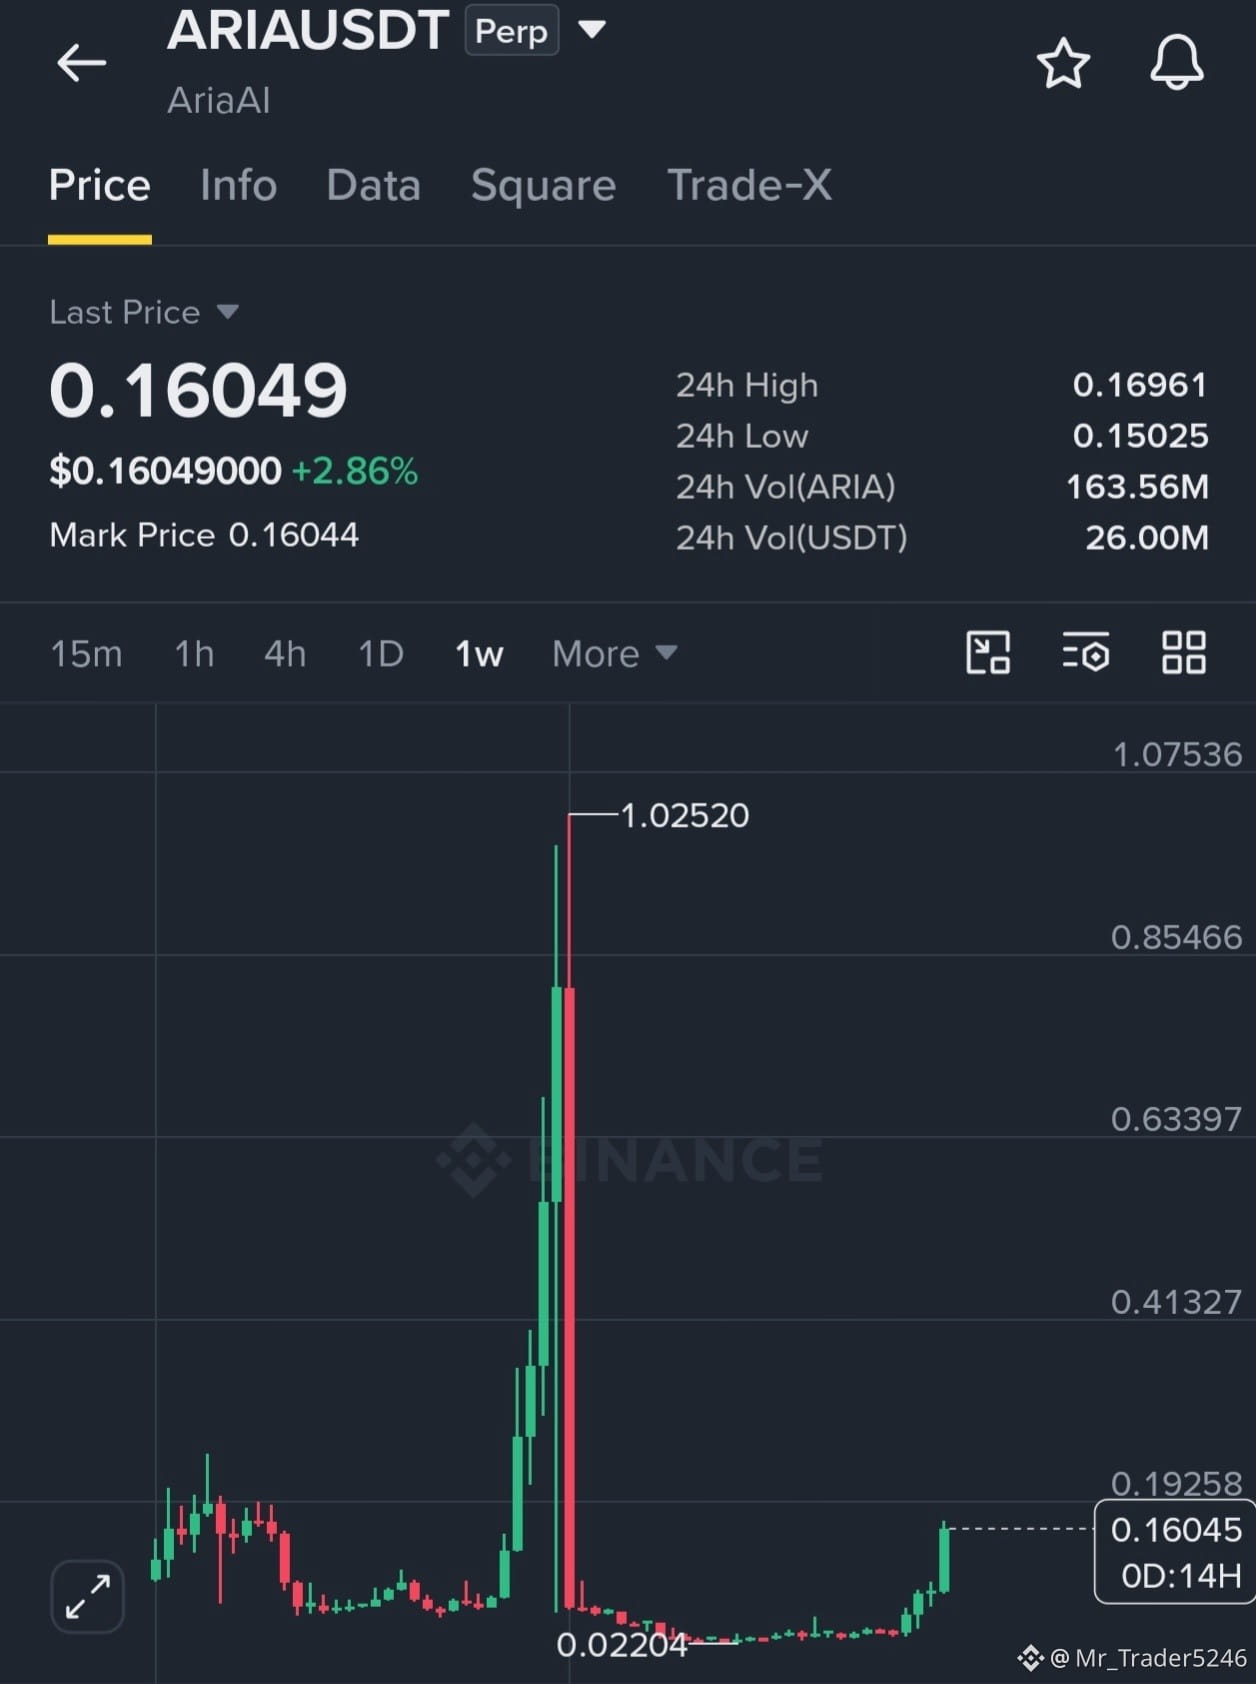
$ARIA – BIG MOVE COMING?
ARIA is showing strong bullish momentum! 📈
After a massive breakout, buyers are stepping in again. Keep an eye on this one — another big pump could be on the way! 🔥
Are you bullish on ARIA? 👀
{future}(ARIAUSDT)
#ARIA #crypto #Altcoins #BinanceSquare
$ARIA – BIG MOVE COMING?
ARIA is showing strong bullish momentum! 📈
After a massive breakout, buyers are stepping in again. Keep an eye on this one — another big pump could be on the way! 🔥
Are you bullish on ARIA? 👀
#ARIA #crypto #Altcoins #BinanceSquare
ARIA is showing strong bullish momentum! 📈
After a massive breakout, buyers are stepping in again. Keep an eye on this one — another big pump could be on the way! 🔥
Are you bullish on ARIA? 👀
#ARIA #crypto #Altcoins #BinanceSquare
2
255
Tərcüməyə bax
$IDOL USDT – Bearish Setup (15M)
IDOL has already pumped around 32% in 24 hours. Price is showing rejection near the upper resistance zone, suggesting a possible correction.
Potential Short Trade
* Entry: 0.0322 – 0.0328
* TP1: 0.0300
* TP2: 0.0280
* TP3: 0.0260
* TP4: 0.0245
* TP5: 0.0235
* Stop Loss: 0.0353
$IDOL USDT – Bearish Setup (15M)
IDOL has already pumped around 32% in 24 hours. Price is showing rejection near the upper resistance zone, suggesting a possible correction.
Potential Short Trade
* Entry: 0.0322 – 0.0328
* TP1: 0.0300
* TP2: 0.0280
* TP3: 0.0260
* TP4: 0.0245
* TP5: 0.0235
* Stop Loss: 0.0353
IDOL has already pumped around 32% in 24 hours. Price is showing rejection near the upper resistance zone, suggesting a possible correction.
Potential Short Trade
* Entry: 0.0322 – 0.0328
* TP1: 0.0300
* TP2: 0.0280
* TP3: 0.0260
* TP4: 0.0245
* TP5: 0.0235
* Stop Loss: 0.0353
1
69
·
--
Azalma
Tərcüməyə bax
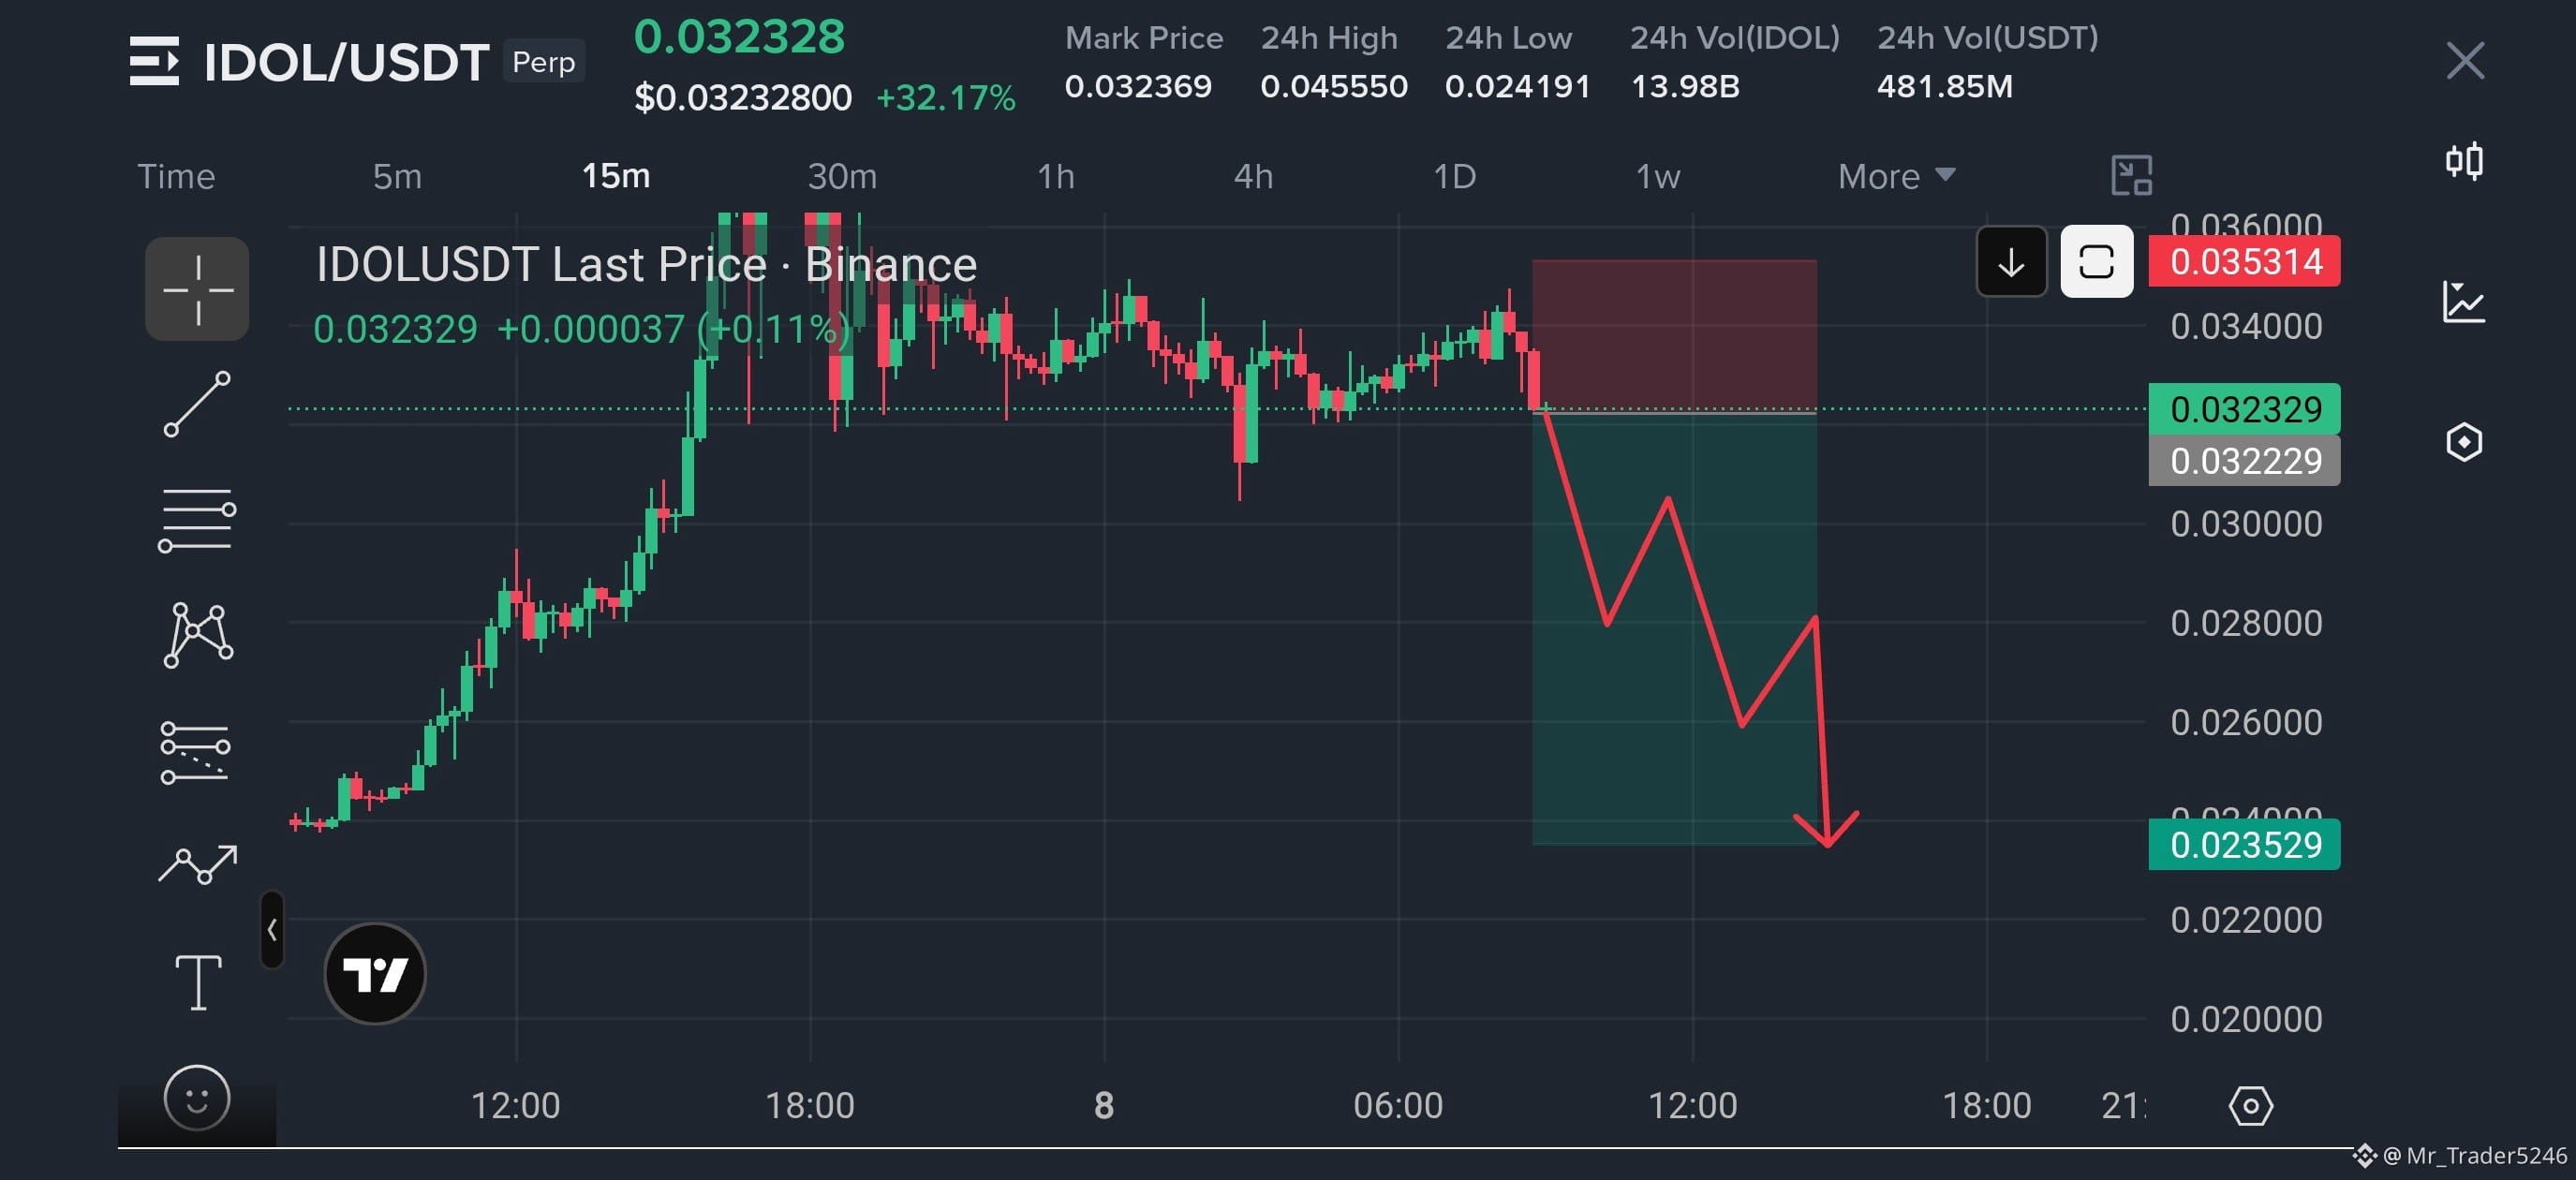
$IDOL /USDT – Bearish Setup (15M)
IDOL has already pumped around 32% in 24 hours. Price is showing rejection near the upper resistance zone, suggesting a possible correction.
Potential Short Trade
* Entry: 0.0322 – 0.0328
* TP1: 0.0300
* TP2: 0.0280
* TP3: 0.0260
* TP4: 0.0245
* TP5: 0.0235
* Stop Loss: 0.0353
Technical Reason:
* Strong pump followed by sideways consolidation.
* Rejection near 0.0340–0.0350 resistance.
* Potential bearish momentum shift.
* A breakdown below 0.0320 could trigger further downside.
Important: Wait for a confirmed 15-minute breakdown below 0.0320 before entering. This is a high-volatility countertrend short, not a confirmed reversal.
My view: A correction toward 0.0280–0.0235 is possible if selling pressure continues.
Trade here 👇
{future}(IDOLUSDT)
$IDOL /USDT – Bearish Setup (15M)
IDOL has already pumped around 32% in 24 hours. Price is showing rejection near the upper resistance zone, suggesting a possible correction.
Potential Short Trade
* Entry: 0.0322 – 0.0328
* TP1: 0.0300
* TP2: 0.0280
* TP3: 0.0260
* TP4: 0.0245
* TP5: 0.0235
* Stop Loss: 0.0353
Technical Reason:
* Strong pump followed by sideways consolidation.
* Rejection near 0.0340–0.0350 resistance.
* Potential bearish momentum shift.
* A breakdown below 0.0320 could trigger further downside.
Important: Wait for a confirmed 15-minute breakdown below 0.0320 before entering. This is a high-volatility countertrend short, not a confirmed reversal.
My view: A correction toward 0.0280–0.0235 is possible if selling pressure continues.
Trade here 👇
IDOL has already pumped around 32% in 24 hours. Price is showing rejection near the upper resistance zone, suggesting a possible correction.
Potential Short Trade
* Entry: 0.0322 – 0.0328
* TP1: 0.0300
* TP2: 0.0280
* TP3: 0.0260
* TP4: 0.0245
* TP5: 0.0235
* Stop Loss: 0.0353
Technical Reason:
* Strong pump followed by sideways consolidation.
* Rejection near 0.0340–0.0350 resistance.
* Potential bearish momentum shift.
* A breakdown below 0.0320 could trigger further downside.
Important: Wait for a confirmed 15-minute breakdown below 0.0320 before entering. This is a high-volatility countertrend short, not a confirmed reversal.
My view: A correction toward 0.0280–0.0235 is possible if selling pressure continues.
Trade here 👇
2
158
Tərcüməyə bax
$JCT USDT — LONG Setup 📈
Entry Zone: 0.00340 – 0.00346
Take Profit Targets:
* TP1: 0.00380
* TP2: 0.00420
* TP3: 0.00460
* TP4: 0.00485
* TP5: 0.00511
Stop Loss: 0.003088
$JCT USDT — LONG Setup 📈
Entry Zone: 0.00340 – 0.00346
Take Profit Targets:
* TP1: 0.00380
* TP2: 0.00420
* TP3: 0.00460
* TP4: 0.00485
* TP5: 0.00511
Stop Loss: 0.003088
Entry Zone: 0.00340 – 0.00346
Take Profit Targets:
* TP1: 0.00380
* TP2: 0.00420
* TP3: 0.00460
* TP4: 0.00485
* TP5: 0.00511
Stop Loss: 0.003088
2
256
·
--
Artım
Tərcüməyə bax
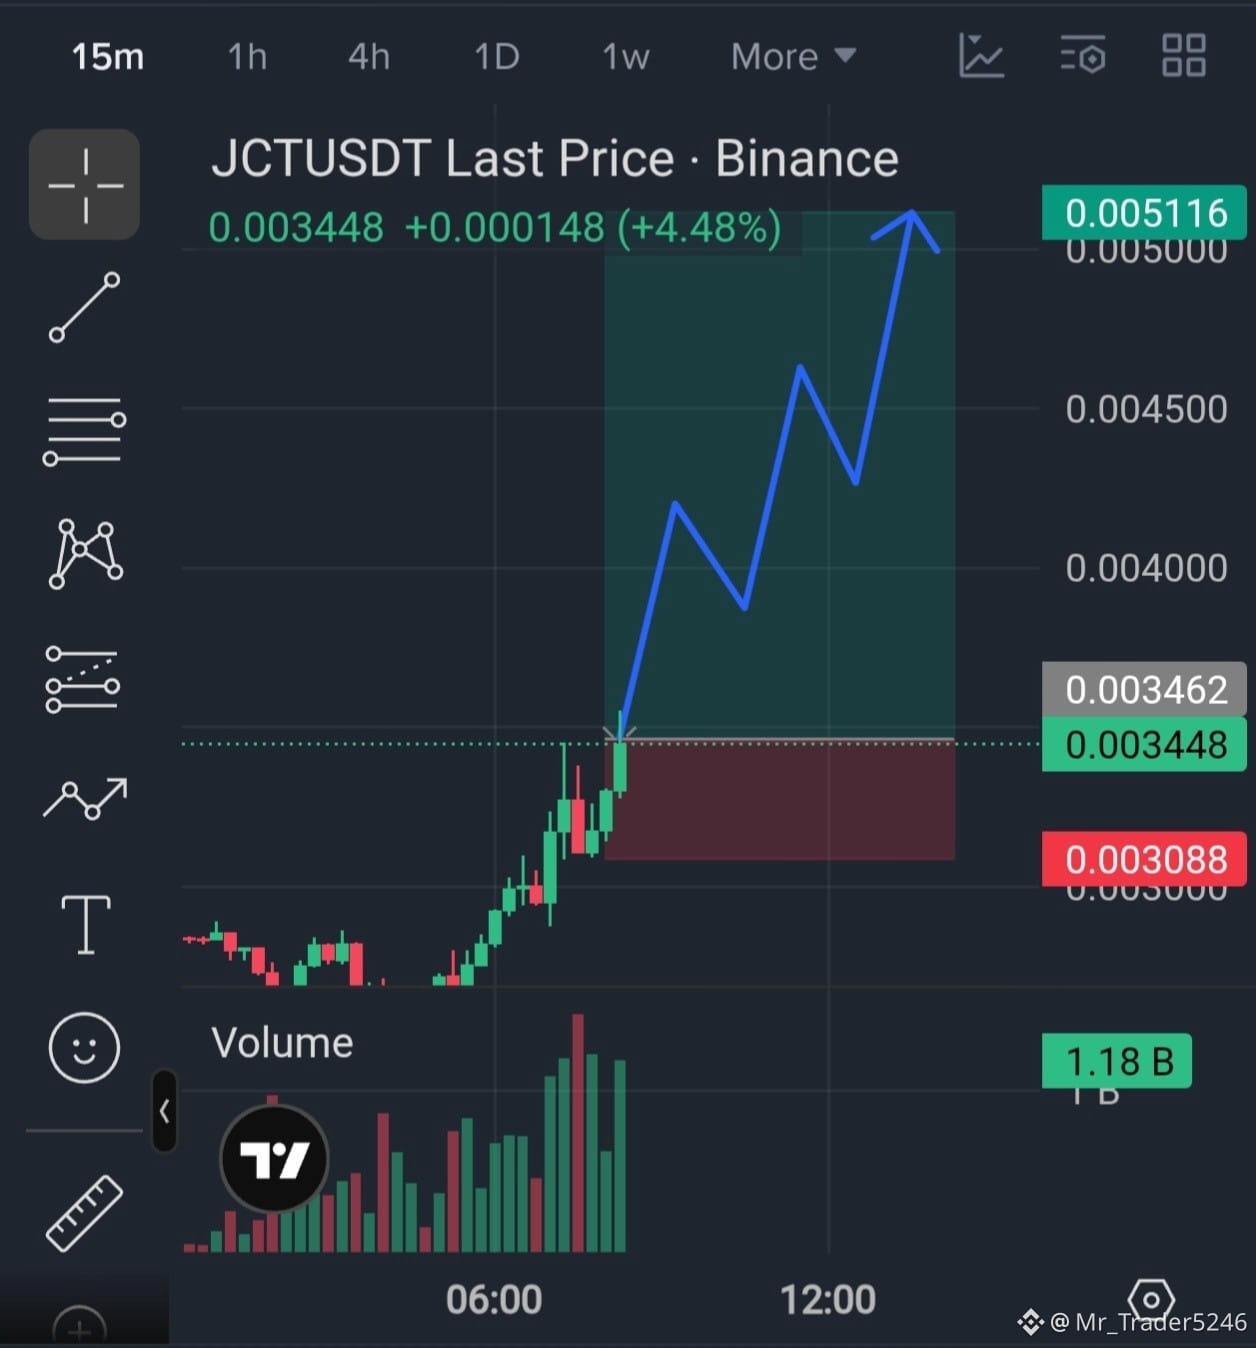
$JCT USDT — LONG Setup 📈
Entry Zone: 0.00340 – 0.00346
Take Profit Targets:
* TP1: 0.00380
* TP2: 0.00420
* TP3: 0.00460
* TP4: 0.00485
* TP5: 0.00511
Stop Loss: 0.003088
Technical Analysis:
* Strong bullish momentum on the 15-minute chart.
* Increasing buying volume indicates strong market participation.
* Price has broken out of its previous consolidation zone.
* A successful retest of 0.00340–0.00346 could support further upside.
* Next major upside target is around 0.00511.
⚠️ Important: Avoid chasing the pump. Wait for a confirmed breakout or retest before entering. The setup can fail if price loses support.
Trade here 👇
{future}(JCTUSDT)
$JCT USDT — LONG Setup 📈
Entry Zone: 0.00340 – 0.00346
Take Profit Targets:
* TP1: 0.00380
* TP2: 0.00420
* TP3: 0.00460
* TP4: 0.00485
* TP5: 0.00511
Stop Loss: 0.003088
Technical Analysis:
* Strong bullish momentum on the 15-minute chart.
* Increasing buying volume indicates strong market participation.
* Price has broken out of its previous consolidation zone.
* A successful retest of 0.00340–0.00346 could support further upside.
* Next major upside target is around 0.00511.
⚠️ Important: Avoid chasing the pump. Wait for a confirmed breakout or retest before entering. The setup can fail if price loses support.
Trade here 👇
Entry Zone: 0.00340 – 0.00346
Take Profit Targets:
* TP1: 0.00380
* TP2: 0.00420
* TP3: 0.00460
* TP4: 0.00485
* TP5: 0.00511
Stop Loss: 0.003088
Technical Analysis:
* Strong bullish momentum on the 15-minute chart.
* Increasing buying volume indicates strong market participation.
* Price has broken out of its previous consolidation zone.
* A successful retest of 0.00340–0.00346 could support further upside.
* Next major upside target is around 0.00511.
⚠️ Important: Avoid chasing the pump. Wait for a confirmed breakout or retest before entering. The setup can fail if price loses support.
Trade here 👇
1
2
211
Tərcüməyə bax
Guys, $JCT is showing strong bullish momentum on the 15-minute timeframe.
Reason for LONG:
Strong bullish candles indicate increasing buying pressure.
Volume is increasing, supporting the upward momentum.
Price has broken above its recent consolidation zone.
Buyers are currently showing strength, which could push the price towards higher resistance levels.
Entry Zone: 0.00340 – 0.00346
Take Profit Targets:
TP1: 0.00370
TP2: 0.00400
TP3: 0.00440
TP4: 0.00480
TP5: 0.00510
Stop Loss: 0.00308
Guys, $JCT is showing strong bullish momentum on the 15-minute timeframe.
Reason for LONG:
Strong bullish candles indicate increasing buying pressure.
Volume is increasing, supporting the upward momentum.
Price has broken above its recent consolidation zone.
Buyers are currently showing strength, which could push the price towards higher resistance levels.
Entry Zone: 0.00340 – 0.00346
Take Profit Targets:
TP1: 0.00370
TP2: 0.00400
TP3: 0.00440
TP4: 0.00480
TP5: 0.00510
Stop Loss: 0.00308
Reason for LONG:
Strong bullish candles indicate increasing buying pressure.
Volume is increasing, supporting the upward momentum.
Price has broken above its recent consolidation zone.
Buyers are currently showing strength, which could push the price towards higher resistance levels.
Entry Zone: 0.00340 – 0.00346
Take Profit Targets:
TP1: 0.00370
TP2: 0.00400
TP3: 0.00440
TP4: 0.00480
TP5: 0.00510
Stop Loss: 0.00308
2
196
·
--
Artım
Tərcüməyə bax
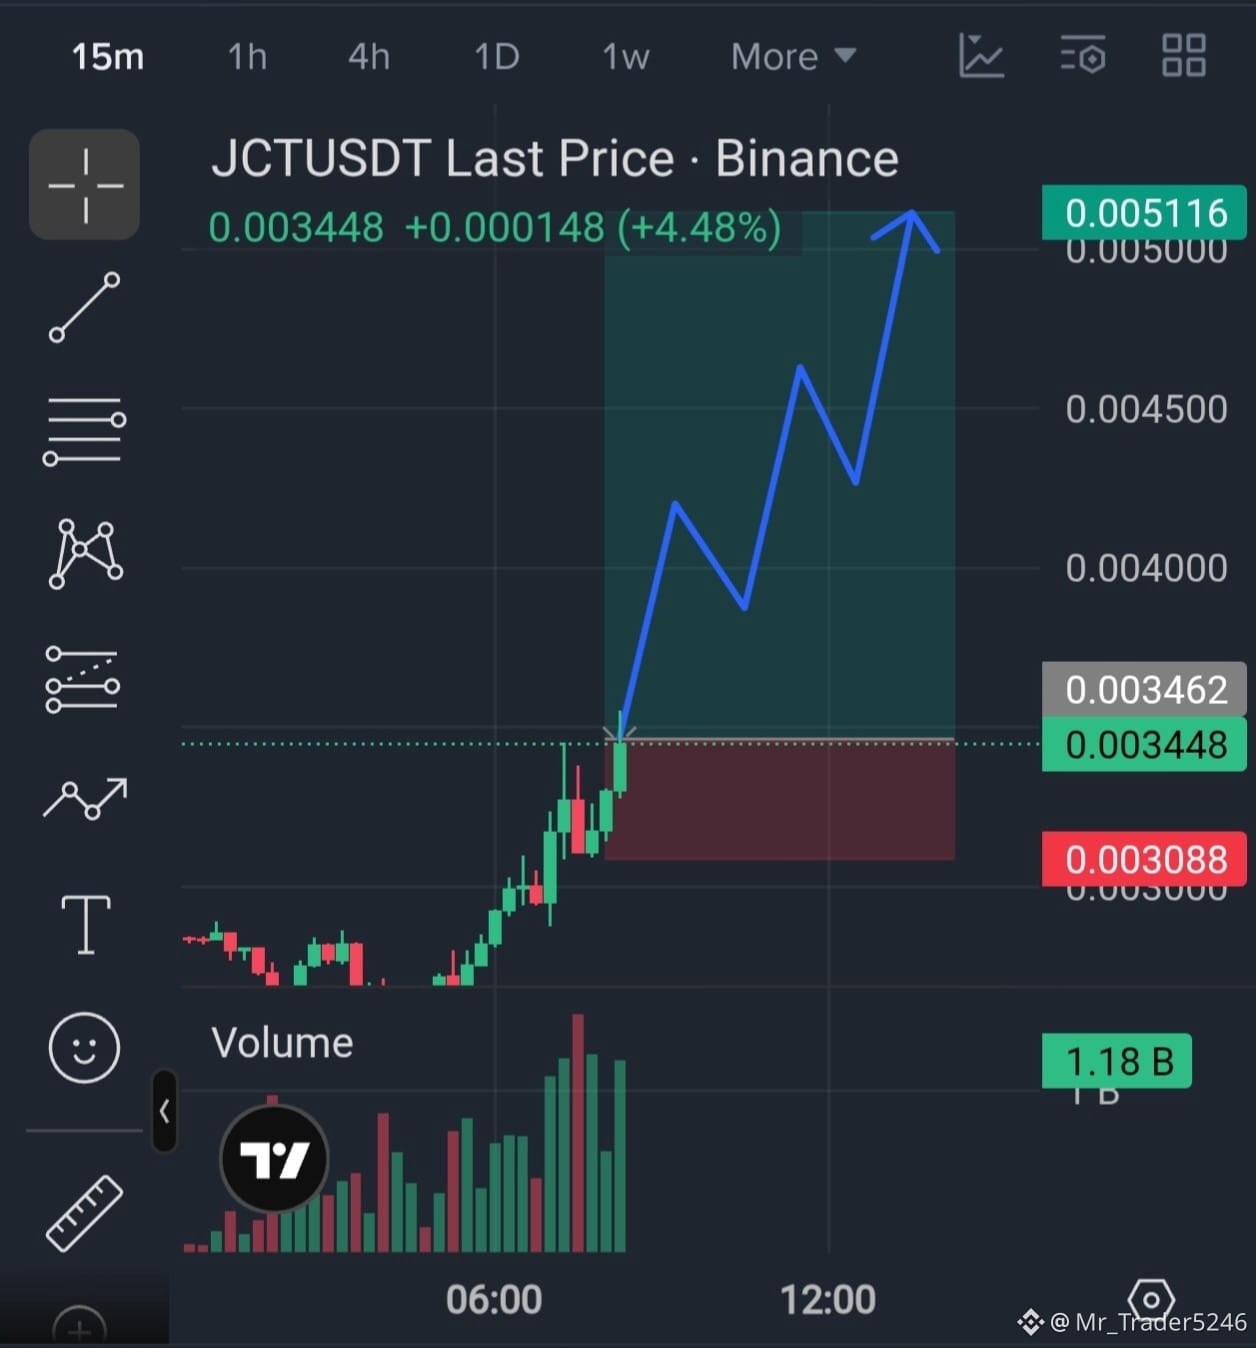
Guys, $JCT is showing strong bullish momentum on the 15-minute timeframe.
Reason for LONG:
Strong bullish candles indicate increasing buying pressure.
Volume is increasing, supporting the upward momentum.
Price has broken above its recent consolidation zone.
Buyers are currently showing strength, which could push the price towards higher resistance levels.
Entry Zone: 0.00340 – 0.00346
Take Profit Targets:
TP1: 0.00370
TP2: 0.00400
TP3: 0.00440
TP4: 0.00480
TP5: 0.00510
Stop Loss: 0.00308
📈 Momentum looks bullish. Wait for entry confirmation and manage your risk properly. Let's catch this move!
Trade here 👇
{future}(JCTUSDT)
Guys, $JCT is showing strong bullish momentum on the 15-minute timeframe.
Reason for LONG:
Strong bullish candles indicate increasing buying pressure.
Volume is increasing, supporting the upward momentum.
Price has broken above its recent consolidation zone.
Buyers are currently showing strength, which could push the price towards higher resistance levels.
Entry Zone: 0.00340 – 0.00346
Take Profit Targets:
TP1: 0.00370
TP2: 0.00400
TP3: 0.00440
TP4: 0.00480
TP5: 0.00510
Stop Loss: 0.00308
📈 Momentum looks bullish. Wait for entry confirmation and manage your risk properly. Let's catch this move!
Trade here 👇
Reason for LONG:
Strong bullish candles indicate increasing buying pressure.
Volume is increasing, supporting the upward momentum.
Price has broken above its recent consolidation zone.
Buyers are currently showing strength, which could push the price towards higher resistance levels.
Entry Zone: 0.00340 – 0.00346
Take Profit Targets:
TP1: 0.00370
TP2: 0.00400
TP3: 0.00440
TP4: 0.00480
TP5: 0.00510
Stop Loss: 0.00308
📈 Momentum looks bullish. Wait for entry confirmation and manage your risk properly. Let's catch this move!
Trade here 👇
2
123
Tərcüməyə bax
$ETH USDT — LONG Setup 📈
Entry Zone: $2,239.75 – $2,240.55
Take Profit Targets:
* TP1: $2,244.00
* TP2: $2,247.00
* TP3: $2,251.50
Stop Loss: $2,234.99
$ETH USDT — LONG Setup 📈
Entry Zone: $2,239.75 – $2,240.55
Take Profit Targets:
* TP1: $2,244.00
* TP2: $2,247.00
* TP3: $2,251.50
Stop Loss: $2,234.99
Entry Zone: $2,239.75 – $2,240.55
Take Profit Targets:
* TP1: $2,244.00
* TP2: $2,247.00
* TP3: $2,251.50
Stop Loss: $2,234.99
2
45
·
--
Artım
Tərcüməyə bax
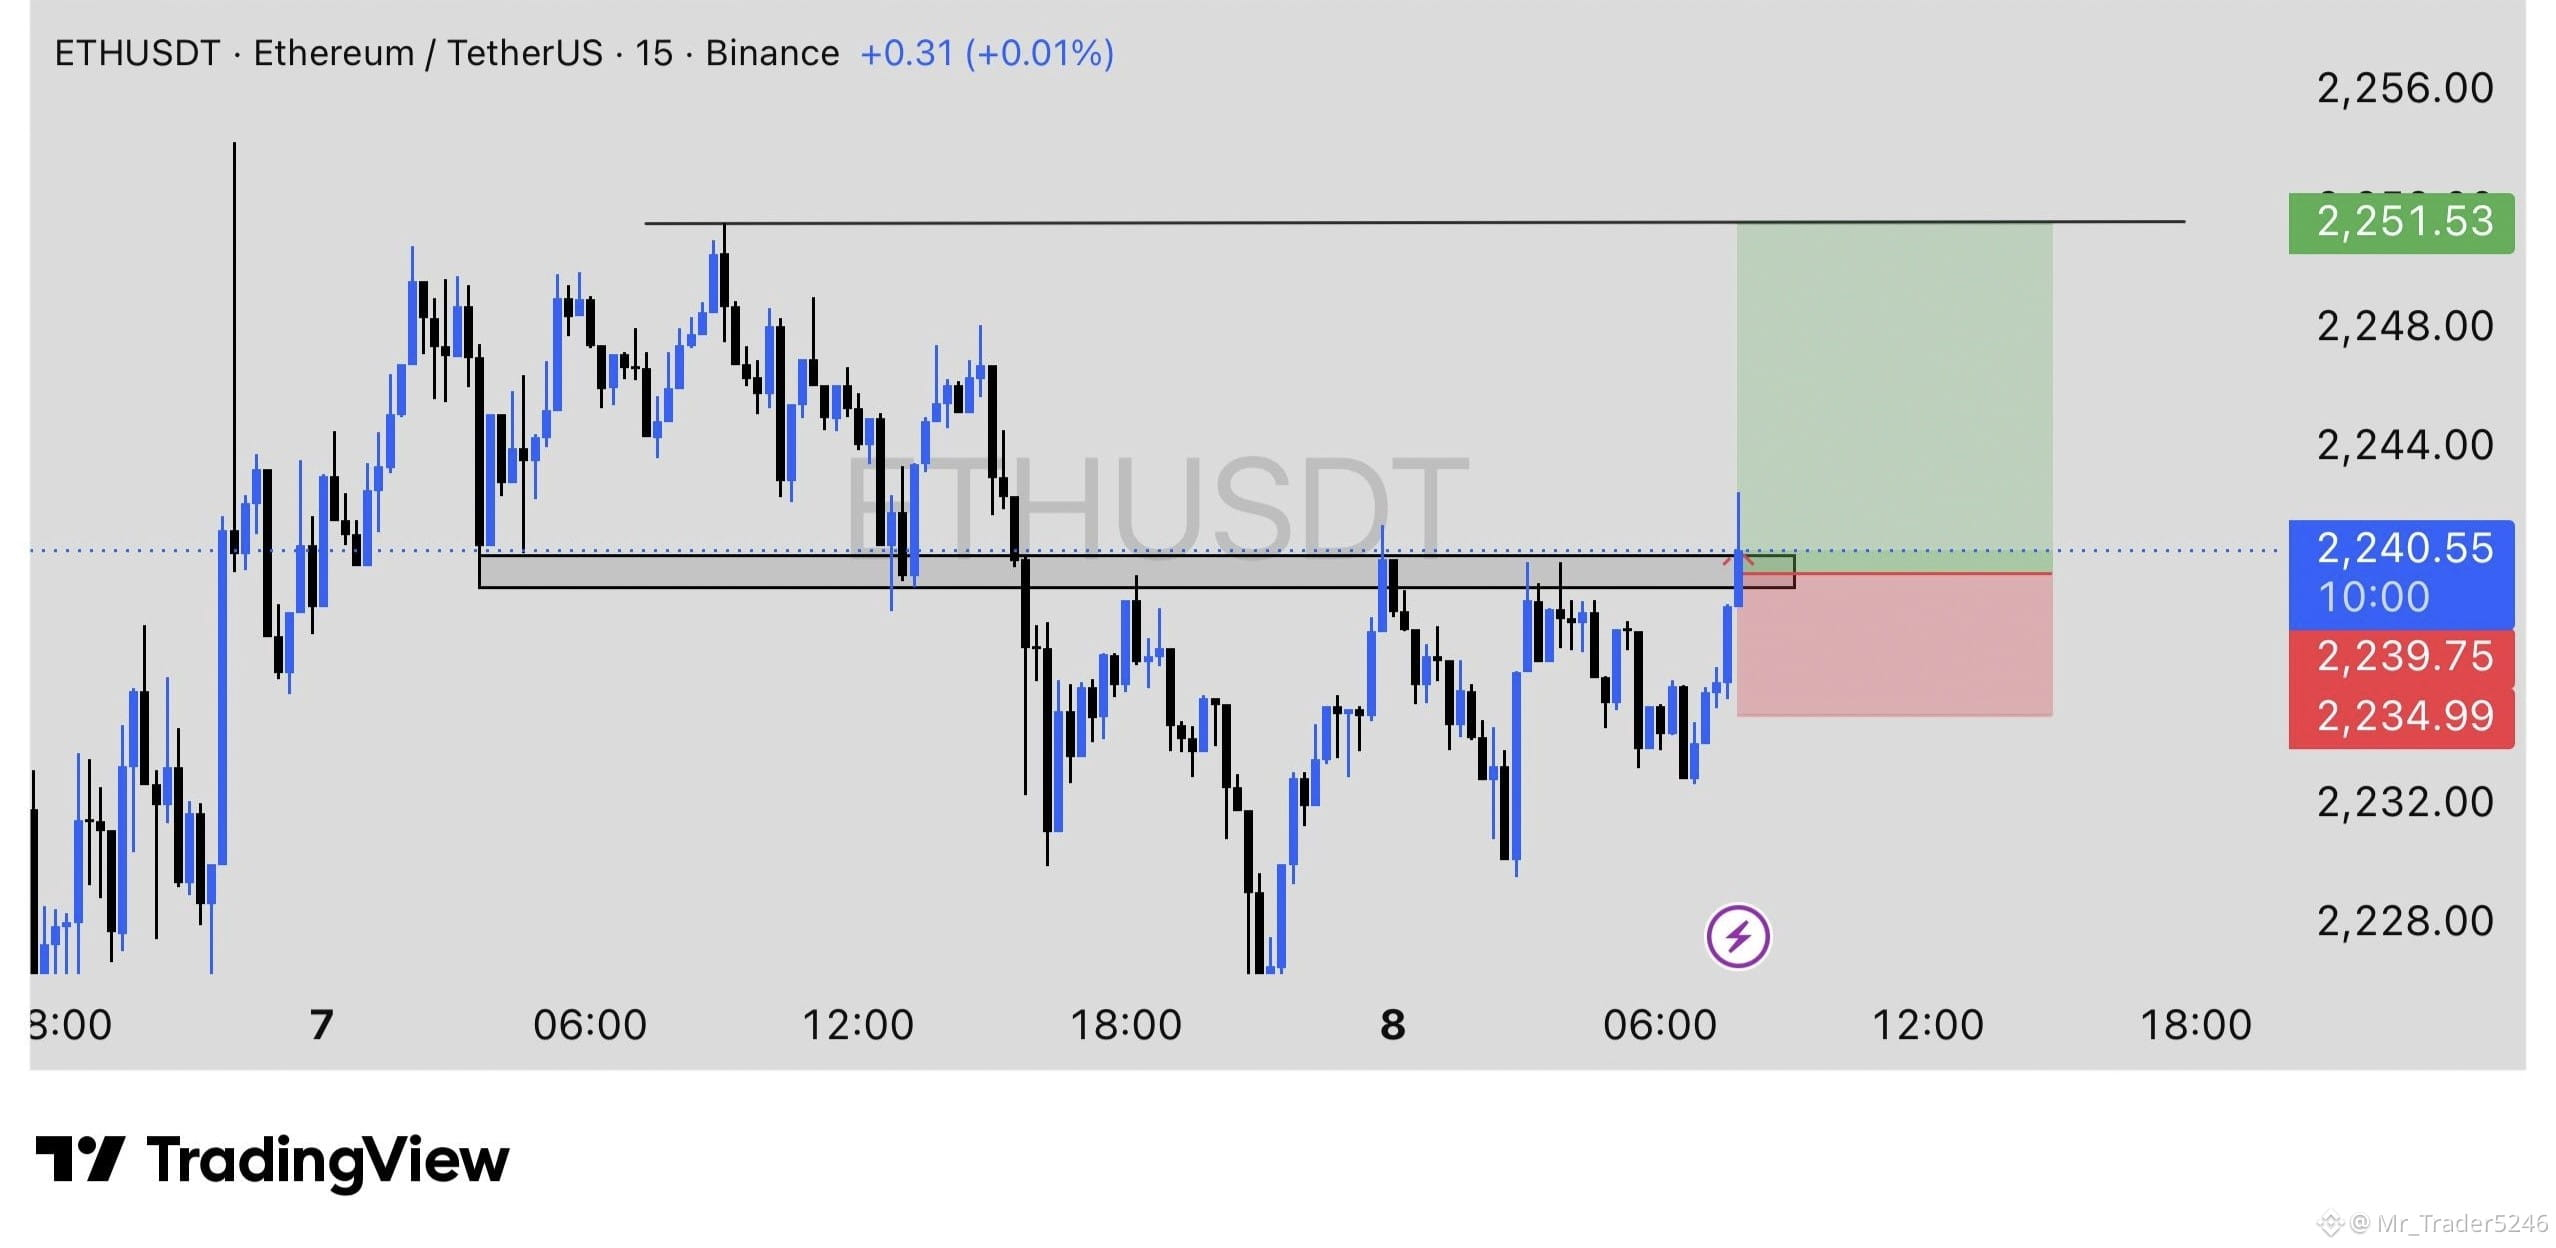
$ETH USDT — LONG Setup 📈
Entry Zone: $2,239.75 – $2,240.55
Take Profit Targets:
* TP1: $2,244.00
* TP2: $2,247.00
* TP3: $2,251.50
Stop Loss: $2,234.99
Reason for Trade: ETH is showing bullish momentum after reclaiming the $2,240 resistance zone. Buyers are attempting to push the price higher, and a successful breakout with a 15-minute candle close above this level could trigger further upside towards $2,251.
Confirmation: Wait for a 15-minute candle close above $2,240 before entering.
Trade here 👇
{future}(ETHUSDT)
$ETH USDT — LONG Setup 📈
Entry Zone: $2,239.75 – $2,240.55
Take Profit Targets:
* TP1: $2,244.00
* TP2: $2,247.00
* TP3: $2,251.50
Stop Loss: $2,234.99
Reason for Trade: ETH is showing bullish momentum after reclaiming the $2,240 resistance zone. Buyers are attempting to push the price higher, and a successful breakout with a 15-minute candle close above this level could trigger further upside towards $2,251.
Confirmation: Wait for a 15-minute candle close above $2,240 before entering.
Trade here 👇
Entry Zone: $2,239.75 – $2,240.55
Take Profit Targets:
* TP1: $2,244.00
* TP2: $2,247.00
* TP3: $2,251.50
Stop Loss: $2,234.99
Reason for Trade: ETH is showing bullish momentum after reclaiming the $2,240 resistance zone. Buyers are attempting to push the price higher, and a successful breakout with a 15-minute candle close above this level could trigger further upside towards $2,251.
Confirmation: Wait for a 15-minute candle close above $2,240 before entering.
Trade here 👇
2
18
Tərcüməyə bax
$KOMA USDT — SHORT Setup 📉
Entry Zone: $0.02240 – $0.02260
Take Profit Targets:
* TP1: $0.02150
* TP2: $0.02050
* TP3: $0.01950
* TP4: $0.01855
Stop Loss: $0.02410
$KOMA USDT — SHORT Setup 📉
Entry Zone: $0.02240 – $0.02260
Take Profit Targets:
* TP1: $0.02150
* TP2: $0.02050
* TP3: $0.01950
* TP4: $0.01855
Stop Loss: $0.02410
Entry Zone: $0.02240 – $0.02260
Take Profit Targets:
* TP1: $0.02150
* TP2: $0.02050
* TP3: $0.01950
* TP4: $0.01855
Stop Loss: $0.02410
2
131
·
--
Azalma
Tərcüməyə bax
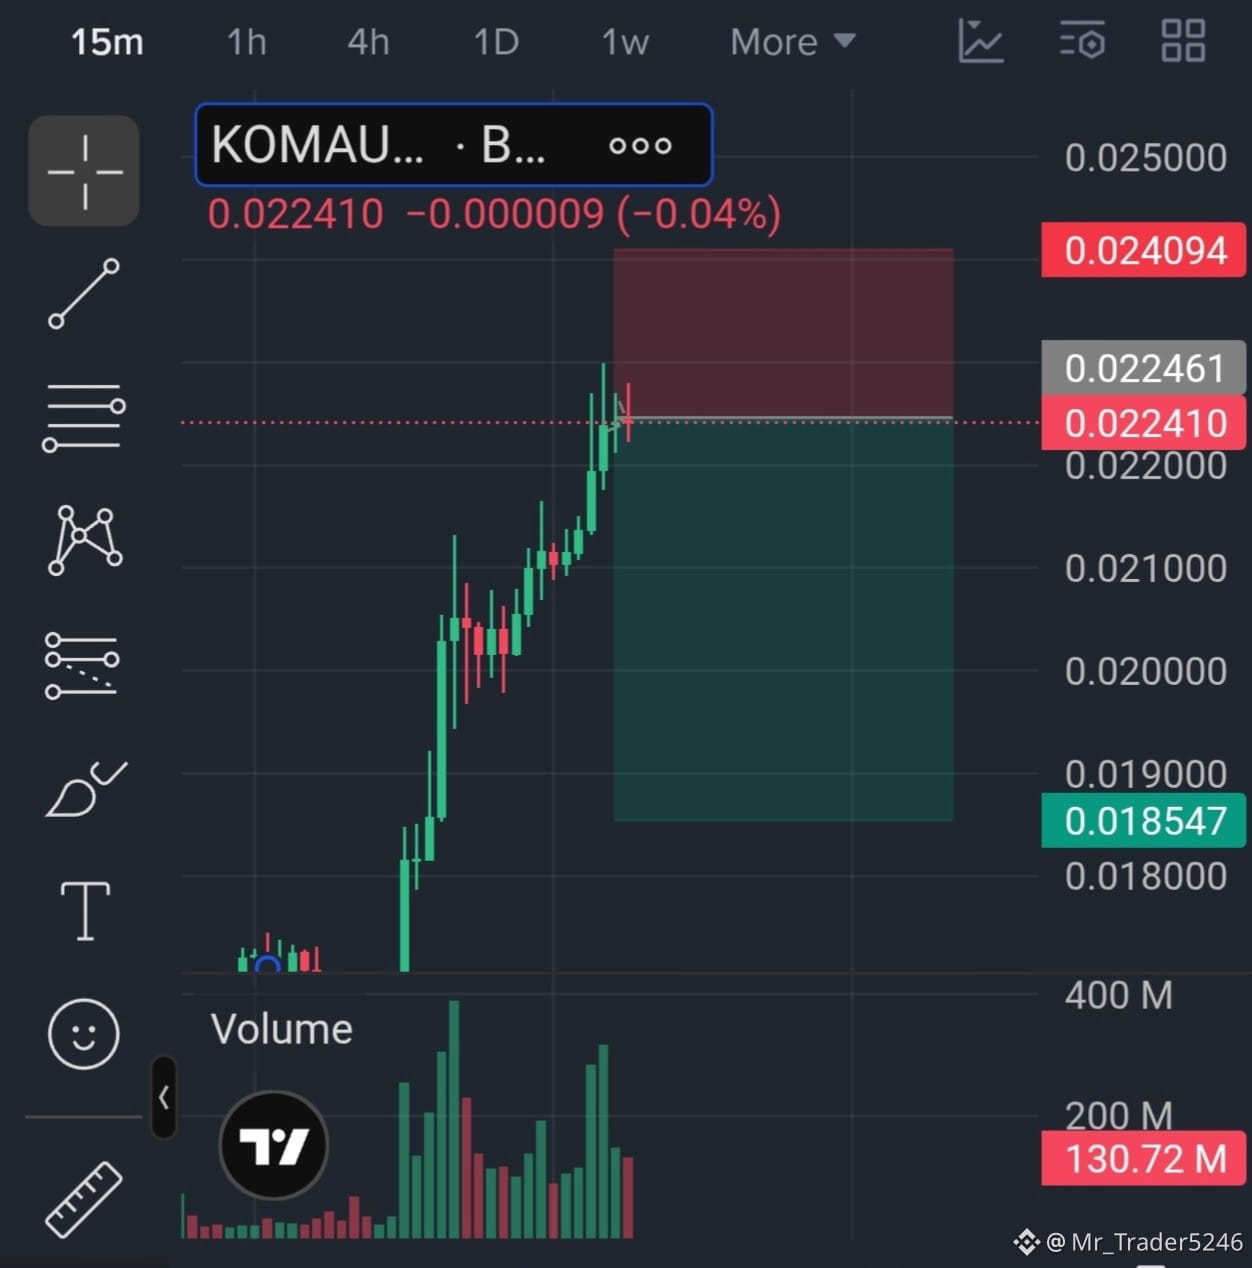
$KOMA USDT — SHORT Setup 📉
Entry Zone: $0.02240 – $0.02260
Take Profit Targets:
* TP1: $0.02150
* TP2: $0.02050
* TP3: $0.01950
* TP4: $0.01855
Stop Loss: $0.02410
Reason for Short:
* Price has already pumped more than 73%, making a short-term correction possible.
* Strong selling pressure may appear near the $0.0225–$0.0230 resistance zone.
* After such a sharp upward move, profit booking can trigger a pullback.
* Volume is elevated, so volatility may remain high.
Confirmation: Wait for a 15-minute bearish candle close before entering.
Trade here 👇
{future}(KOMAUSDT)
$KOMA USDT — SHORT Setup 📉
Entry Zone: $0.02240 – $0.02260
Take Profit Targets:
* TP1: $0.02150
* TP2: $0.02050
* TP3: $0.01950
* TP4: $0.01855
Stop Loss: $0.02410
Reason for Short:
* Price has already pumped more than 73%, making a short-term correction possible.
* Strong selling pressure may appear near the $0.0225–$0.0230 resistance zone.
* After such a sharp upward move, profit booking can trigger a pullback.
* Volume is elevated, so volatility may remain high.
Confirmation: Wait for a 15-minute bearish candle close before entering.
Trade here 👇
Entry Zone: $0.02240 – $0.02260
Take Profit Targets:
* TP1: $0.02150
* TP2: $0.02050
* TP3: $0.01950
* TP4: $0.01855
Stop Loss: $0.02410
Reason for Short:
* Price has already pumped more than 73%, making a short-term correction possible.
* Strong selling pressure may appear near the $0.0225–$0.0230 resistance zone.
* After such a sharp upward move, profit booking can trigger a pullback.
* Volume is elevated, so volatility may remain high.
Confirmation: Wait for a 15-minute bearish candle close before entering.
Trade here 👇
1
3
174
Daha çox kontent araşdırmaq üçün daxil olun
Binance Square-də qlobal kriptovalyuta istifadəçilərinə qoşulun
⚡️ Kriptovalyuta haqqında ən son və faydalı məlumatları əldə edin.
💬 Dünyanın ən böyük kriptovalyuta birjası tərəfindən etibar edilir.
👍 Doğrulanmış yaradıcılardan gələn real məlumatları kəşf edin.
E-poçt/Telefon nömrəsi
Trenddə olan mövzular
BinanceReopensWithdrawalsForHYPE&APT
84,988 baxış
Müzakirə edir: 979
Binance HYPE və APT üçün vəsait çıxarışlarını yenidən aktivləşdirir, bərpa olunan aktivlərin siyahısını genişləndirir
Binance News
·32 bəyənmə
·26.6k baxış
SouthKoreaDraftLawTargets15To20%ShareholderCap
86,036 baxış
Müzakirə edir: 643
TradFiForBeginners
182,538 baxış
Müzakirə edir: 1,848