
MOBIN CRYPTOX
926 Paylaşımlar

MOBIN CRYPTOX
Şikayət et
İstifadəçini blokla
Crypto and Gold Market Analysis Bitcoin ETH XAUUSD Technical Analysis Market Research
Açıq ticarət
Daimi treyder
1.1 il
30 İzlənilir
777 İzləyicilər
337 Bəyəndi
Postlar
Portfel
Hamısı
Sitatlar
·
--
Azalma
Tərcüməyə bax
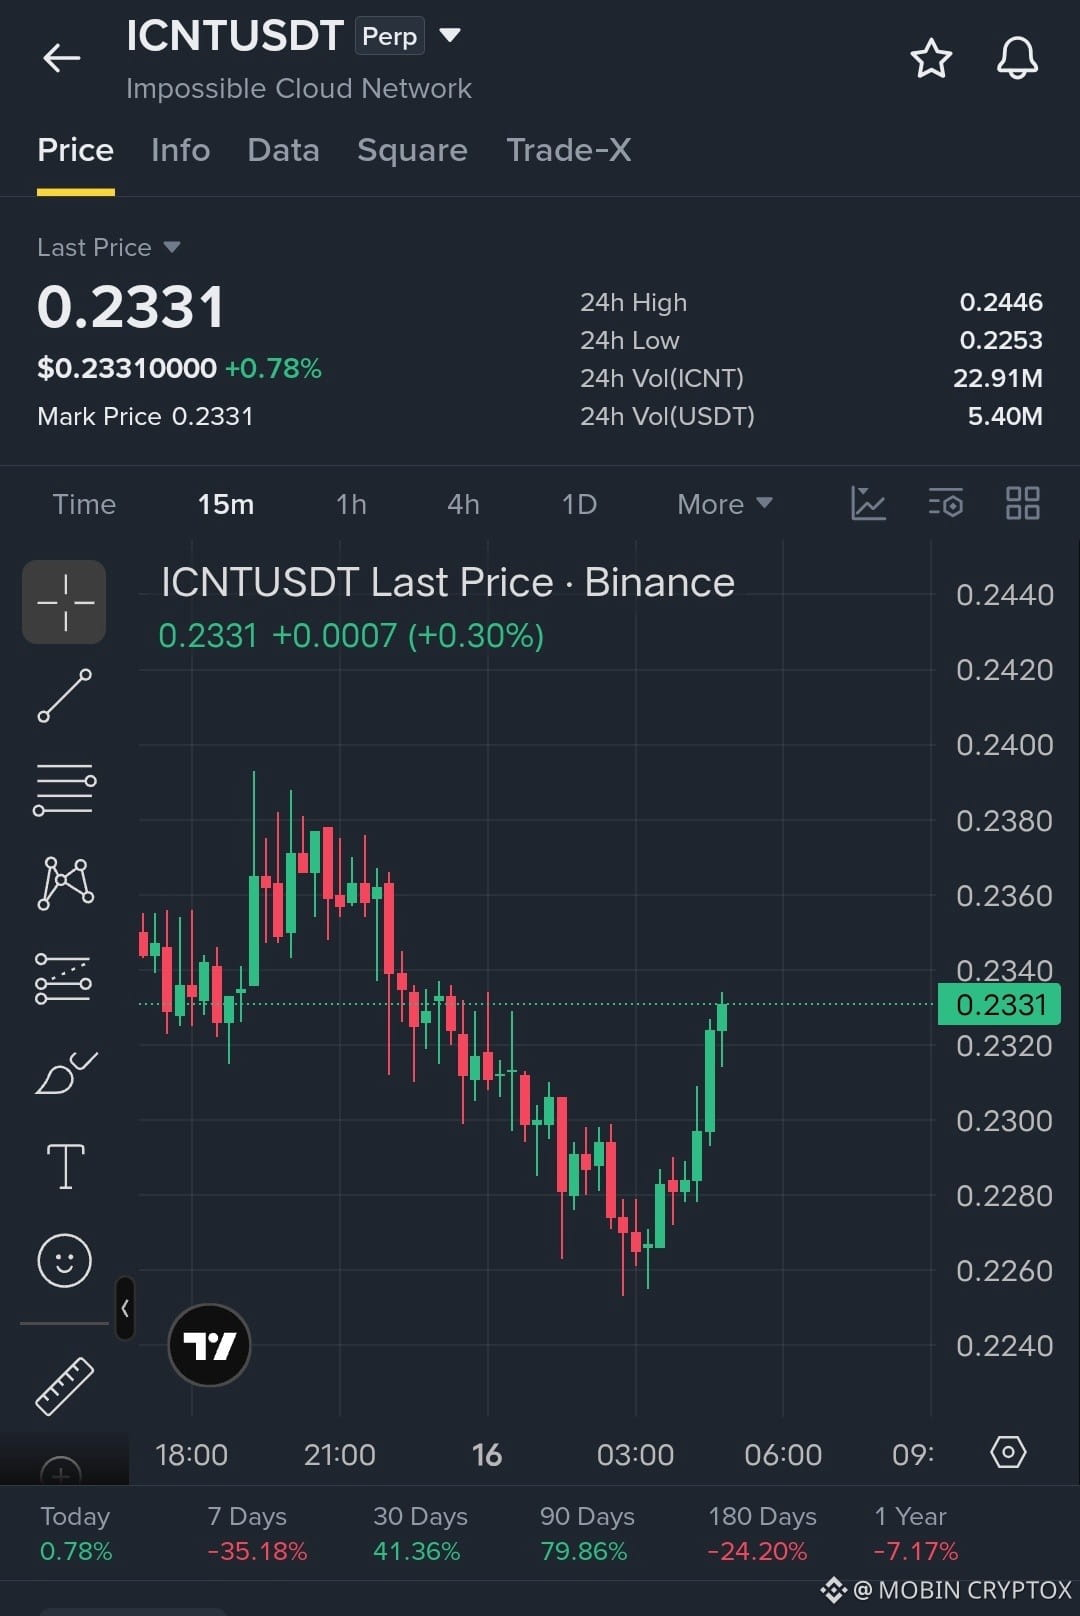
$ICNT ICNTUSDT: Recovery Begins or Just a Temporary Bounce?
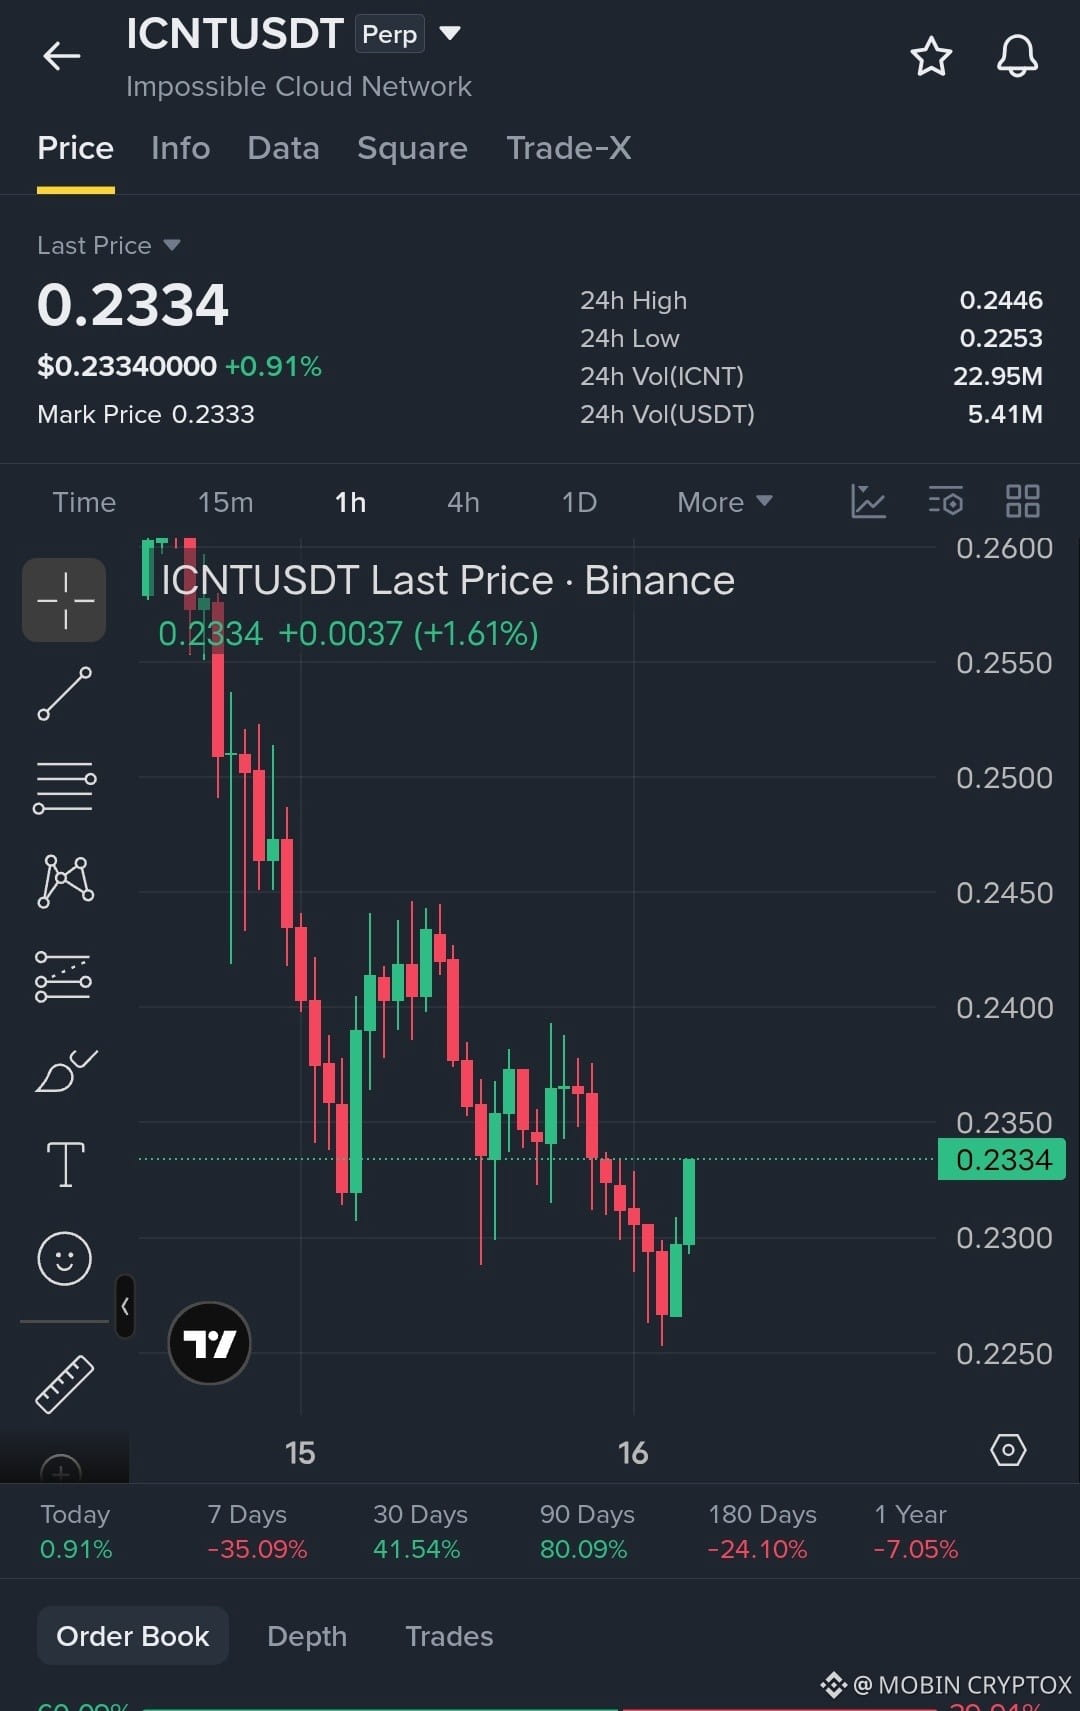
ICNT is showing a short-term rebound after a strong decline. Buyers are pushing price toward $0.2334, but the 1H trend remains bearish.$ICNT
📊 Key Levels 🟢 Support: $0.2300 – $0.2260 🔴 Resistance: $0.2360 – $0.2400
📈 Bullish Targets: $0.2380 → $0.2440
📉 Bearish Targets: $0.2280 → $0.2250
Trading Setup (Conditional)
Long entry: Above $0.2360 after confirmation
Long stop-loss: $0.2300
Short entry: Below $0.2280 after confirmation
Short stop-loss: $0.2340
💡 My View: A recovery is developing on the 15-minute chart, but buyers must break resistance to confirm stronger momentum.
🔥 Will ICNT reach $0.2440 or fall below $0.2280?
#ICNT #CryptoAnalysis #Altcoins #BinanceSquare
Educational analysis only. Not financial advice. DYOR #BinanceSquareFamily $ICNT
{future}(ICNTUSDT)
$ICNT ICNTUSDT: Recovery Begins or Just a Temporary Bounce?
ICNT is showing a short-term rebound after a strong decline. Buyers are pushing price toward $0.2334, but the 1H trend remains bearish.$ICNT
📊 Key Levels 🟢 Support: $0.2300 – $0.2260 🔴 Resistance: $0.2360 – $0.2400
📈 Bullish Targets: $0.2380 → $0.2440
📉 Bearish Targets: $0.2280 → $0.2250
Trading Setup (Conditional)
Long entry: Above $0.2360 after confirmation
Long stop-loss: $0.2300
Short entry: Below $0.2280 after confirmation
Short stop-loss: $0.2340
💡 My View: A recovery is developing on the 15-minute chart, but buyers must break resistance to confirm stronger momentum.
🔥 Will ICNT reach $0.2440 or fall below $0.2280?
#ICNT #CryptoAnalysis #Altcoins #BinanceSquare
Educational analysis only. Not financial advice. DYOR #BinanceSquareFamily $ICNT
ICNT is showing a short-term rebound after a strong decline. Buyers are pushing price toward $0.2334, but the 1H trend remains bearish.$ICNT
📊 Key Levels 🟢 Support: $0.2300 – $0.2260 🔴 Resistance: $0.2360 – $0.2400
📈 Bullish Targets: $0.2380 → $0.2440
📉 Bearish Targets: $0.2280 → $0.2250
Trading Setup (Conditional)
Long entry: Above $0.2360 after confirmation
Long stop-loss: $0.2300
Short entry: Below $0.2280 after confirmation
Short stop-loss: $0.2340
💡 My View: A recovery is developing on the 15-minute chart, but buyers must break resistance to confirm stronger momentum.
🔥 Will ICNT reach $0.2440 or fall below $0.2280?
#ICNT #CryptoAnalysis #Altcoins #BinanceSquare
Educational analysis only. Not financial advice. DYOR #BinanceSquareFamily $ICNT
33
·
--
Azalma
Tərcüməyə bax
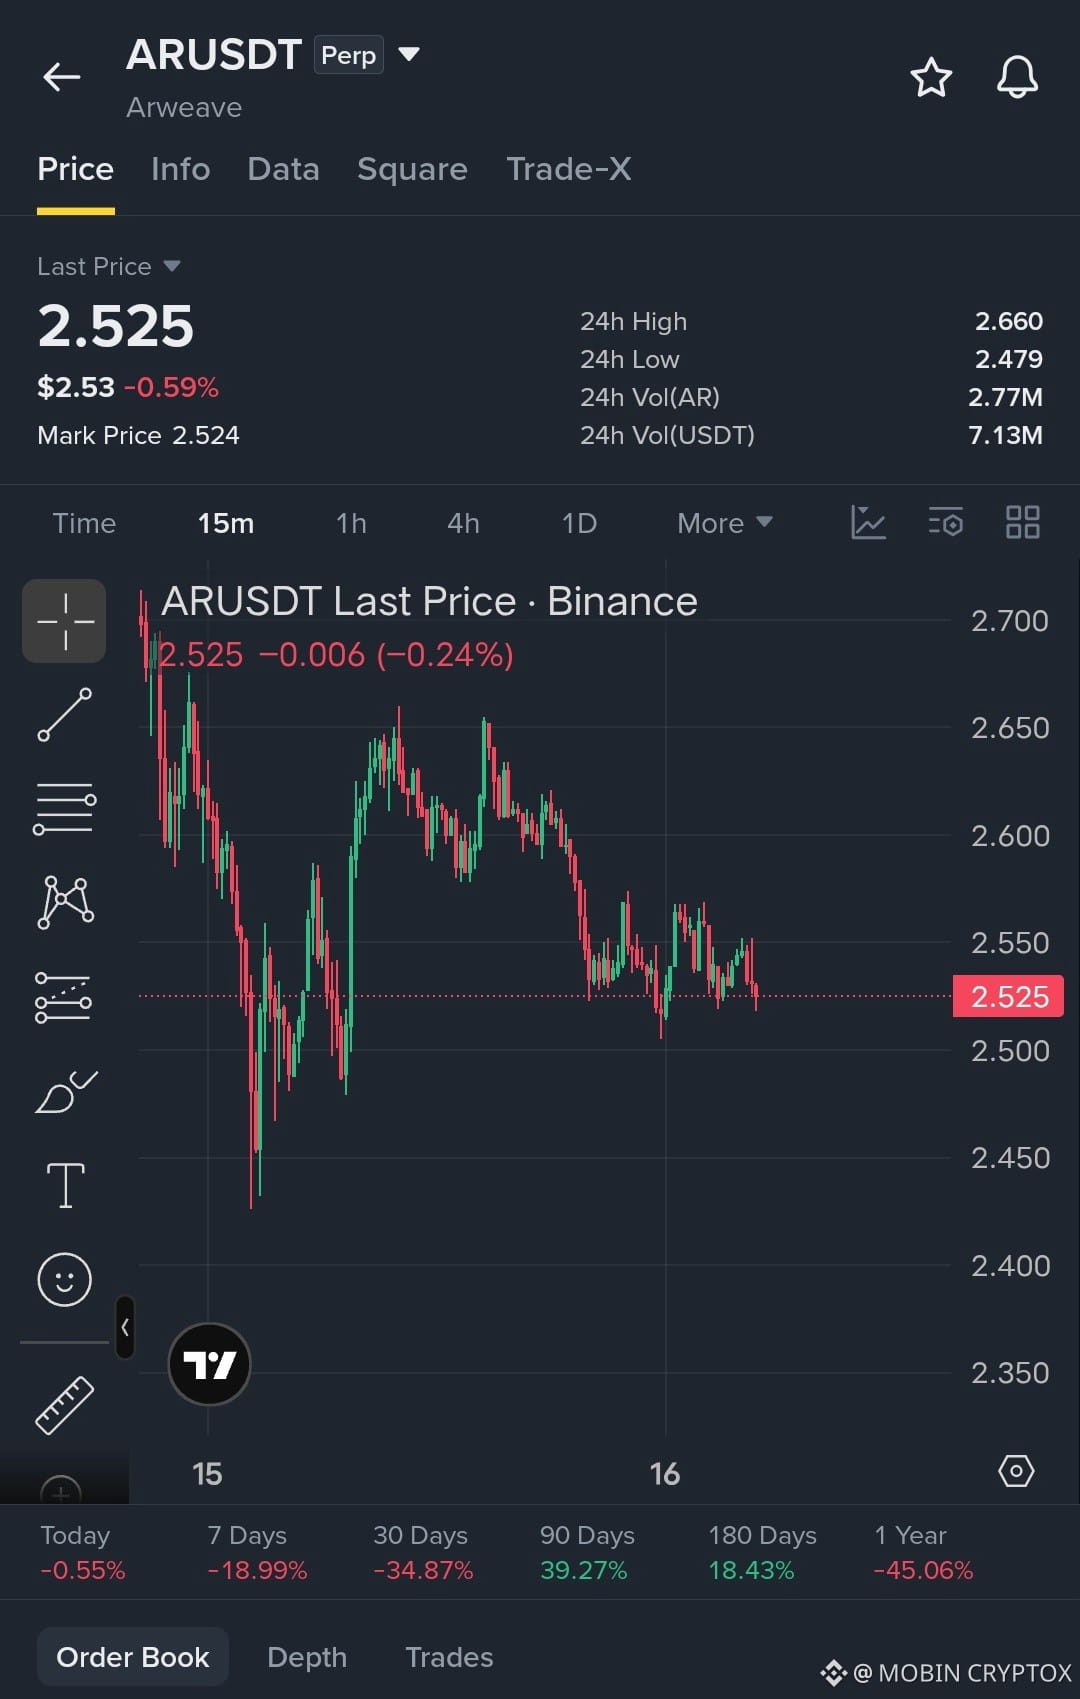
$AR ARWEAVE (AR) AT $2.52 — BREAKDOWN OR RECOVERY AHEAD
{future}(ARUSDT)
Arweave is showing short-term weakness after a prolonged decline. Buyers are attempting to stabilize the price around $2.52, but selling pressure remains visible.
📊 Key Levels 🟢 Support: $2.50 – $2.48 🔴 Resistance: $2.55 – $2.60
📈 Bullish Scenario: A confirmed breakout above $2.55 could open the way toward $2.60.
📉 Bearish Scenario: A breakdown below $2.48 could increase downside pressure.
🔍 What's Next? The market needs stronger buying volume before a recovery can be trusted. No confirmed reversal yet.
💬 Your Opinion: Will AR recover above $2.60, or will sellers push it lower?
#AR #Arweave #CryptoAnalysis #Altcoins #BinanceSquare
Educational market analysis, not financial advice. DYOR.
$AR
$AR ARWEAVE (AR) AT $2.52 — BREAKDOWN OR RECOVERY AHEAD
Arweave is showing short-term weakness after a prolonged decline. Buyers are attempting to stabilize the price around $2.52, but selling pressure remains visible.
📊 Key Levels 🟢 Support: $2.50 – $2.48 🔴 Resistance: $2.55 – $2.60
📈 Bullish Scenario: A confirmed breakout above $2.55 could open the way toward $2.60.
📉 Bearish Scenario: A breakdown below $2.48 could increase downside pressure.
🔍 What's Next? The market needs stronger buying volume before a recovery can be trusted. No confirmed reversal yet.
💬 Your Opinion: Will AR recover above $2.60, or will sellers push it lower?
#AR #Arweave #CryptoAnalysis #Altcoins #BinanceSquare
Educational market analysis, not financial advice. DYOR.
$AR
Arweave is showing short-term weakness after a prolonged decline. Buyers are attempting to stabilize the price around $2.52, but selling pressure remains visible.
📊 Key Levels 🟢 Support: $2.50 – $2.48 🔴 Resistance: $2.55 – $2.60
📈 Bullish Scenario: A confirmed breakout above $2.55 could open the way toward $2.60.
📉 Bearish Scenario: A breakdown below $2.48 could increase downside pressure.
🔍 What's Next? The market needs stronger buying volume before a recovery can be trusted. No confirmed reversal yet.
💬 Your Opinion: Will AR recover above $2.60, or will sellers push it lower?
#AR #Arweave #CryptoAnalysis #Altcoins #BinanceSquare
Educational market analysis, not financial advice. DYOR.
$AR
113

Məqalə
QIZIL TƏZYİQ ALTINDA! Bu, alış fürsətidir, yoxsa daha dərin korreksiyanın başlanğıcı?$XAU Qızıl həmişə təhlükəsiz sığınacaq aktivi hesab olunub. Amma qızıl belə güclü bazar qüvvələrinin təsirindən sığortalanmayıb.
Bu qiymətli metalın qiyməti son vaxtlar kəskin şəkildə ucuzlaşıb və bu, vacib bir sual doğurur: İnvestorlar qızıla olan inamlarını itirirlər, yoxsa bazar sadəcə yeni iqtisadi reallığa uyğunlaşır?
$XAU 📊 QIZIL BAZARINDA NƏ BAŞ VERİR?
Reuters-in məlumatına görə, 2026-cı il noyabrın 13-də spot qızılın bir unsiyası təxminən 3 879,71 dollara satılıb. Həftə ərzində qiymət təxminən 4,5% ucuzlaşıb.
Cümə axşamı baş verən kəskin satışlar zamanı qızılın qiyməti 3 852 dollara yaxın səviyyəyə də düşüb.
QIZIL TƏZYİQ ALTINDA! Bu, alış fürsətidir, yoxsa daha dərin korreksiyanın başlanğıcı?
$XAU Qızıl həmişə təhlükəsiz sığınacaq aktivi hesab olunub. Amma qızıl belə güclü bazar qüvvələrinin təsirindən sığortalanmayıb.
Bu qiymətli metalın qiyməti son vaxtlar kəskin şəkildə ucuzlaşıb və bu, vacib bir sual doğurur: İnvestorlar qızıla olan inamlarını itirirlər, yoxsa bazar sadəcə yeni iqtisadi reallığa uyğunlaşır?
$XAU 📊 QIZIL BAZARINDA NƏ BAŞ VERİR?
Reuters-in məlumatına görə, 2026-cı il noyabrın 13-də spot qızılın bir unsiyası təxminən 3 879,71 dollara satılıb. Həftə ərzində qiymət təxminən 4,5% ucuzlaşıb.
Cümə axşamı baş verən kəskin satışlar zamanı qızılın qiyməti 3 852 dollara yaxın səviyyəyə də düşüb.
Bu qiymətli metalın qiyməti son vaxtlar kəskin şəkildə ucuzlaşıb və bu, vacib bir sual doğurur: İnvestorlar qızıla olan inamlarını itirirlər, yoxsa bazar sadəcə yeni iqtisadi reallığa uyğunlaşır?
$XAU 📊 QIZIL BAZARINDA NƏ BAŞ VERİR?
Reuters-in məlumatına görə, 2026-cı il noyabrın 13-də spot qızılın bir unsiyası təxminən 3 879,71 dollara satılıb. Həftə ərzində qiymət təxminən 4,5% ucuzlaşıb.
Cümə axşamı baş verən kəskin satışlar zamanı qızılın qiyməti 3 852 dollara yaxın səviyyəyə də düşüb.
414
Tərcüməyə bax
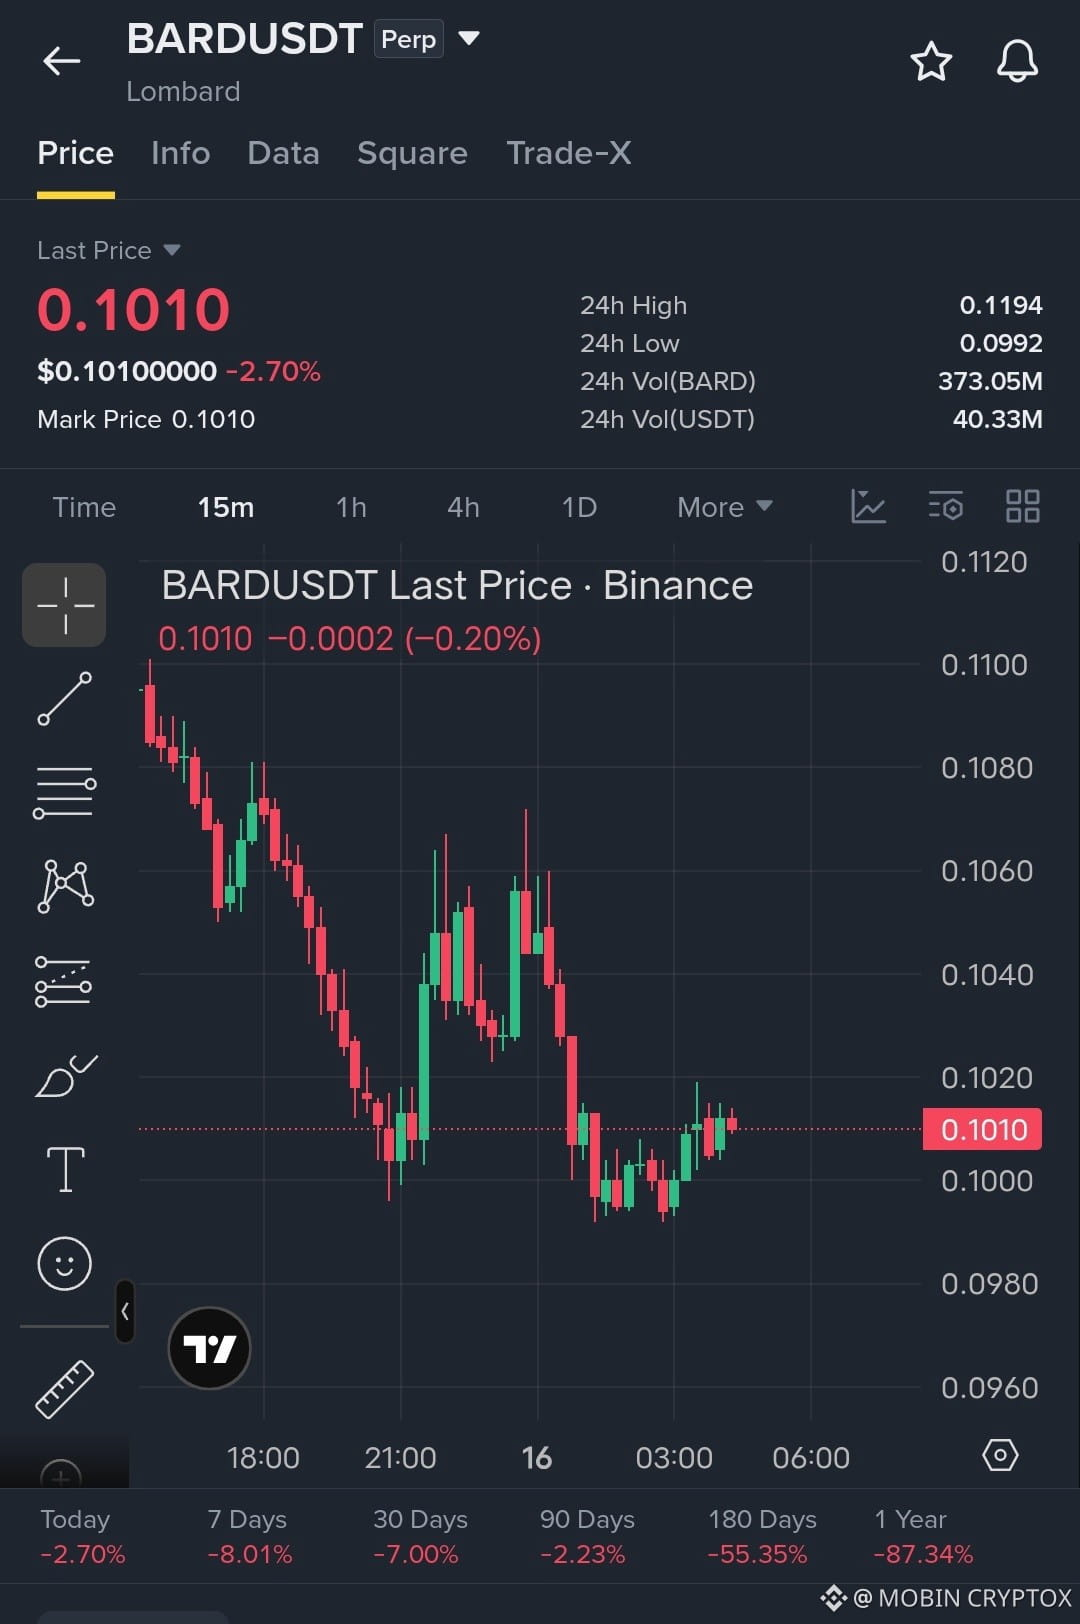
$BARD BARDUSDT: Is a Recovery Coming or More Downside Ahead?
{future}(BARDUSDT)
BARD is showing weakness after a prolonged decline. The latest candles indicate a small recovery, but buyers have not confirmed a trend reversal.
📊 Market Overview
Price: $0.1010
24H Change: -2.70%
24H High: $0.1194
24H Low: $0.0992
🔍 Key Technical Levels 🟢 Support: $0.1000–$0.0990 🔴 Resistance: $0.1020–$0.1040
📈 My Analysis: BARD is attempting to stabilize near $0.1010. A breakout above $0.1040 could improve short-term momentum.
However, a breakdown below $0.0990 could bring further selling pressure.
What do you think? Can BARD recover, or will sellers take control again?
#BARD #BARDUSDT #CryptoAnalysis #Altcoins #BinanceSquare
Educational analysis based on the supplied 15-minute chart. Not financial advice.
$BARD
$BARD BARDUSDT: Is a Recovery Coming or More Downside Ahead?
BARD is showing weakness after a prolonged decline. The latest candles indicate a small recovery, but buyers have not confirmed a trend reversal.
📊 Market Overview
Price: $0.1010
24H Change: -2.70%
24H High: $0.1194
24H Low: $0.0992
🔍 Key Technical Levels 🟢 Support: $0.1000–$0.0990 🔴 Resistance: $0.1020–$0.1040
📈 My Analysis: BARD is attempting to stabilize near $0.1010. A breakout above $0.1040 could improve short-term momentum.
However, a breakdown below $0.0990 could bring further selling pressure.
What do you think? Can BARD recover, or will sellers take control again?
#BARD #BARDUSDT #CryptoAnalysis #Altcoins #BinanceSquare
Educational analysis based on the supplied 15-minute chart. Not financial advice.
$BARD
BARD is showing weakness after a prolonged decline. The latest candles indicate a small recovery, but buyers have not confirmed a trend reversal.
📊 Market Overview
Price: $0.1010
24H Change: -2.70%
24H High: $0.1194
24H Low: $0.0992
🔍 Key Technical Levels 🟢 Support: $0.1000–$0.0990 🔴 Resistance: $0.1020–$0.1040
📈 My Analysis: BARD is attempting to stabilize near $0.1010. A breakout above $0.1040 could improve short-term momentum.
However, a breakdown below $0.0990 could bring further selling pressure.
What do you think? Can BARD recover, or will sellers take control again?
#BARD #BARDUSDT #CryptoAnalysis #Altcoins #BinanceSquare
Educational analysis based on the supplied 15-minute chart. Not financial advice.
$BARD
145
Məqalə
Tərcüməyə bax
BITCOIN: The Calm Before the Next Big Move? What Are Smart Investors Watching?Bitcoin is more than just a cryptocurrency. It is a market driven by psychology, liquidity, institutional money and investor confidence.
But here's an important question:
When Bitcoin suddenly drops, is it the end of the rally—or an opportunity for a new beginning?
Let's explore 5 things every Bitcoin investor should understand.
📊 1. The Battle Between Buyers and Sellers
Every Bitcoin price movement tells a story.
When buyers become stronger, prices can move higher. When sellers dominate, downward pressure increases.
The important thing isn't simply watching green and red candles. It's understanding WHY the price is moving.
🐋 2. What Are Bitcoin Whales Doing?
Large Bitcoin holders can influence market liquidity and sentiment.
Investors often monitor:$BTC
Large wallet transactions.Exchange inflows and outflows.Institutional Bitcoin purchases.Changes in long-term holder behaviour.
However, a large transaction doesn't automatically mean buying or selling pressure.
📉 3. Why Market Corrections Matter
Many investors become emotional when Bitcoin falls.
But corrections are part of volatile financial markets.
Instead of immediately assuming a recovery, examine:
Important support levels.Resistance zones.Trading volume.Market momentum
A recovery needs confirmation, not just hope.
🏦 4. Institutional Money Changes the Conversation
Bitcoin ETFs and institutional participation have created additional ways for traditional investors to gain exposure to Bitcoin.
But institutional interest doesn't guarantee higher prices.
Liquidity, economic conditions and investor sentiment still matter.
🔥 5. The Most Important Thing: Risk Management
You don't need to predict every Bitcoin movement to become a better investor.
Understand your risk.
Avoid emotional decisions.
Be careful with leverage.
Never invest money you cannot afford to lose.
💭 My Final Thought
Bitcoin's next major move will create opportunities and risks.
The real question isn't whether Bitcoin will go up or down tomorrow.
The real question is: Are you prepared for both possibilities?
👇 Let's discuss!
What do you think will drive Bitcoin's next major move?
1️⃣ Institutional investment
2️⃣ Bitcoin supply and demand
3️⃣ Global economic conditions
4️⃣ Market psychology
Share your opinion in the comments!
#bitcoin #BTC走势分析 #CryptoMarket #BitcoinAnalysis #Binance $BTC $BTC
BITCOIN: The Calm Before the Next Big Move? What Are Smart Investors Watching?
Bitcoin is more than just a cryptocurrency. It is a market driven by psychology, liquidity, institutional money and investor confidence.
But here's an important question:
When Bitcoin suddenly drops, is it the end of the rally—or an opportunity for a new beginning?
Let's explore 5 things every Bitcoin investor should understand.
📊 1. The Battle Between Buyers and Sellers
Every Bitcoin price movement tells a story.
When buyers become stronger, prices can move higher. When sellers dominate, downward pressure increases.
The important thing isn't simply watching green and red candles. It's understanding WHY the price is moving.
🐋 2. What Are Bitcoin Whales Doing?
Large Bitcoin holders can influence market liquidity and sentiment.
Investors often monitor:$BTC
Large wallet transactions.Exchange inflows and outflows.Institutional Bitcoin purchases.Changes in long-term holder behaviour.
However, a large transaction doesn't automatically mean buying or selling pressure.
📉 3. Why Market Corrections Matter
Many investors become emotional when Bitcoin falls.
But corrections are part of volatile financial markets.
Instead of immediately assuming a recovery, examine:
Important support levels.Resistance zones.Trading volume.Market momentum
A recovery needs confirmation, not just hope.
🏦 4. Institutional Money Changes the Conversation
Bitcoin ETFs and institutional participation have created additional ways for traditional investors to gain exposure to Bitcoin.
But institutional interest doesn't guarantee higher prices.
Liquidity, economic conditions and investor sentiment still matter.
🔥 5. The Most Important Thing: Risk Management
You don't need to predict every Bitcoin movement to become a better investor.
Understand your risk.
Avoid emotional decisions.
Be careful with leverage.
Never invest money you cannot afford to lose.
💭 My Final Thought
Bitcoin's next major move will create opportunities and risks.
The real question isn't whether Bitcoin will go up or down tomorrow.
The real question is: Are you prepared for both possibilities?
👇 Let's discuss!
What do you think will drive Bitcoin's next major move?
1️⃣ Institutional investment
2️⃣ Bitcoin supply and demand
3️⃣ Global economic conditions
4️⃣ Market psychology
Share your opinion in the comments!
#bitcoin #BTC走势分析 #CryptoMarket #BitcoinAnalysis #Binance $BTC $BTC
But here's an important question:
When Bitcoin suddenly drops, is it the end of the rally—or an opportunity for a new beginning?
Let's explore 5 things every Bitcoin investor should understand.
📊 1. The Battle Between Buyers and Sellers
Every Bitcoin price movement tells a story.
When buyers become stronger, prices can move higher. When sellers dominate, downward pressure increases.
The important thing isn't simply watching green and red candles. It's understanding WHY the price is moving.
🐋 2. What Are Bitcoin Whales Doing?
Large Bitcoin holders can influence market liquidity and sentiment.
Investors often monitor:$BTC
Large wallet transactions.Exchange inflows and outflows.Institutional Bitcoin purchases.Changes in long-term holder behaviour.
However, a large transaction doesn't automatically mean buying or selling pressure.
📉 3. Why Market Corrections Matter
Many investors become emotional when Bitcoin falls.
But corrections are part of volatile financial markets.
Instead of immediately assuming a recovery, examine:
Important support levels.Resistance zones.Trading volume.Market momentum
A recovery needs confirmation, not just hope.
🏦 4. Institutional Money Changes the Conversation
Bitcoin ETFs and institutional participation have created additional ways for traditional investors to gain exposure to Bitcoin.
But institutional interest doesn't guarantee higher prices.
Liquidity, economic conditions and investor sentiment still matter.
🔥 5. The Most Important Thing: Risk Management
You don't need to predict every Bitcoin movement to become a better investor.
Understand your risk.
Avoid emotional decisions.
Be careful with leverage.
Never invest money you cannot afford to lose.
💭 My Final Thought
Bitcoin's next major move will create opportunities and risks.
The real question isn't whether Bitcoin will go up or down tomorrow.
The real question is: Are you prepared for both possibilities?
👇 Let's discuss!
What do you think will drive Bitcoin's next major move?
1️⃣ Institutional investment
2️⃣ Bitcoin supply and demand
3️⃣ Global economic conditions
4️⃣ Market psychology
Share your opinion in the comments!
#bitcoin #BTC走势分析 #CryptoMarket #BitcoinAnalysis #Binance $BTC $BTC
90
·
--
Azalma
Tərcüməyə bax
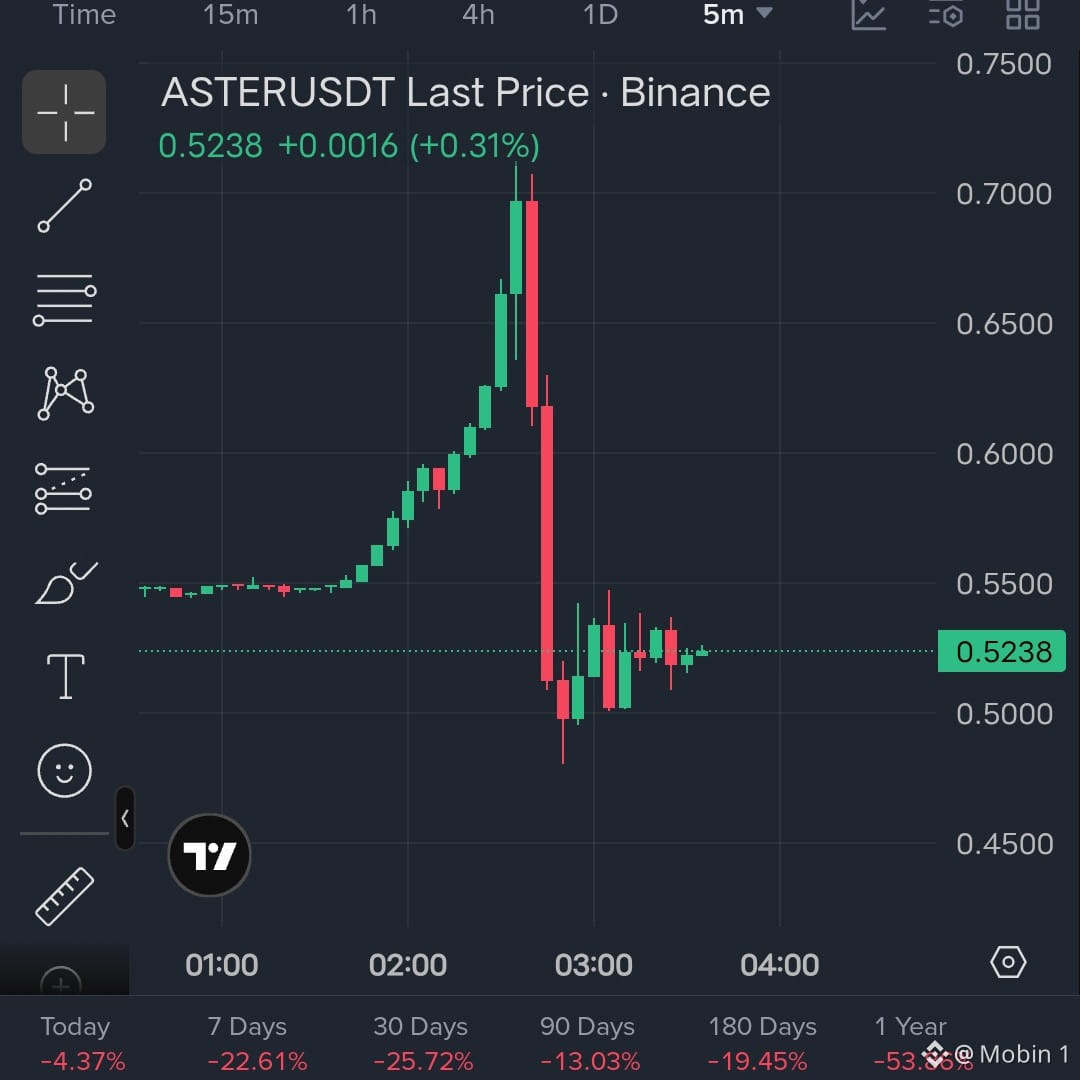
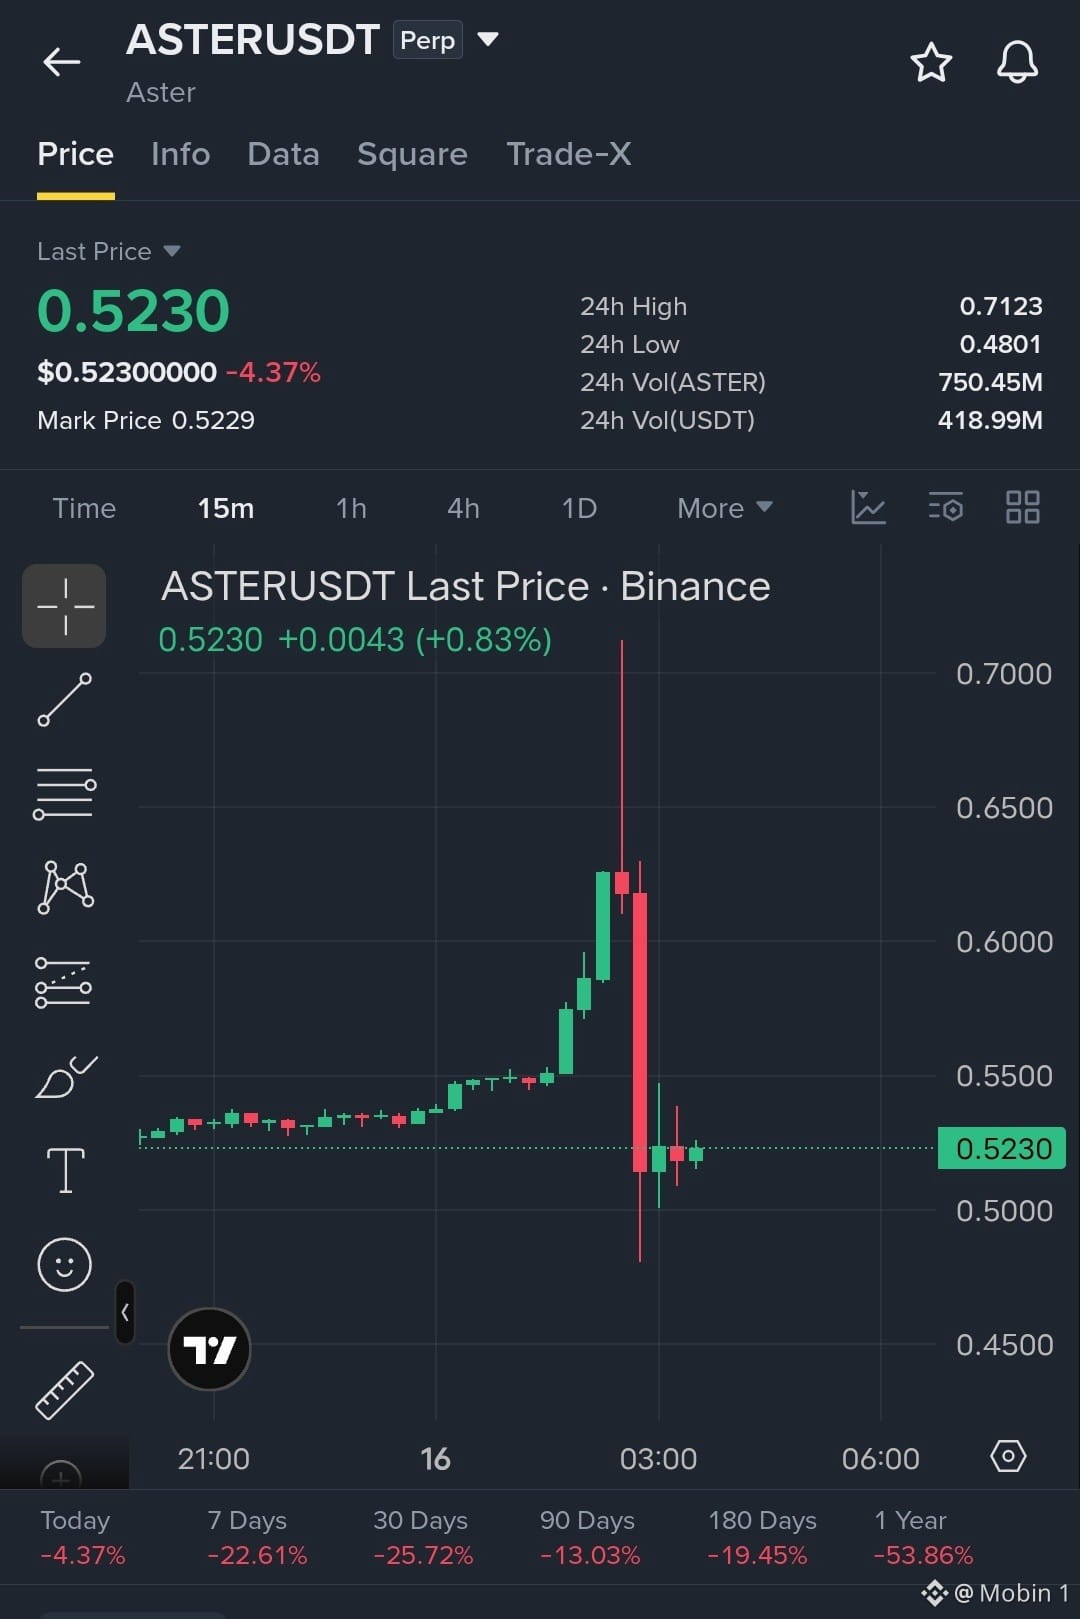
$ASTER 📉 ASTER/USDT: Sharp Rejection After Massive Rally!
ASTER surged to $0.7123 before experiencing a sharp sell-off to $0.4801.
Market Overview
Current price: $0.5230
24h change: -4.37%
24h high: $0.7123
24h low: $0.4801
Technical Analysis 🔴 Resistance: $0.5500–$0.6000
🟢 Support: $0.5000 and $0.4800
My View: ASTER is consolidating around $0.52 after a strong correction. Buyers need to regain momentum to challenge resistance.
A break below $0.50 could increase downside pressure.
What do you think? Will ASTER recover or drop further?
#ASTER #ASTERUSDT #CryptoAnalysis #BinanceSquare
Educational analysis based on the supplied chart. Not financial advice.
$ASTER $BTC
{future}(ASTERUSDT)
$ASTER 📉 ASTER/USDT: Sharp Rejection After Massive Rally!
ASTER surged to $0.7123 before experiencing a sharp sell-off to $0.4801.
Market Overview
Current price: $0.5230
24h change: -4.37%
24h high: $0.7123
24h low: $0.4801
Technical Analysis 🔴 Resistance: $0.5500–$0.6000
🟢 Support: $0.5000 and $0.4800
My View: ASTER is consolidating around $0.52 after a strong correction. Buyers need to regain momentum to challenge resistance.
A break below $0.50 could increase downside pressure.
What do you think? Will ASTER recover or drop further?
#ASTER #ASTERUSDT #CryptoAnalysis #BinanceSquare
Educational analysis based on the supplied chart. Not financial advice.
$ASTER $BTC
ASTER surged to $0.7123 before experiencing a sharp sell-off to $0.4801.
Market Overview
Current price: $0.5230
24h change: -4.37%
24h high: $0.7123
24h low: $0.4801
Technical Analysis 🔴 Resistance: $0.5500–$0.6000
🟢 Support: $0.5000 and $0.4800
My View: ASTER is consolidating around $0.52 after a strong correction. Buyers need to regain momentum to challenge resistance.
A break below $0.50 could increase downside pressure.
What do you think? Will ASTER recover or drop further?
#ASTER #ASTERUSDT #CryptoAnalysis #BinanceSquare
Educational analysis based on the supplied chart. Not financial advice.
$ASTER $BTC
531
Tərcüməyə bax
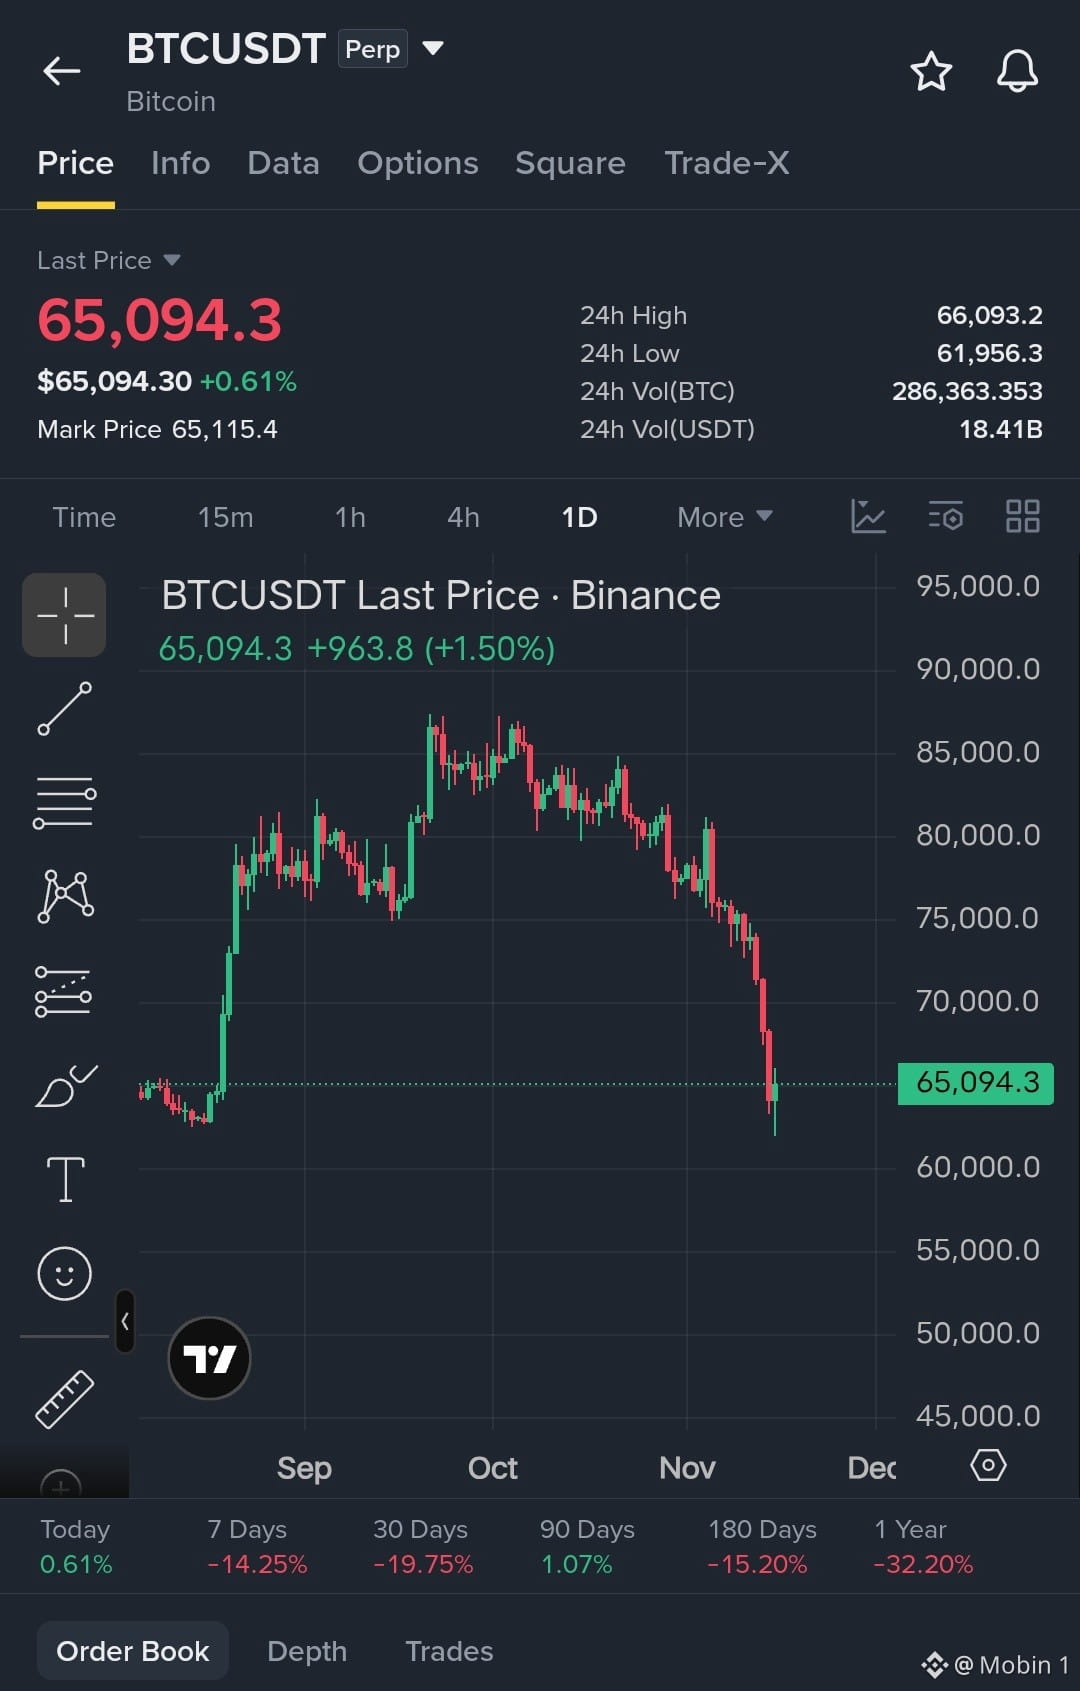
$BTC 📉 BITCOIN MARKET ANALYSIS: Is This a Real Recovery or Just a Temporary Bounce?
Bitcoin is showing a small recovery after a sharp decline. However, the bigger picture still deserves attention.
1 Overall Trend
Bitcoin has formed lower highs and lower lows on the visible daily chart. This suggests that sellers have maintained control over the broader trend.
2. Important Support
The $61,950–$62,000 area is an important level to monitor because the recent decline reached this region before bouncing.
If price breaks below this area and fails to recover, further downside pressure could develop.
3. Important Resistance
The $66,000–$66,100 region is the first level I would watch.
A daily close above this area, followed by a successful retest, could indicate improving buying strength.
📈 Two Possible Scenarios
🟢 Bullish Scenario: Bitcoin reclaims $66,100 and starts forming higher highs. This could create an opportunity for a stronger recovery.
🔴 Bearish Scenario: Bitcoin gets rejected near resistance and loses the $61,950 support area. This could indicate that sellers remain in control.
💭 My Personal View
I would avoid calling this a confirmed trend reversal based on one rebound.
I want to see stronger buying participation, a confirmed daily breakout and a successful retest before becoming more confident about a recovery.
Risk management matters more than predicting the exact bottom.
❓ What Do You Think?
Is Bitcoin preparing for a recovery, or could another correction be coming?
Share your analysis in the comments.
Follow me for more educational BTC market analysis.
#Bitcoin #BTC #BTCUSDT #CryptoAnalysis #TechnicalAnalysis #BinanceSquare
Disclaimer: Educational analysis based on the supplied chart. Not financial advice. Prices and market conditions may change.
{future}(BTCUSDT)
$BTC 📉 BITCOIN MARKET ANALYSIS: Is This a Real Recovery or Just a Temporary Bounce?
Bitcoin is showing a small recovery after a sharp decline. However, the bigger picture still deserves attention.
1 Overall Trend
Bitcoin has formed lower highs and lower lows on the visible daily chart. This suggests that sellers have maintained control over the broader trend.
2. Important Support
The $61,950–$62,000 area is an important level to monitor because the recent decline reached this region before bouncing.
If price breaks below this area and fails to recover, further downside pressure could develop.
3. Important Resistance
The $66,000–$66,100 region is the first level I would watch.
A daily close above this area, followed by a successful retest, could indicate improving buying strength.
📈 Two Possible Scenarios
🟢 Bullish Scenario: Bitcoin reclaims $66,100 and starts forming higher highs. This could create an opportunity for a stronger recovery.
🔴 Bearish Scenario: Bitcoin gets rejected near resistance and loses the $61,950 support area. This could indicate that sellers remain in control.
💭 My Personal View
I would avoid calling this a confirmed trend reversal based on one rebound.
I want to see stronger buying participation, a confirmed daily breakout and a successful retest before becoming more confident about a recovery.
Risk management matters more than predicting the exact bottom.
❓ What Do You Think?
Is Bitcoin preparing for a recovery, or could another correction be coming?
Share your analysis in the comments.
Follow me for more educational BTC market analysis.
#Bitcoin #BTC #BTCUSDT #CryptoAnalysis #TechnicalAnalysis #BinanceSquare
Disclaimer: Educational analysis based on the supplied chart. Not financial advice. Prices and market conditions may change.
Bitcoin is showing a small recovery after a sharp decline. However, the bigger picture still deserves attention.
1 Overall Trend
Bitcoin has formed lower highs and lower lows on the visible daily chart. This suggests that sellers have maintained control over the broader trend.
2. Important Support
The $61,950–$62,000 area is an important level to monitor because the recent decline reached this region before bouncing.
If price breaks below this area and fails to recover, further downside pressure could develop.
3. Important Resistance
The $66,000–$66,100 region is the first level I would watch.
A daily close above this area, followed by a successful retest, could indicate improving buying strength.
📈 Two Possible Scenarios
🟢 Bullish Scenario: Bitcoin reclaims $66,100 and starts forming higher highs. This could create an opportunity for a stronger recovery.
🔴 Bearish Scenario: Bitcoin gets rejected near resistance and loses the $61,950 support area. This could indicate that sellers remain in control.
💭 My Personal View
I would avoid calling this a confirmed trend reversal based on one rebound.
I want to see stronger buying participation, a confirmed daily breakout and a successful retest before becoming more confident about a recovery.
Risk management matters more than predicting the exact bottom.
❓ What Do You Think?
Is Bitcoin preparing for a recovery, or could another correction be coming?
Share your analysis in the comments.
Follow me for more educational BTC market analysis.
#Bitcoin #BTC #BTCUSDT #CryptoAnalysis #TechnicalAnalysis #BinanceSquare
Disclaimer: Educational analysis based on the supplied chart. Not financial advice. Prices and market conditions may change.
70
·
--
Artım
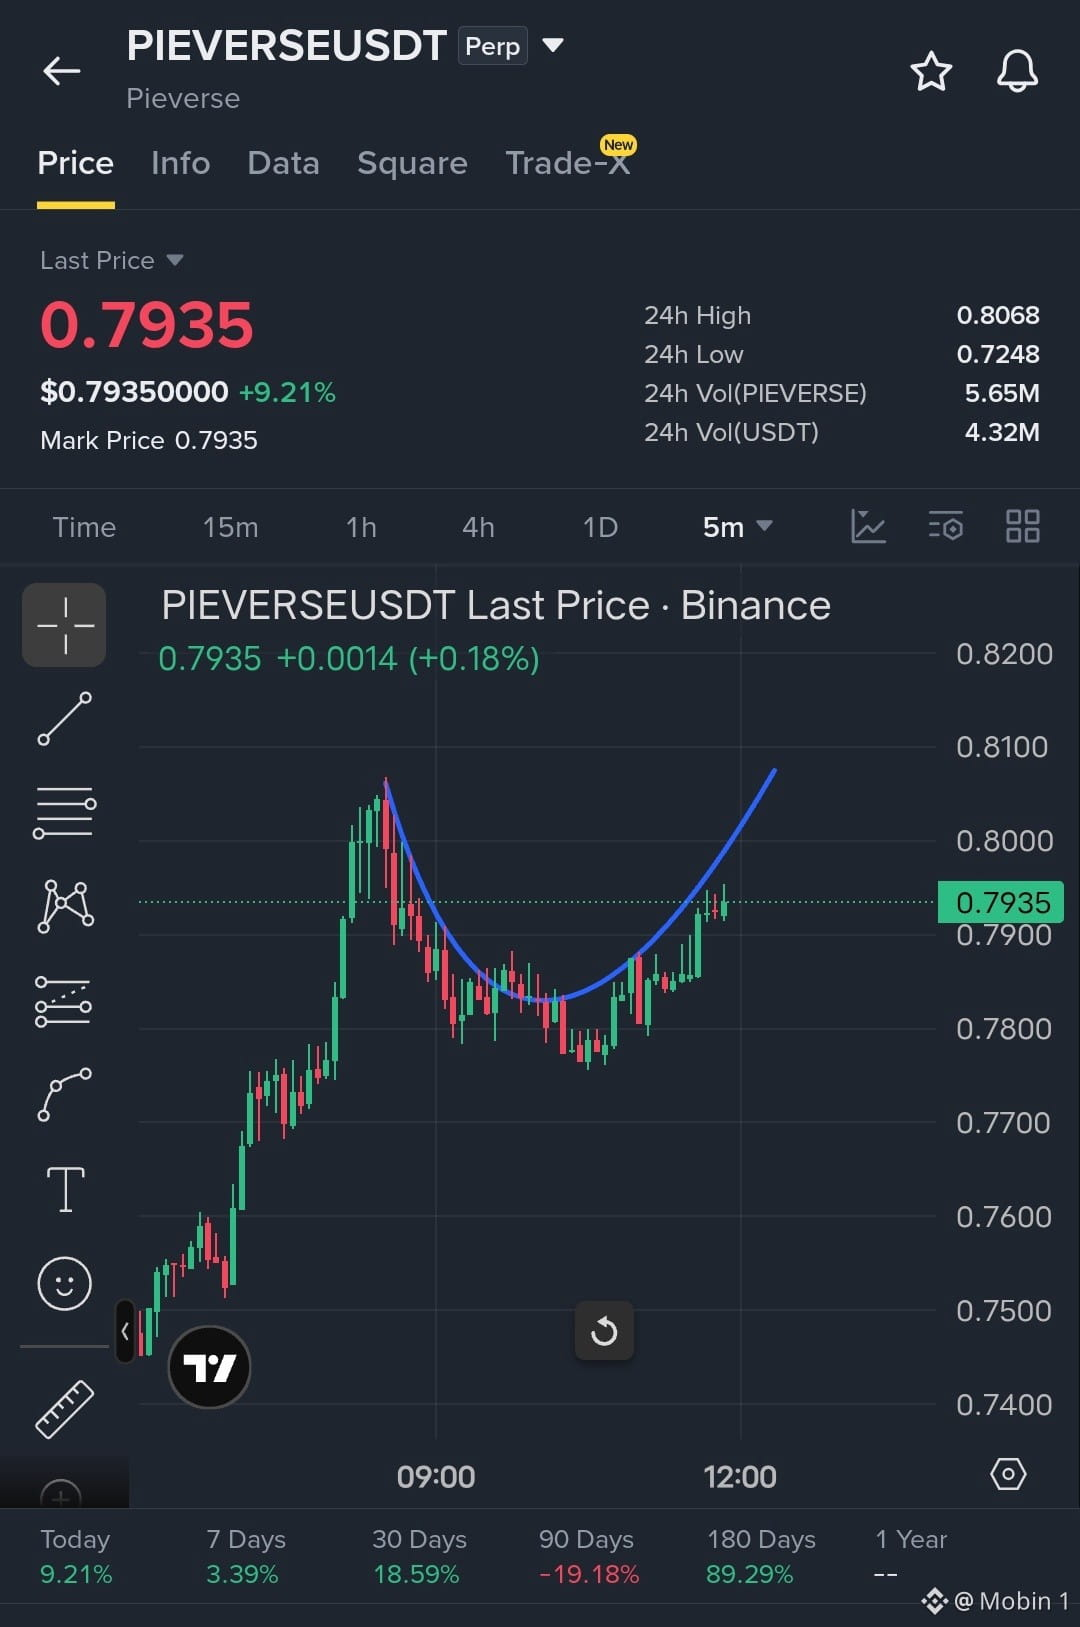
$PIEVERSE Yüksəliş yönlü əməliyyat, lakin risklidir
Təhlükəsiz giriş:
Hədəf 🎯: $0.8100
Stop-loss: 0.7840
{future}(PIEVERSEUSDT)
$PIEVERSE Yüksəliş yönlü əməliyyat, lakin risklidir
Təhlükəsiz giriş:
Hədəf 🎯: $0.8100
Stop-loss: 0.7840
Təhlükəsiz giriş:
Hədəf 🎯: $0.8100
Stop-loss: 0.7840
86
·
--
Artım
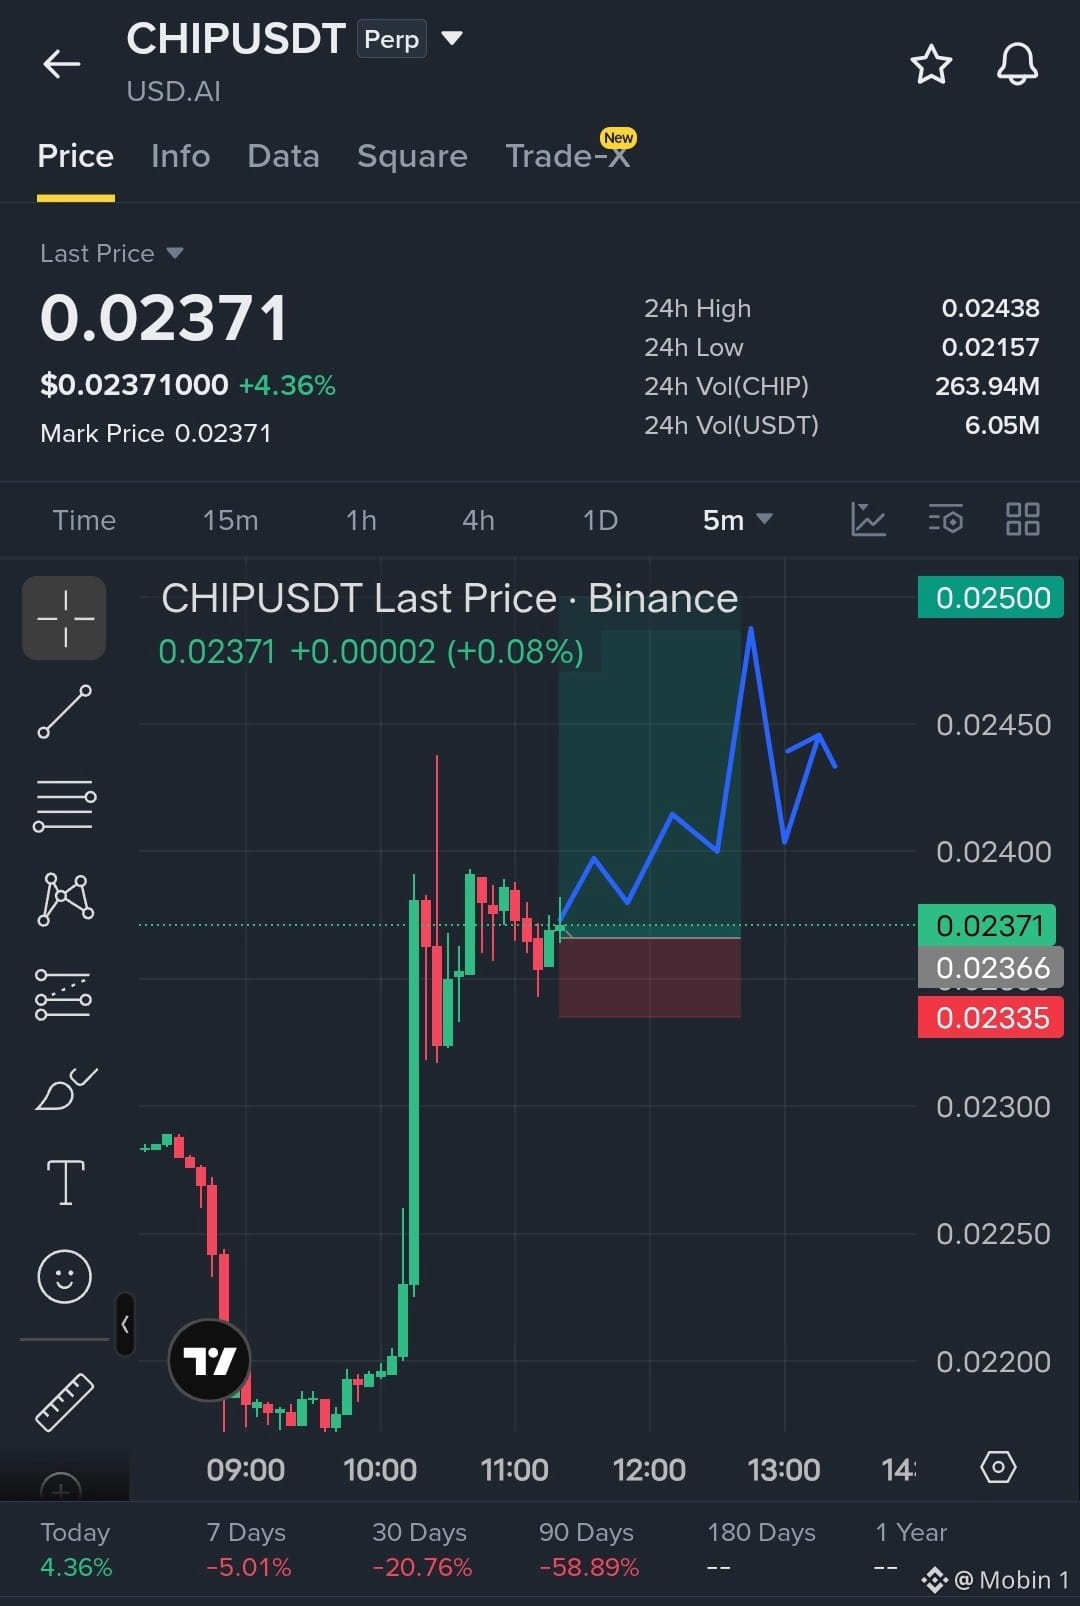
$CHIP Bullish Trade
Buy Entry : $0.02366 -- $0.02371
Target 🎯: $0.02450
Target 🎯: $0.02500
Stoploss : $0.02335
{future}(CHIPUSDT)
$CHIP Bullish Trade
Buy Entry : $0.02366 -- $0.02371
Target 🎯: $0.02450
Target 🎯: $0.02500
Stoploss : $0.02335
Buy Entry : $0.02366 -- $0.02371
Target 🎯: $0.02450
Target 🎯: $0.02500
Stoploss : $0.02335
1
319
·
--
Azalma
Tərcüməyə bax
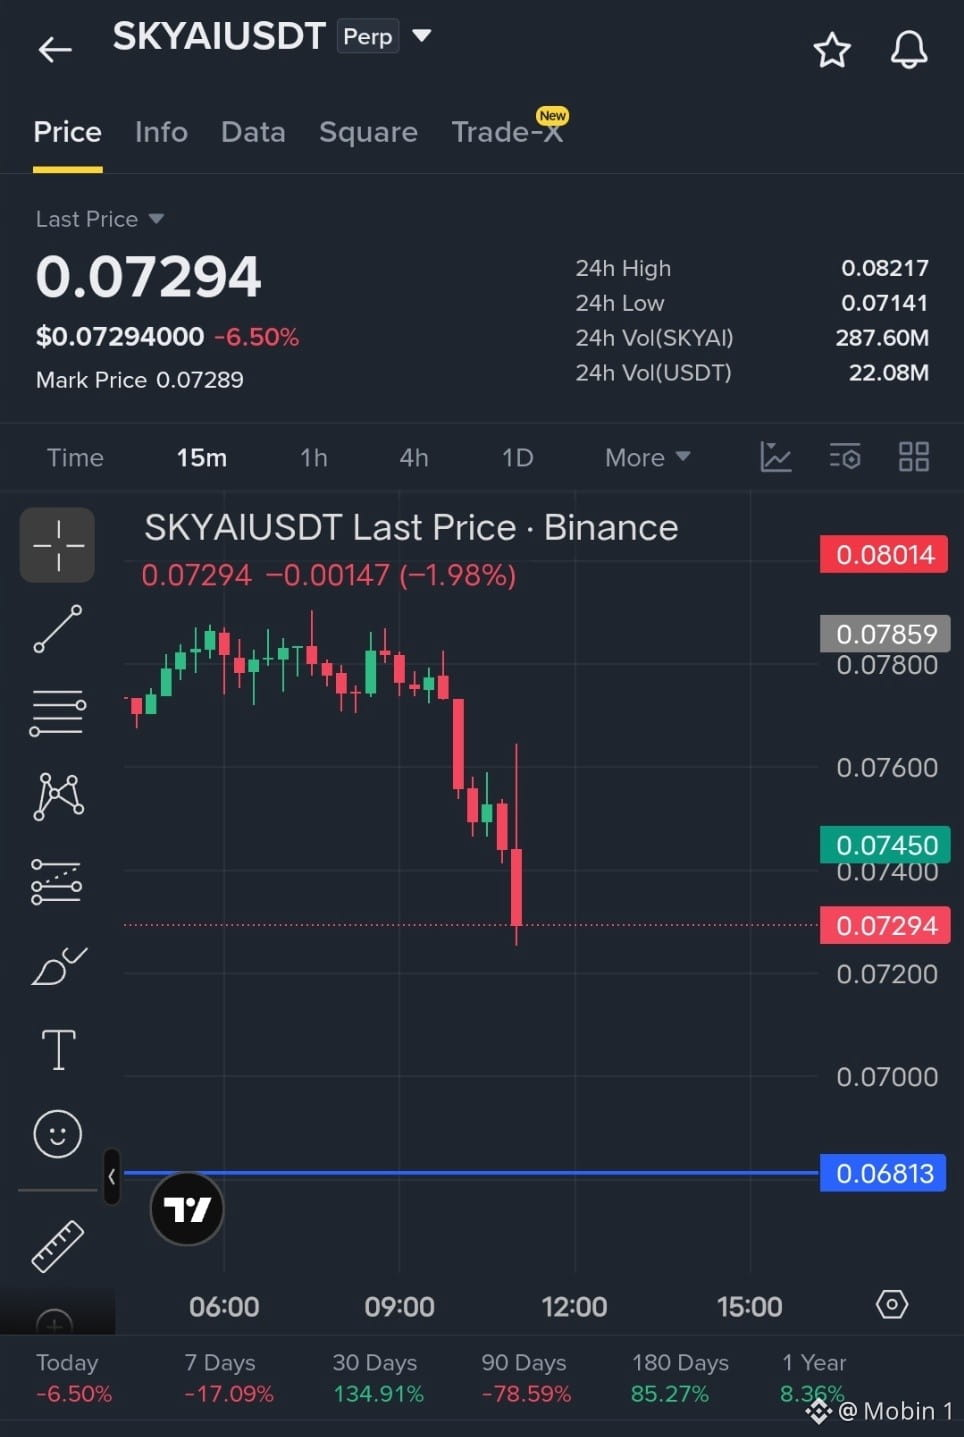
$SKYAI 🐻 Short Sell Trade
Entry : Safe 0.07300
Stoploss :
Target 🎯 0.07000
Target 🎯 : 0.06813
{future}(SKYAIUSDT)
$SKYAI 🐻 Short Sell Trade
Entry : Safe 0.07300
Stoploss :
Target 🎯 0.07000
Target 🎯 : 0.06813
Entry : Safe 0.07300
Stoploss :
Target 🎯 0.07000
Target 🎯 : 0.06813
292
·
--
Azalma
Tərcüməyə bax
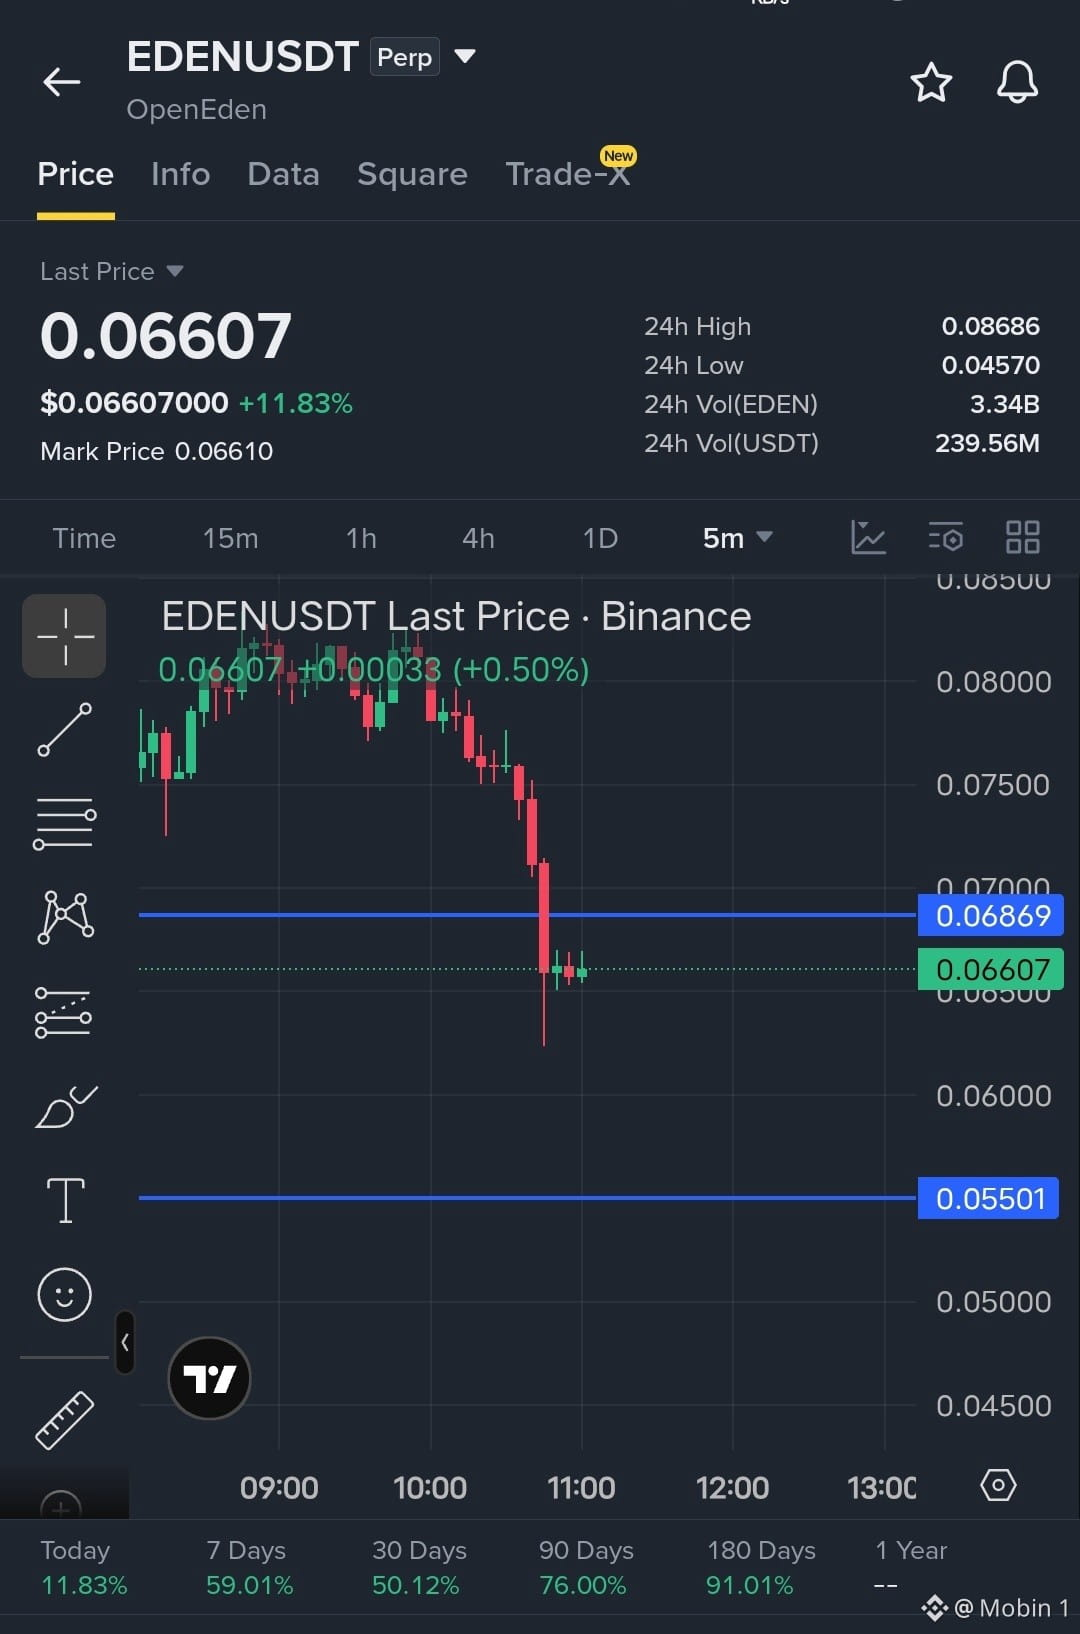
$EDEN Strong 🐻 Short Sell Trade
Entry Safe zone 0.06607
Stoploss : 0.06865
Target : 🎯 0.5500
{future}(EDENUSDT)
$EDEN Strong 🐻 Short Sell Trade
Entry Safe zone 0.06607
Stoploss : 0.06865
Target : 🎯 0.5500
Entry Safe zone 0.06607
Stoploss : 0.06865
Target : 🎯 0.5500
56
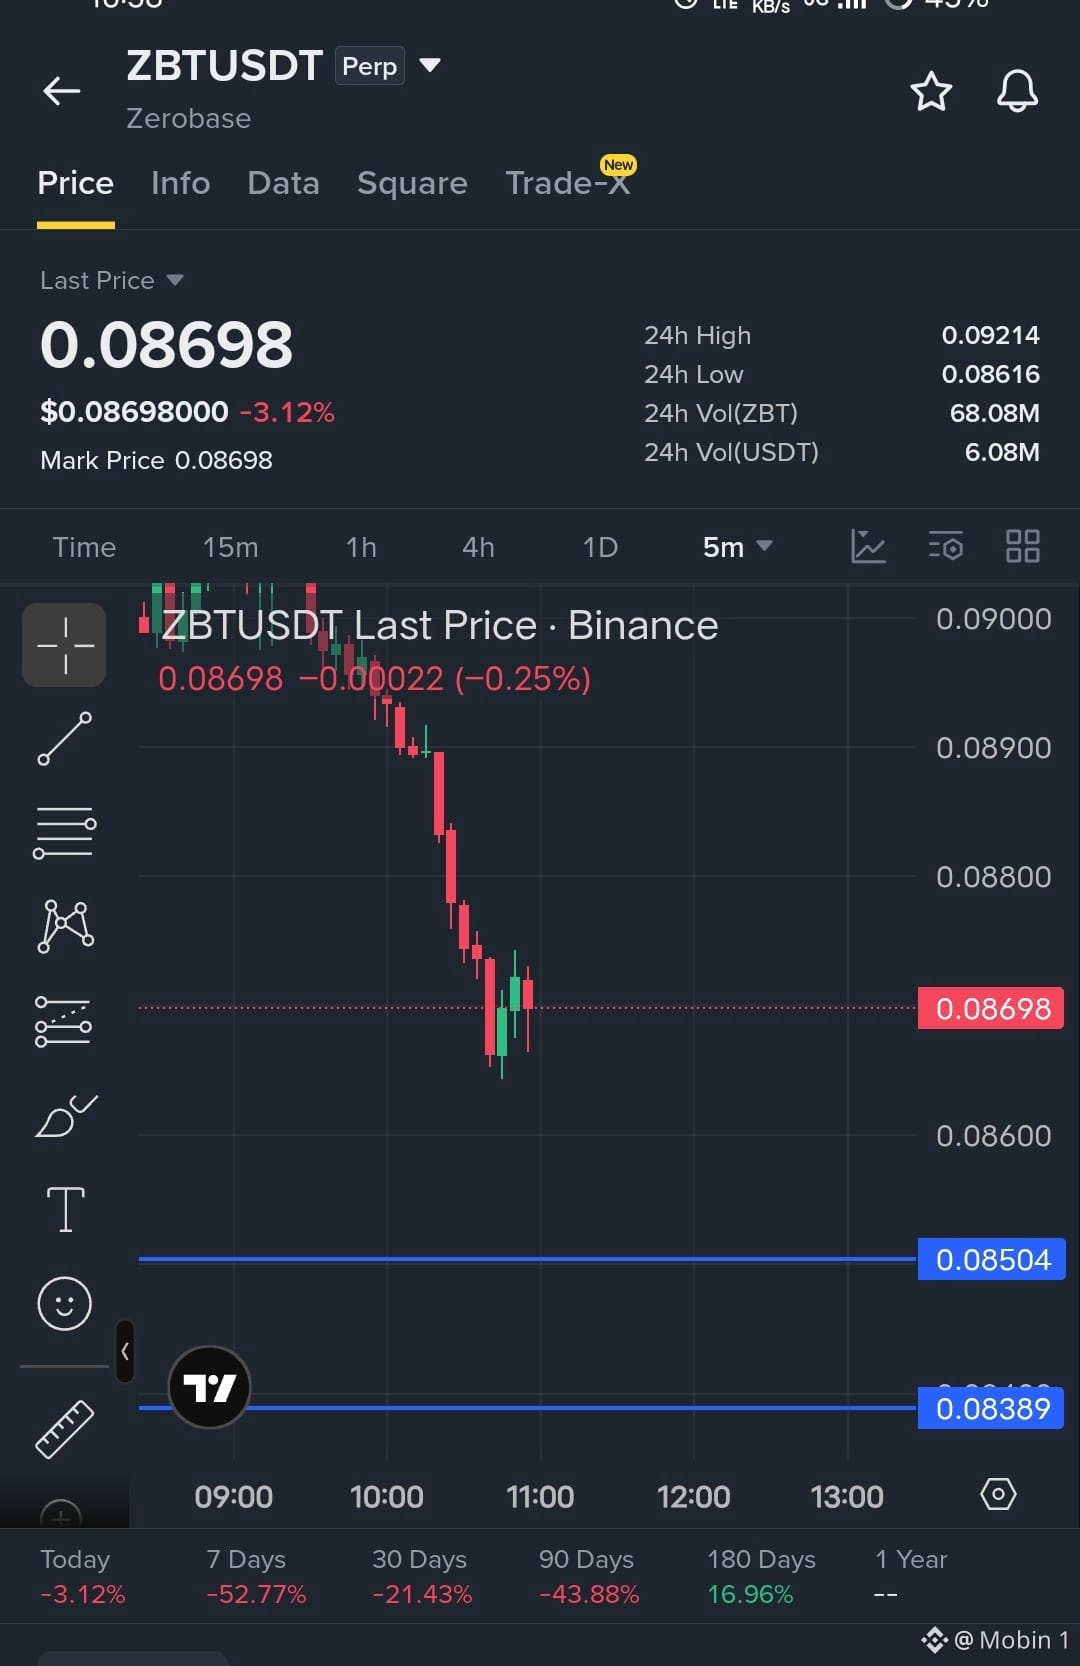
$ZBT Strot Sell
Entry : 0.08698
Target : 🎯 0.08504 -- 🎯0.08390
Stoploss : 0.08740
{future}(ZBTUSDT)
$ZBT Strot Sell
Entry : 0.08698
Target : 🎯 0.08504 -- 🎯0.08390
Stoploss : 0.08740
Entry : 0.08698
Target : 🎯 0.08504 -- 🎯0.08390
Stoploss : 0.08740
207
·
--
Azalma
Tərcüməyə bax
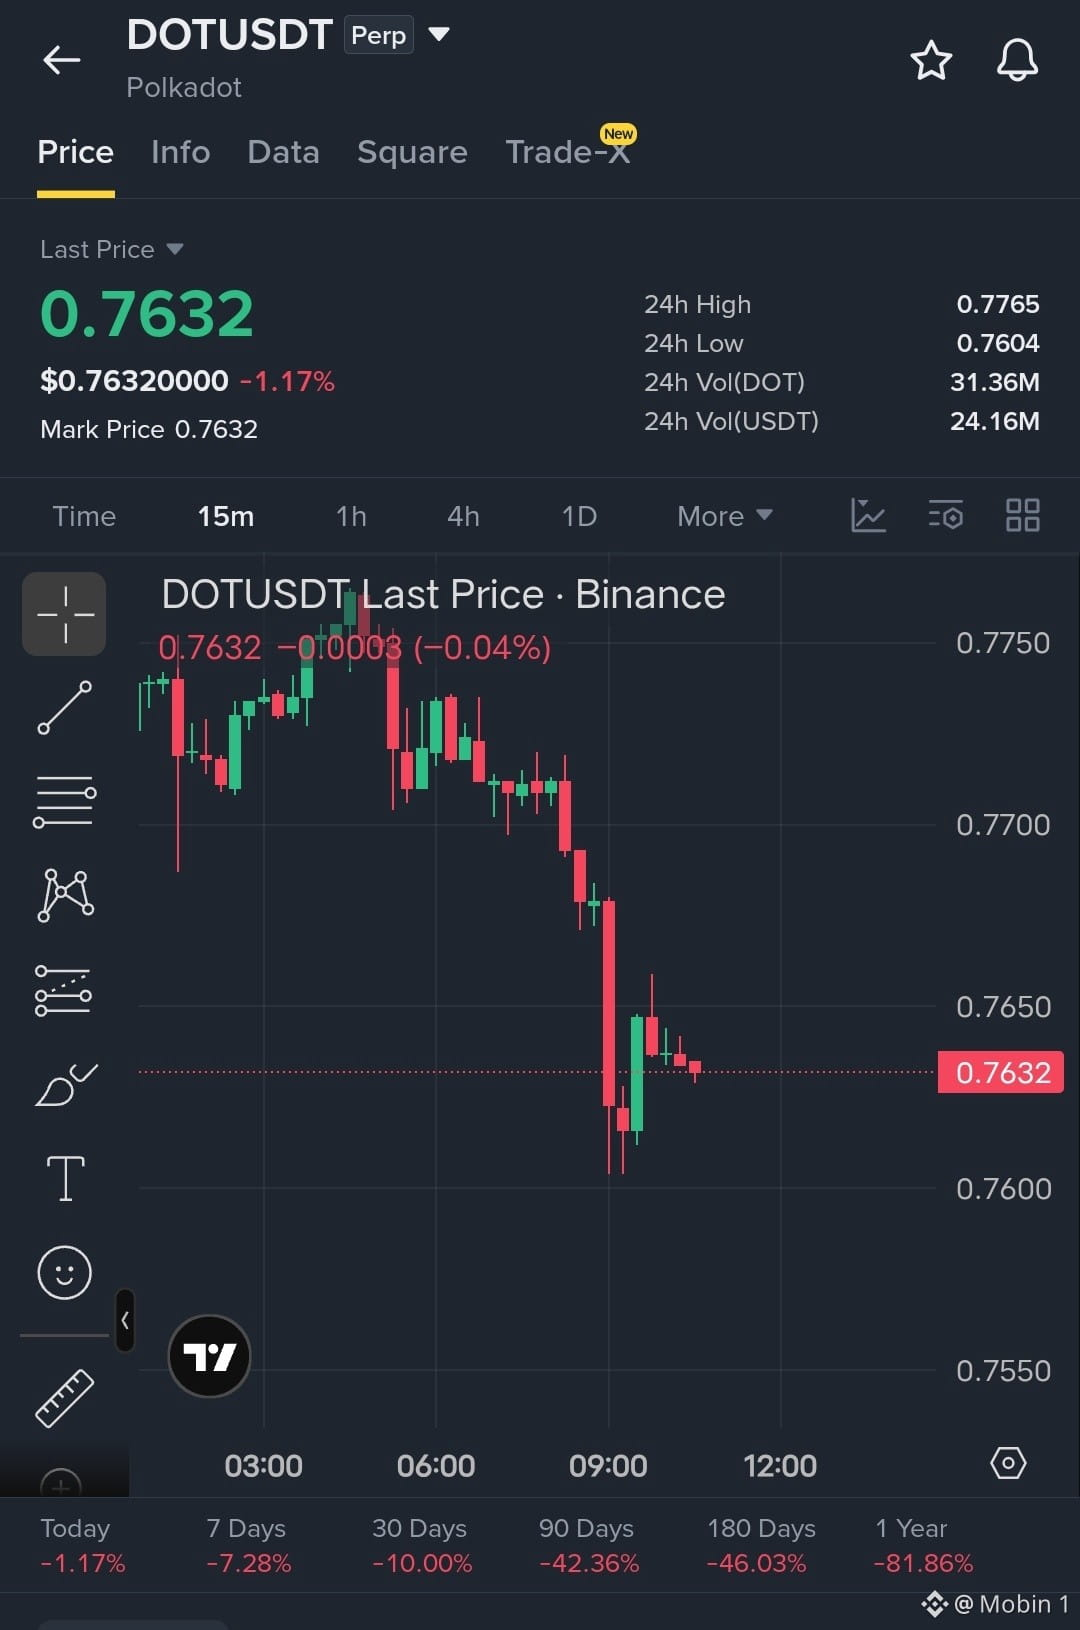
$DOT Short Sell Trade
Entry : 0.7650 -- 0.7630
Target 🎯 0.7550
Stoploss : 0.7670 - 0.7680
{future}(DOTUSDT)
$DOT Short Sell Trade
Entry : 0.7650 -- 0.7630
Target 🎯 0.7550
Stoploss : 0.7670 - 0.7680
Entry : 0.7650 -- 0.7630
Target 🎯 0.7550
Stoploss : 0.7670 - 0.7680
119
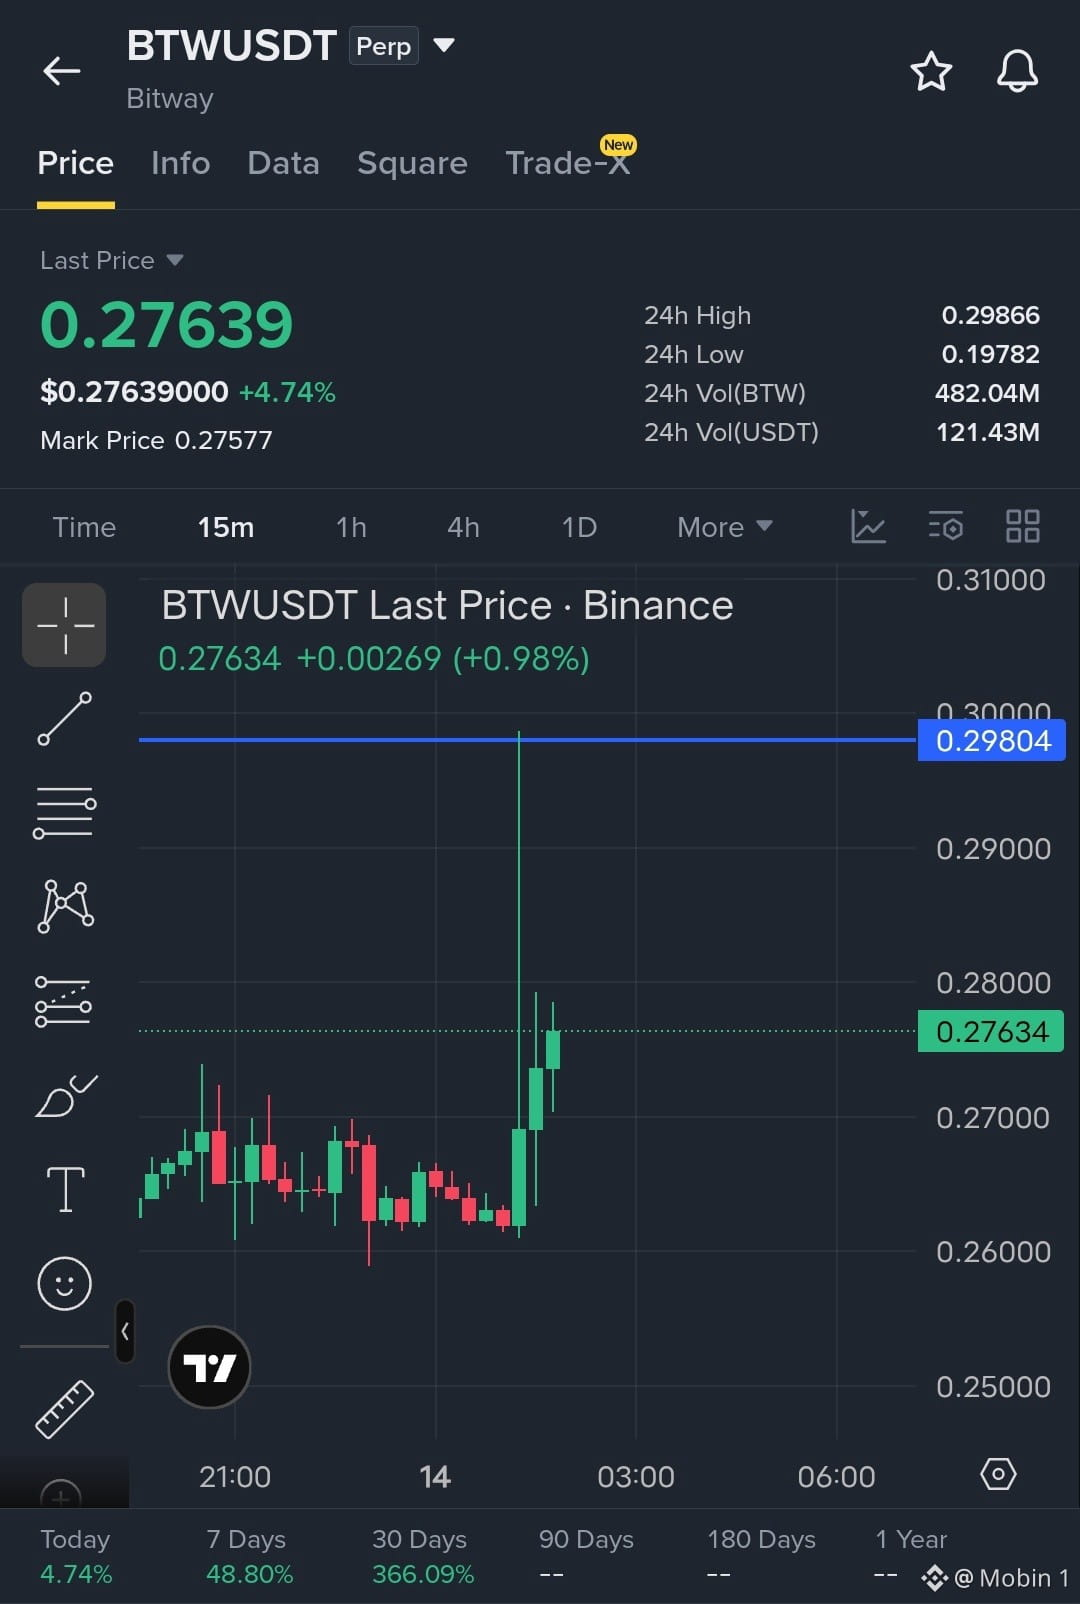
$BTW Güclü yüksəliş patterni
Təhlükəsiz giriş alışı:
Məqsəd 🎯 : 0.29804
Stoploss : 0.27000
{future}(BTWUSDT)
$BTW Güclü yüksəliş patterni
Təhlükəsiz giriş alışı:
Məqsəd 🎯 : 0.29804
Stoploss : 0.27000
Təhlükəsiz giriş alışı:
Məqsəd 🎯 : 0.29804
Stoploss : 0.27000
277
·
--
Artım
Tərcüməyə bax
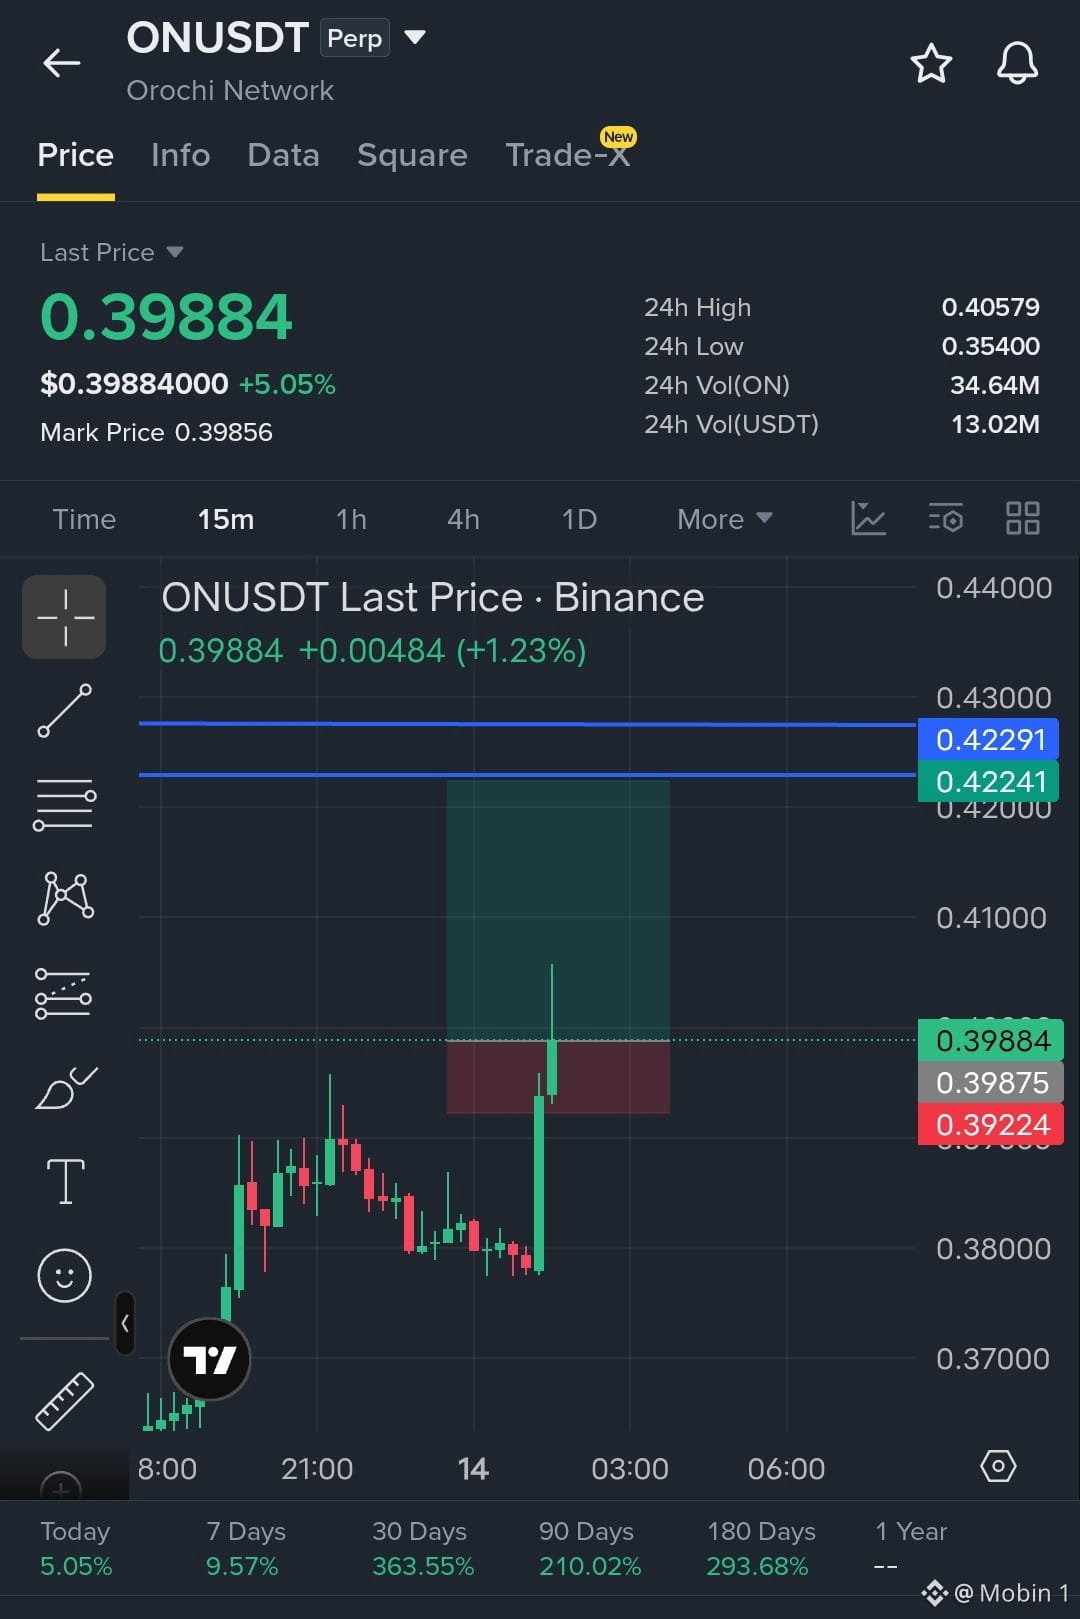
$ON Bullish Trade
Buy Entry :
Target : 0.42241
Stoploss : 39224
{future}(ONUSDT)
$ON Bullish Trade
Buy Entry :
Target : 0.42241
Stoploss : 39224
Buy Entry :
Target : 0.42241
Stoploss : 39224
1
232
Tərcüməyə bax
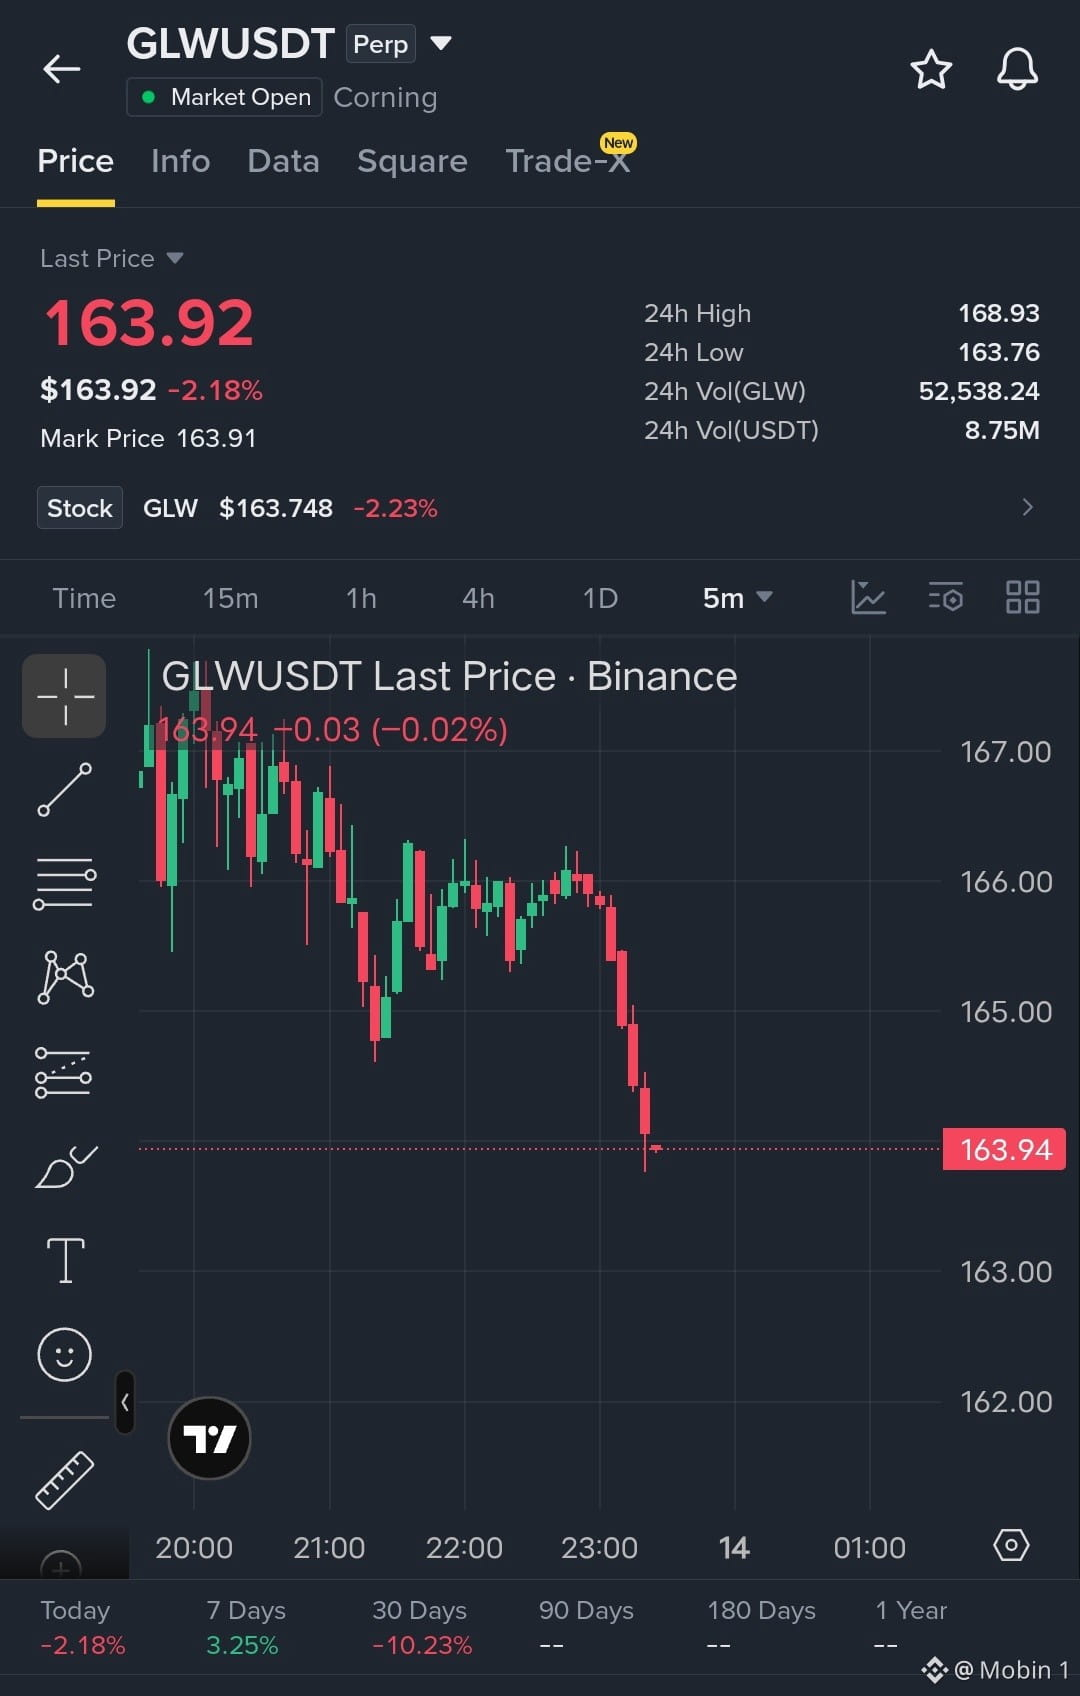
$GLW short Trade
Enter in Short Selling Target 🎯 163 - 🎯163.50
{future}(GLWUSDT)
$GLW short Trade
Enter in Short Selling Target 🎯 163 - 🎯163.50
Enter in Short Selling Target 🎯 163 - 🎯163.50
70
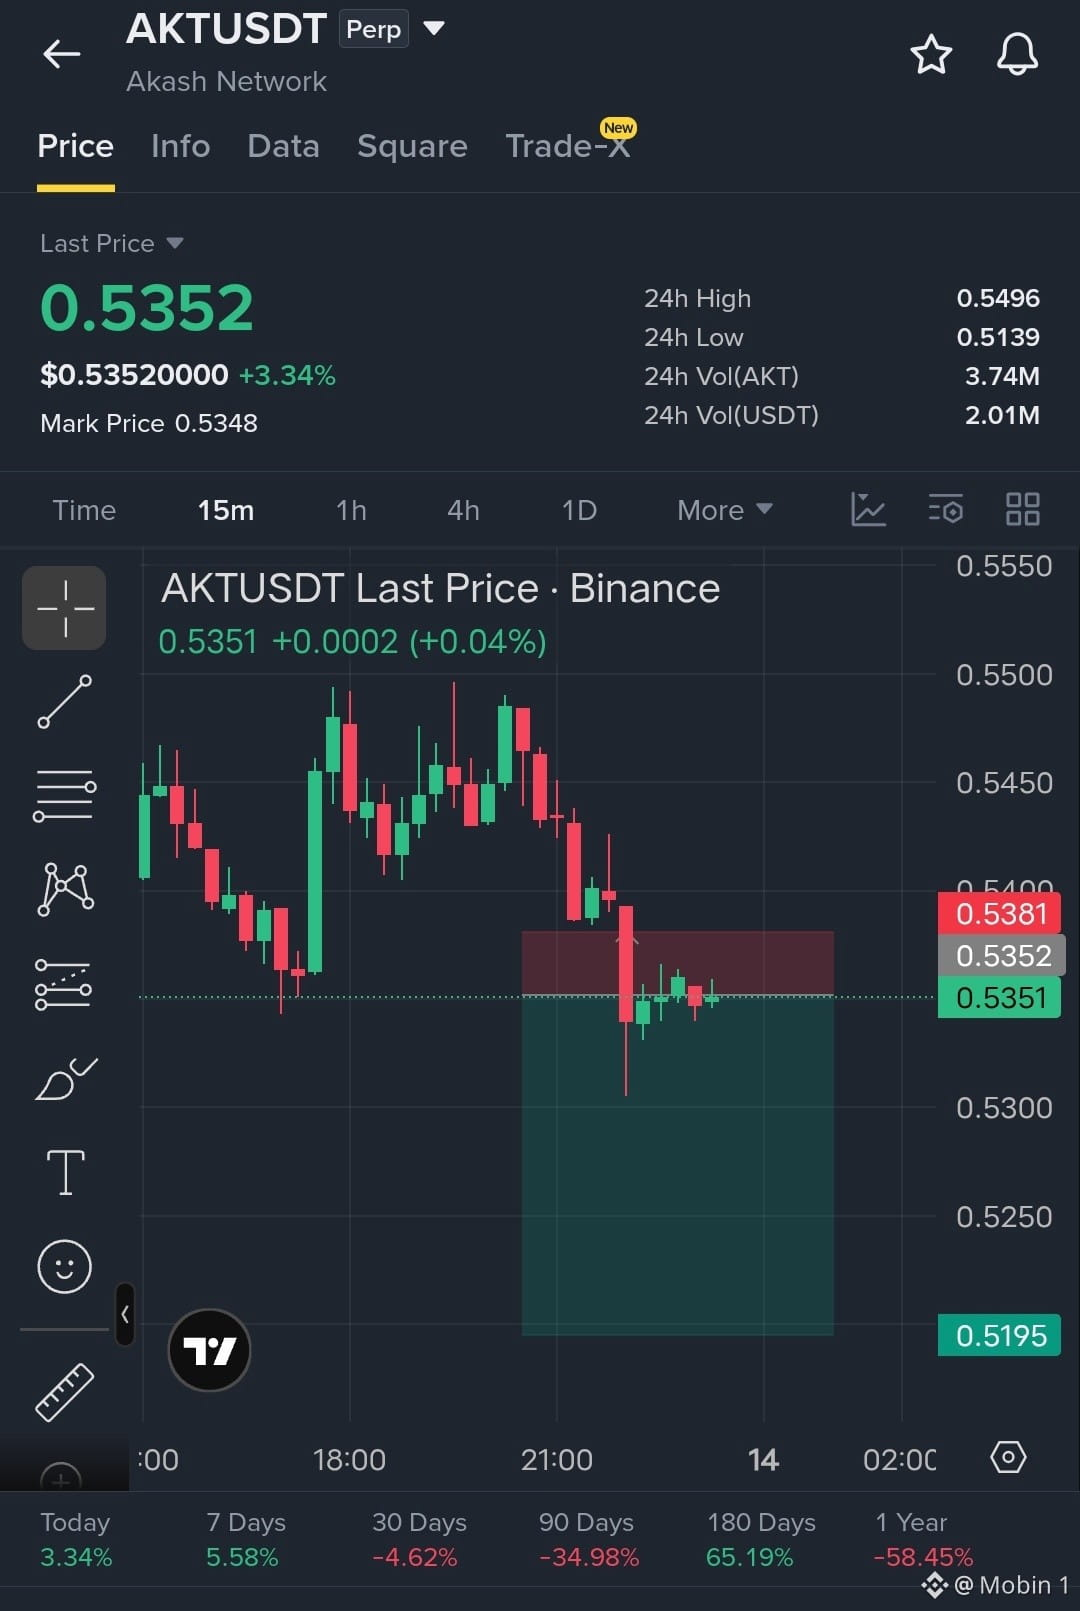
$AKT Qısa satış əməliyyatı
Giriş :
Hədəf : 🎯 0.5250 - 🎯 0.5195
Zərəri dayandırma : 🛑 0.5381
{future}(AKTUSDT)
$AKT Qısa satış əməliyyatı
Giriş :
Hədəf : 🎯 0.5250 - 🎯 0.5195
Zərəri dayandırma : 🛑 0.5381
Giriş :
Hədəf : 🎯 0.5250 - 🎯 0.5195
Zərəri dayandırma : 🛑 0.5381
16
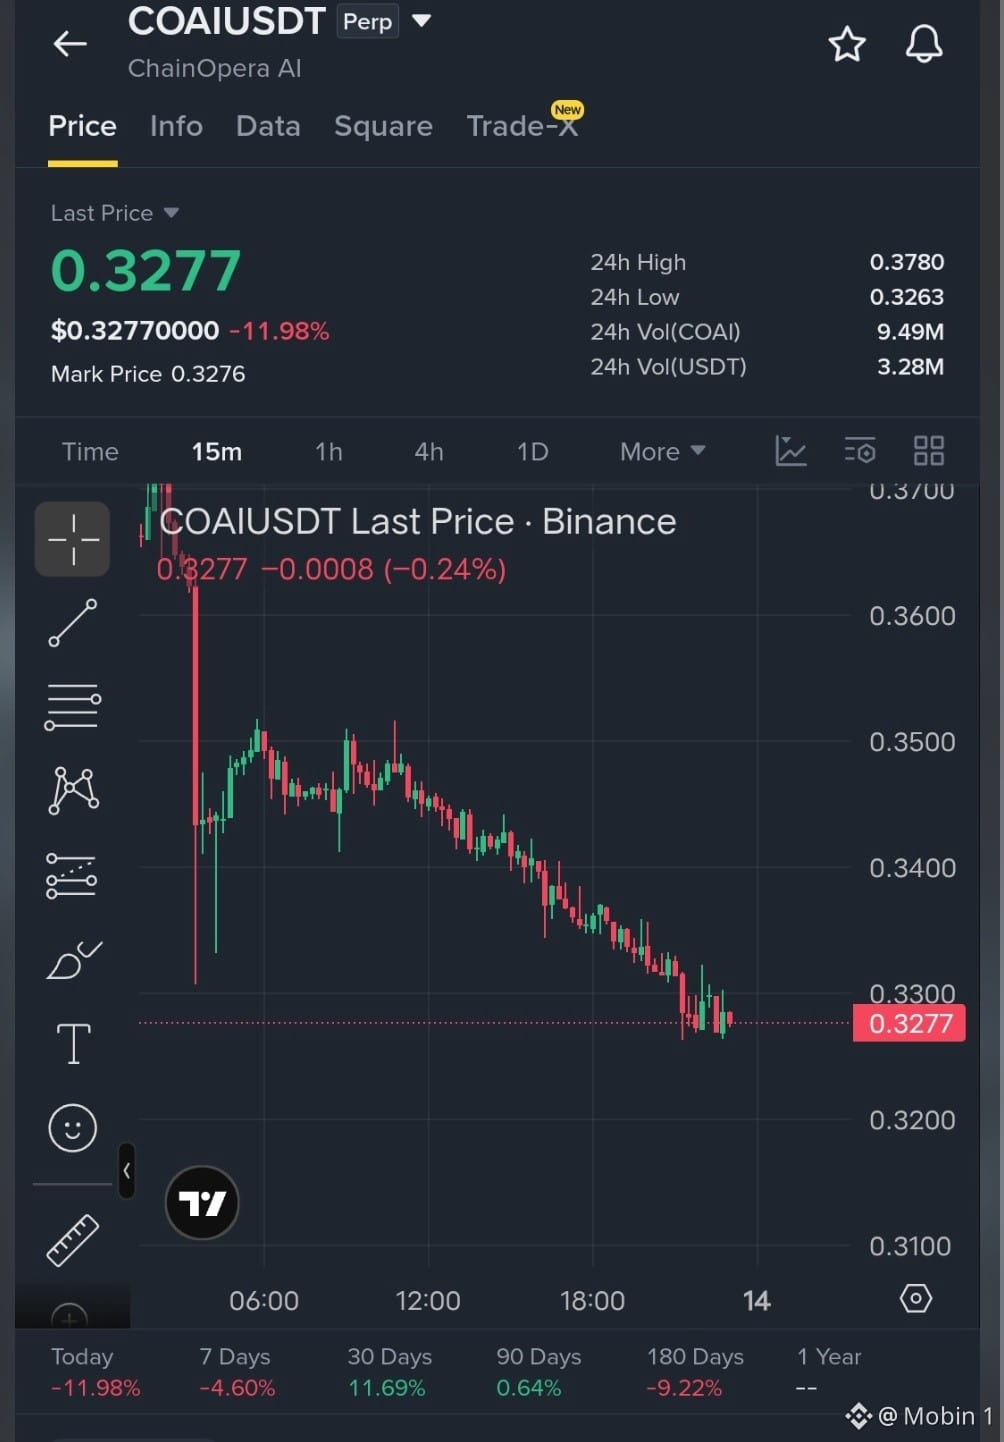
$COAI Güclü qısa satış siqnalı
Qısa satış mövqeyinə təhlükəsiz giriş edin
Hədəf 1 : 0.3200
Hədəf 2 : 0.3100
Stop-loss təyin edin : 0.3350
$COAI Güclü qısa satış siqnalı
Qısa satış mövqeyinə təhlükəsiz giriş edin
Hədəf 1 : 0.3200
Hədəf 2 : 0.3100
Stop-loss təyin edin : 0.3350
Qısa satış mövqeyinə təhlükəsiz giriş edin
Hədəf 1 : 0.3200
Hədəf 2 : 0.3100
Stop-loss təyin edin : 0.3350
260
·
--
Azalma
Tərcüməyə bax
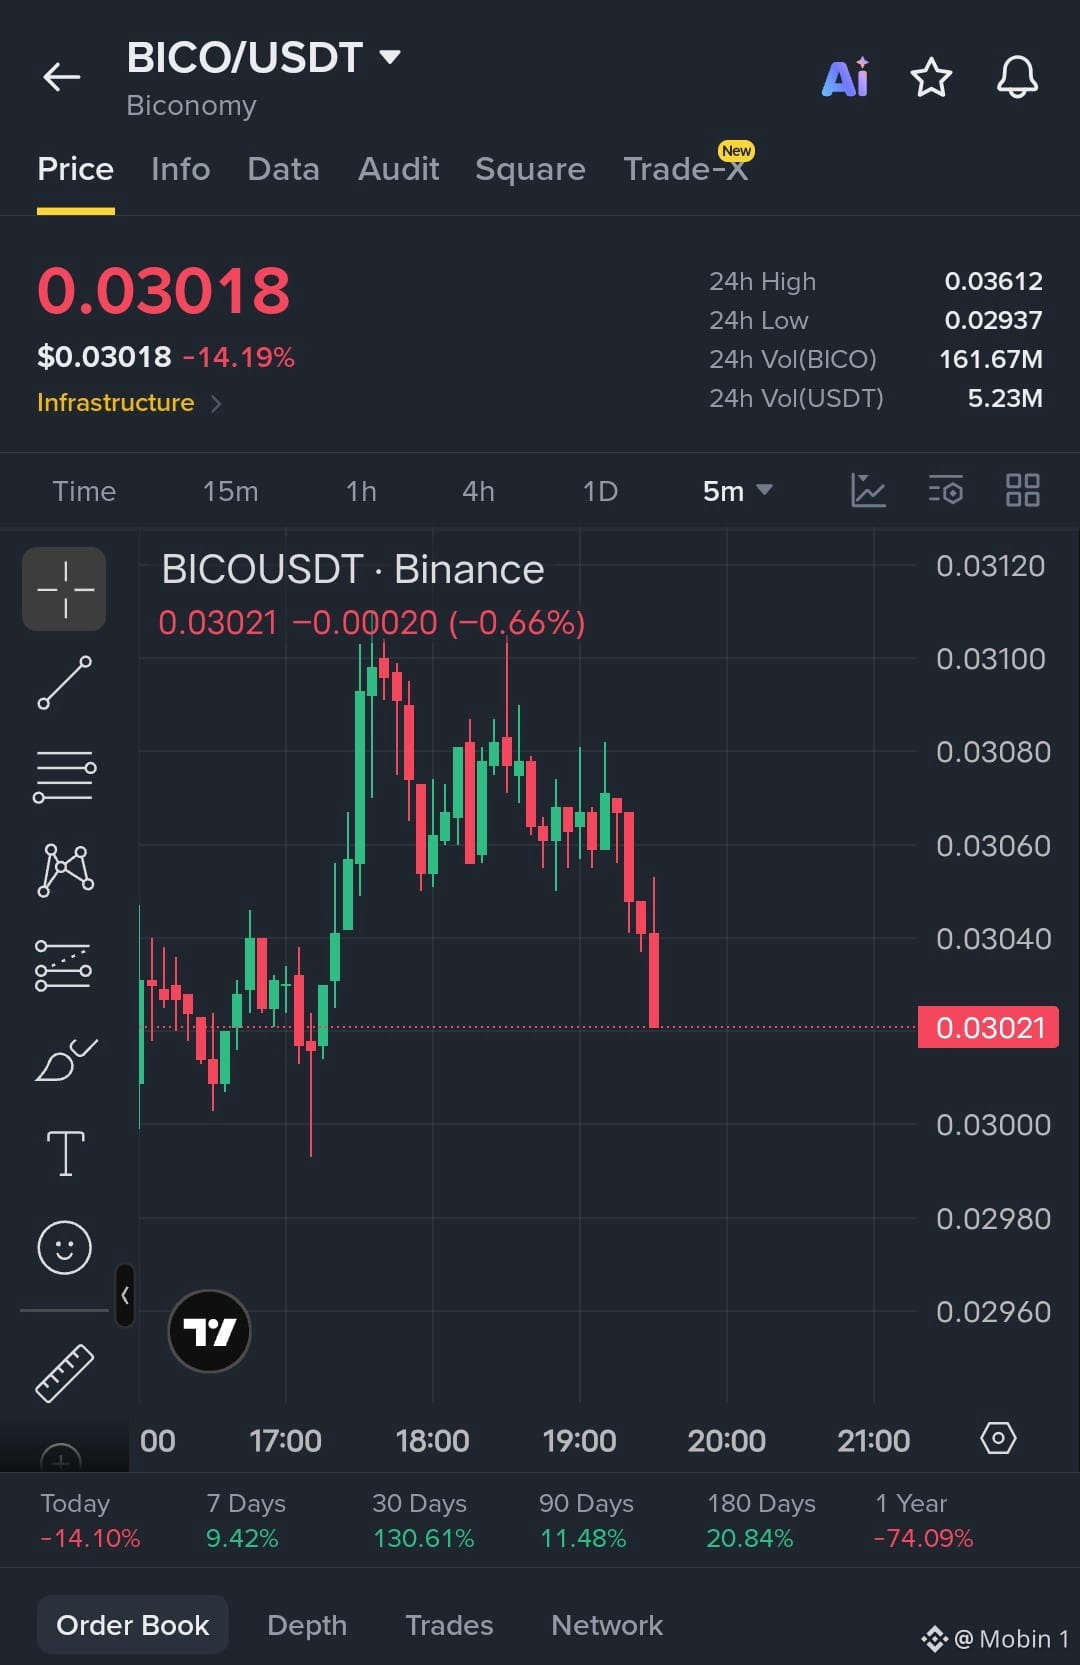
$BICO Strong Selling
Short this trade
Entry : 0.03040
Target : 0.02960
{future}(BICOUSDT)
$BICO Strong Selling
Short this trade
Entry : 0.03040
Target : 0.02960
Short this trade
Entry : 0.03040
Target : 0.02960
81
·
--
Azalma
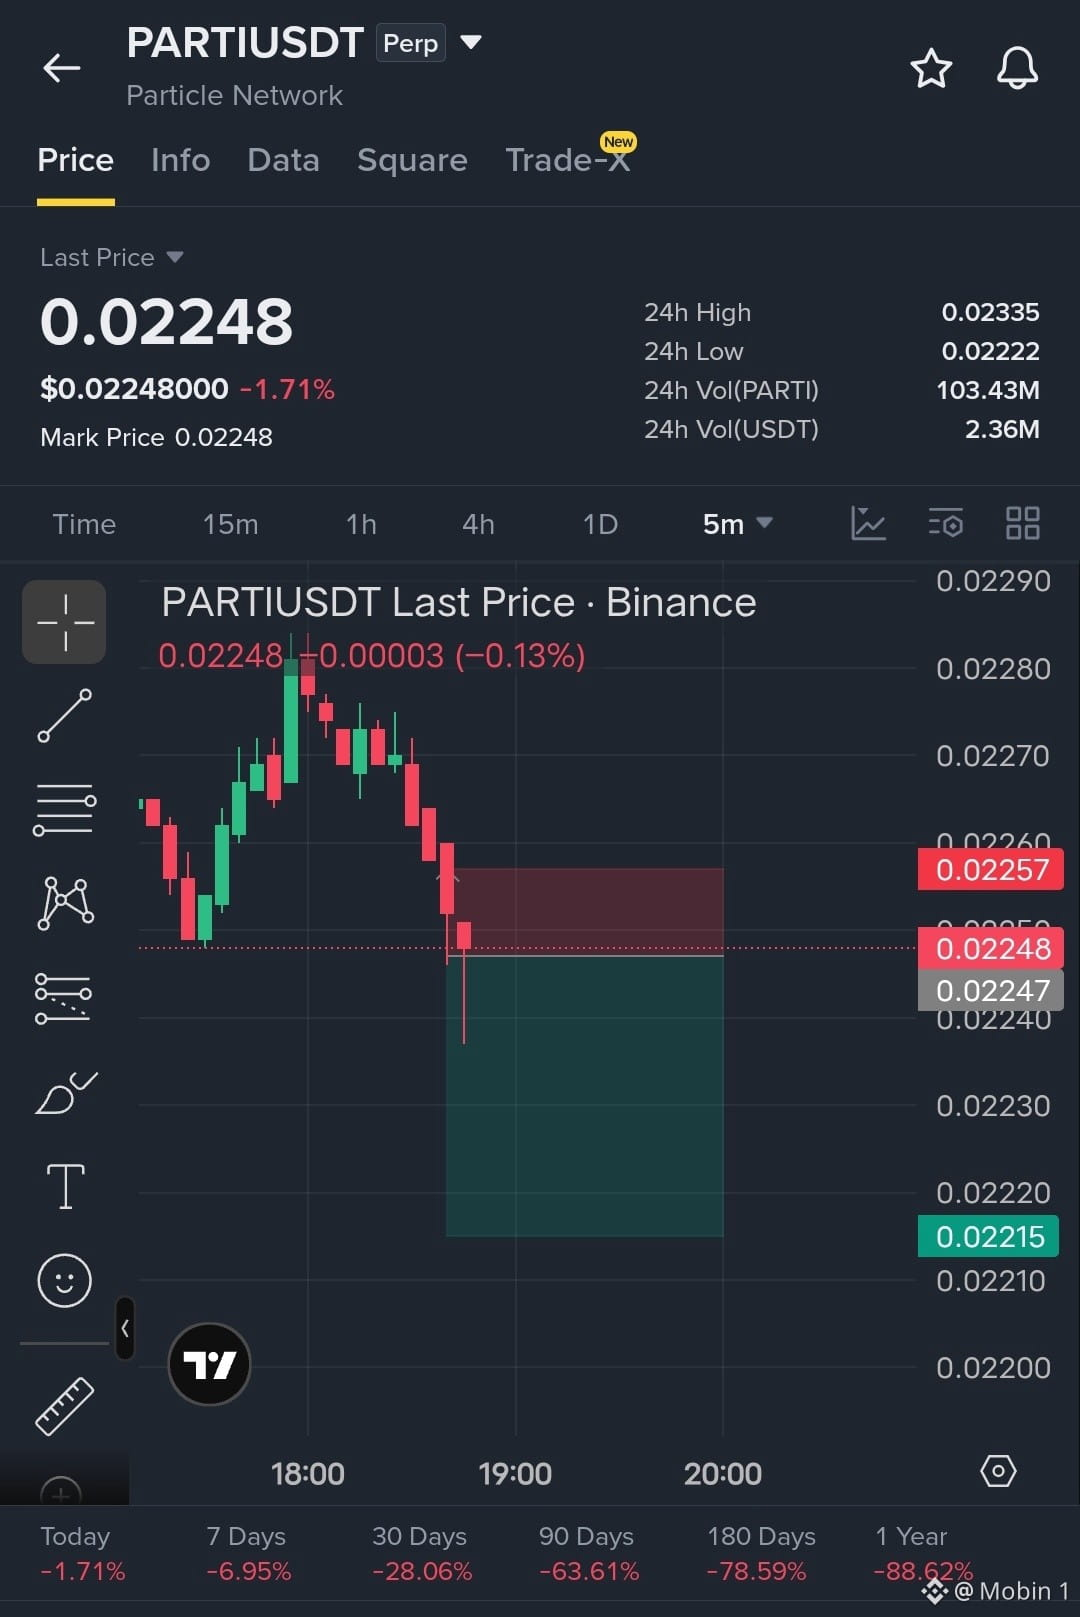
$PARTI Short Sell Trade
Hədəf : 🎯 0.02215 - 0.02200
Stop-loss : 0.02257
{future}(PARTIUSDT)
$PARTI Short Sell Trade
Hədəf : 🎯 0.02215 - 0.02200
Stop-loss : 0.02257
Hədəf : 🎯 0.02215 - 0.02200
Stop-loss : 0.02257
423
Daha çox kontent araşdırmaq üçün daxil olun
Binance Square-də qlobal kriptovalyuta istifadəçilərinə qoşulun
⚡️ Kriptovalyuta haqqında ən son və faydalı məlumatları əldə edin.
💬 Dünyanın ən böyük kriptovalyuta birjası tərəfindən etibar edilir.
👍 Doğrulanmış yaradıcılardan gələn real məlumatları kəşf edin.
E-poçt/Telefon nömrəsi
Trenddə olan mövzular
CryptoSelloffTriggersMultipleWhaleLiquidations
222,121 baxış
Müzakirə edir: 1,950
24 Saatda Kripto Likvidasiyaları 2 Milyard Dolları Ötdü, 329 000 Treyderin Mövqeyi Silindi
Binance News
·40 bəyənmə
·59.6k baxış
USSpotXRPETFsSeeLargestWeeklyOutflowIn8Months
186,934 baxış
Müzakirə edir: 1,638
WillFOMCMinutesReinforceRateHikeExpectations?
62,792 baxış
Müzakirə edir: 815