
Huutruong039811
10.6k Paylaşımlar

Huutruong039811
Şikayət et
İstifadəçini blokla
Crypto Airdrop Daily | Follow for new opportunities | Binance UID 152277880 | X Huutruong039811 | KITE 277880 🇻🇳
Açıq ticarət
Yüksək tezlikli treyder
5.5 il
3.6K+ İzlənilir
2.4K+ İzləyicilər
847 Bəyəndi
Postlar
Portfel
Hamısı
Sitatlar
Videolar
Canlı
·
--
Azalma
Tərcüməyə bax
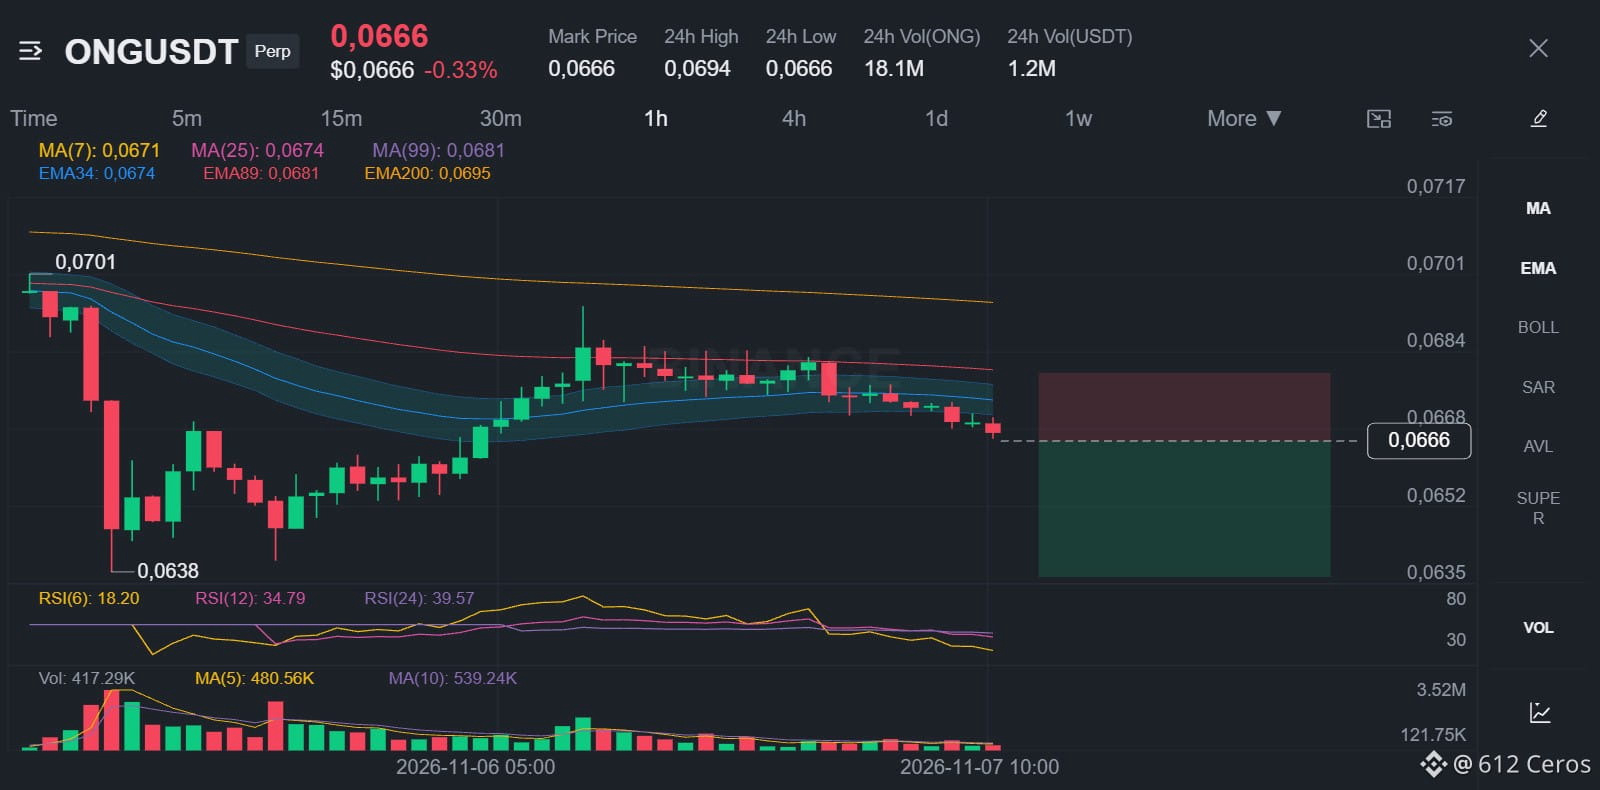
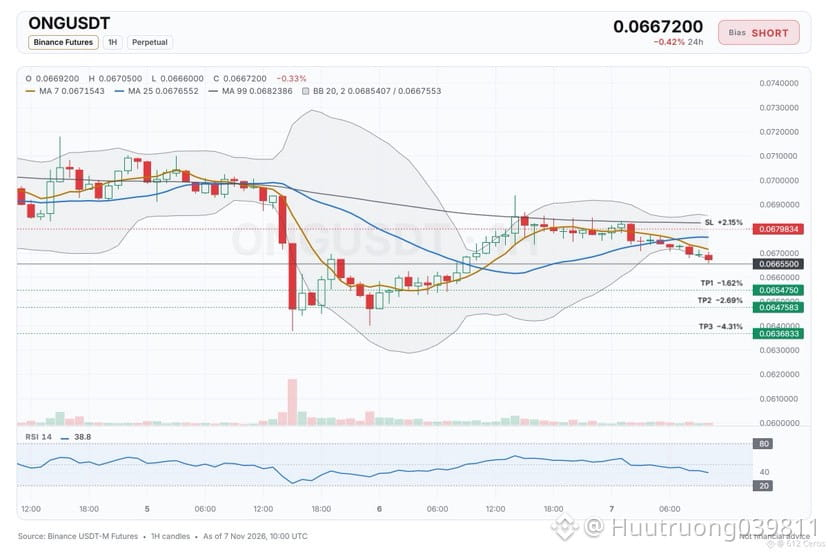
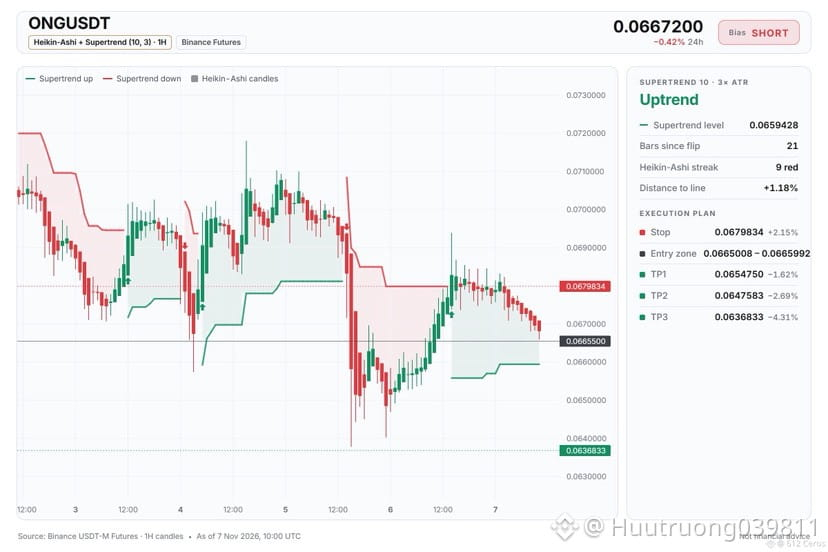
🔴 $ONG /USDT · Bias: SHORT
The 4h price sits below EMA50 and EMA200, showing a bearish stack that points lower.
Entry: 0.0665008 – 0.0665992
TP1: 0.0654750 (-1.6%)
TP2: 0.0647583 (-2.7%)
TP3: 0.0636833 (-4.3%)
SL: 0.0679834 (+2.2%)
Why: The 4h trend shows price below EMA50 and EMA200, meaning the swing trend is down.
Plan: close 50% at TP1, 25% at TP2, 25% at TP3, and move the stop to entry after TP1.
Would you enter this short at the current level?
{spot}(ONGUSDT)
🔴 $ONG /USDT · Bias: SHORT
The 4h price sits below EMA50 and EMA200, showing a bearish stack that points lower.
Entry: 0.0665008 – 0.0665992
TP1: 0.0654750 (-1.6%)
TP2: 0.0647583 (-2.7%)
TP3: 0.0636833 (-4.3%)
SL: 0.0679834 (+2.2%)
Why: The 4h trend shows price below EMA50 and EMA200, meaning the swing trend is down.
Plan: close 50% at TP1, 25% at TP2, 25% at TP3, and move the stop to entry after TP1.
Would you enter this short at the current level?
The 4h price sits below EMA50 and EMA200, showing a bearish stack that points lower.
Entry: 0.0665008 – 0.0665992
TP1: 0.0654750 (-1.6%)
TP2: 0.0647583 (-2.7%)
TP3: 0.0636833 (-4.3%)
SL: 0.0679834 (+2.2%)
Why: The 4h trend shows price below EMA50 and EMA200, meaning the swing trend is down.
Plan: close 50% at TP1, 25% at TP2, 25% at TP3, and move the stop to entry after TP1.
Would you enter this short at the current level?
5
·
--
Azalma
Tərcüməyə bax
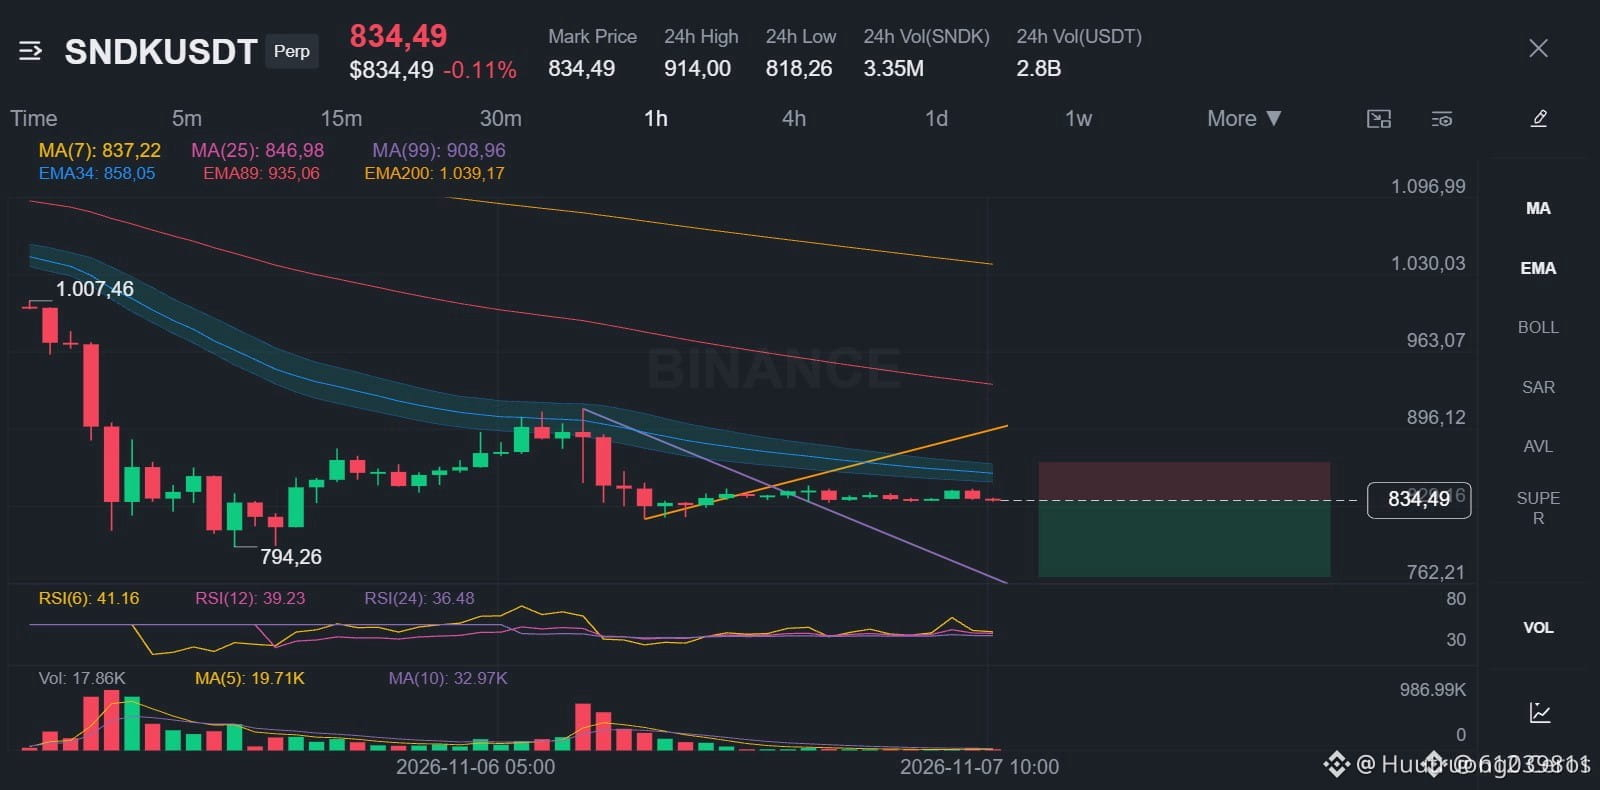
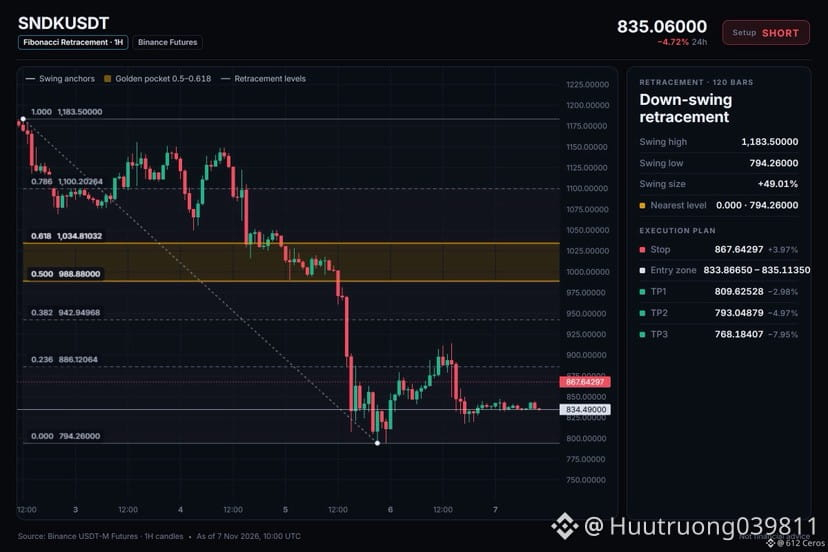
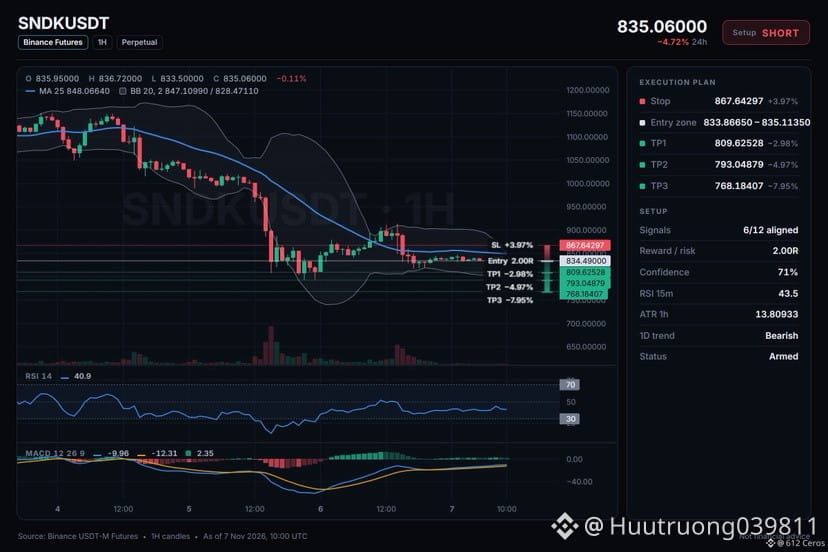
🔴 $SNDK /USDT · Bias: SHORT
SNDK is in a bearish stack on daily and 1h charts, pointing lower.
Entry: 833.86650 – 835.11350
TP1: 809.62528 (-3.0%)
TP2: 793.04879 (-5.0%)
TP3: 768.18407 (-7.9%)
SL: 867.64297 (+4.0%)
Why: The daily trend shows price below both EMAs, meaning the big-picture trend is down and sellers are in control.
Risk: Far below its average, bounce likely (−3.3 ATR from 1h EMA50)
Plan: close 50% at TP1, 25% at TP2, 25% at TP3, and move the stop to entry after TP1.
Do you agree with this short setup on SNDK?
{future}(SNDKUSDT)
🔴 $SNDK /USDT · Bias: SHORT
SNDK is in a bearish stack on daily and 1h charts, pointing lower.
Entry: 833.86650 – 835.11350
TP1: 809.62528 (-3.0%)
TP2: 793.04879 (-5.0%)
TP3: 768.18407 (-7.9%)
SL: 867.64297 (+4.0%)
Why: The daily trend shows price below both EMAs, meaning the big-picture trend is down and sellers are in control.
Risk: Far below its average, bounce likely (−3.3 ATR from 1h EMA50)
Plan: close 50% at TP1, 25% at TP2, 25% at TP3, and move the stop to entry after TP1.
Do you agree with this short setup on SNDK?
SNDK is in a bearish stack on daily and 1h charts, pointing lower.
Entry: 833.86650 – 835.11350
TP1: 809.62528 (-3.0%)
TP2: 793.04879 (-5.0%)
TP3: 768.18407 (-7.9%)
SL: 867.64297 (+4.0%)
Why: The daily trend shows price below both EMAs, meaning the big-picture trend is down and sellers are in control.
Risk: Far below its average, bounce likely (−3.3 ATR from 1h EMA50)
Plan: close 50% at TP1, 25% at TP2, 25% at TP3, and move the stop to entry after TP1.
Do you agree with this short setup on SNDK?
10
·
--
Azalma
Tərcüməyə bax
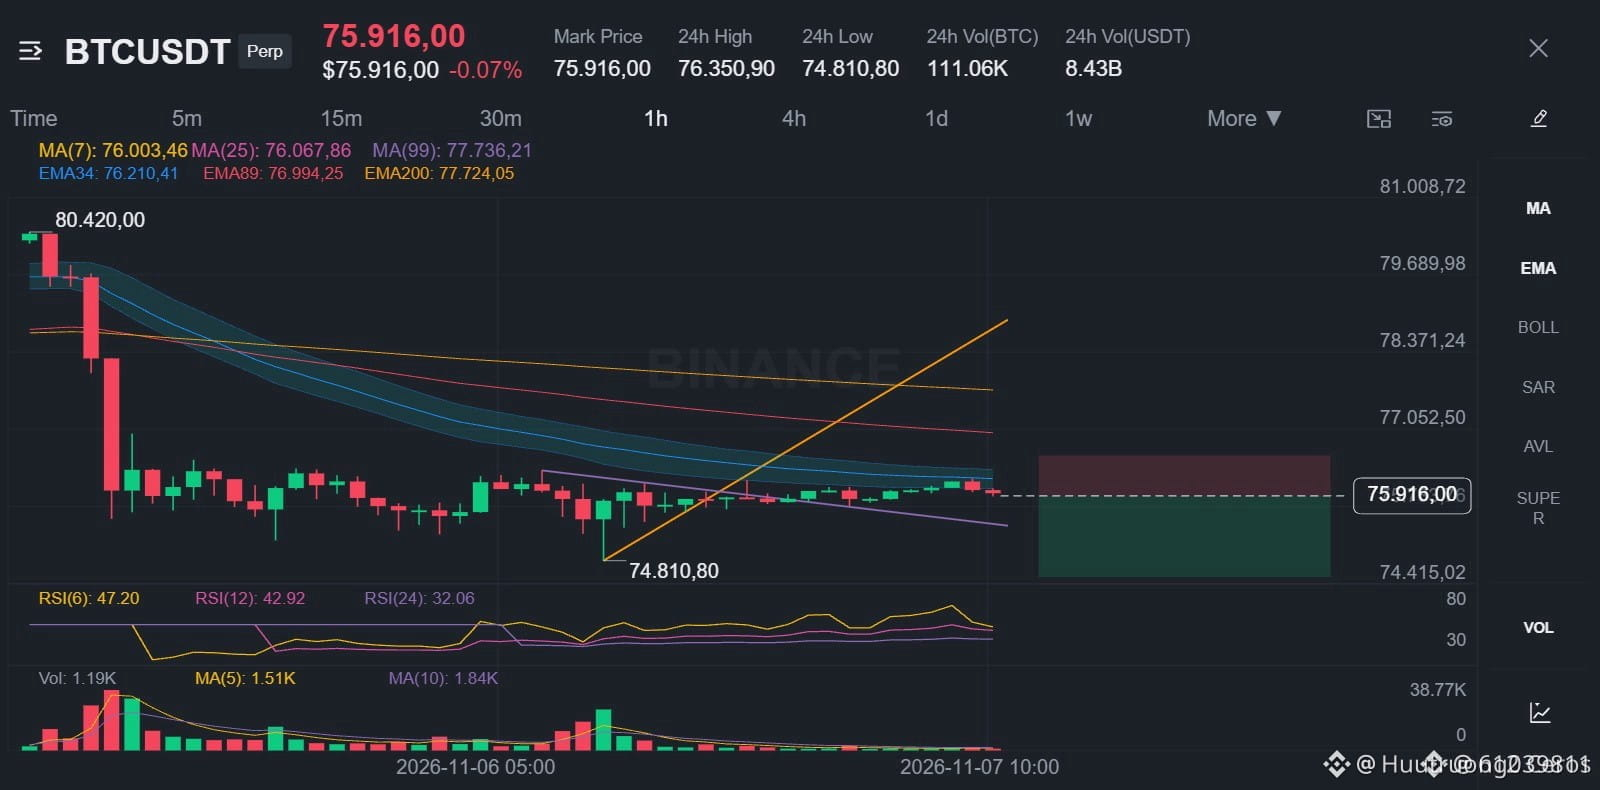
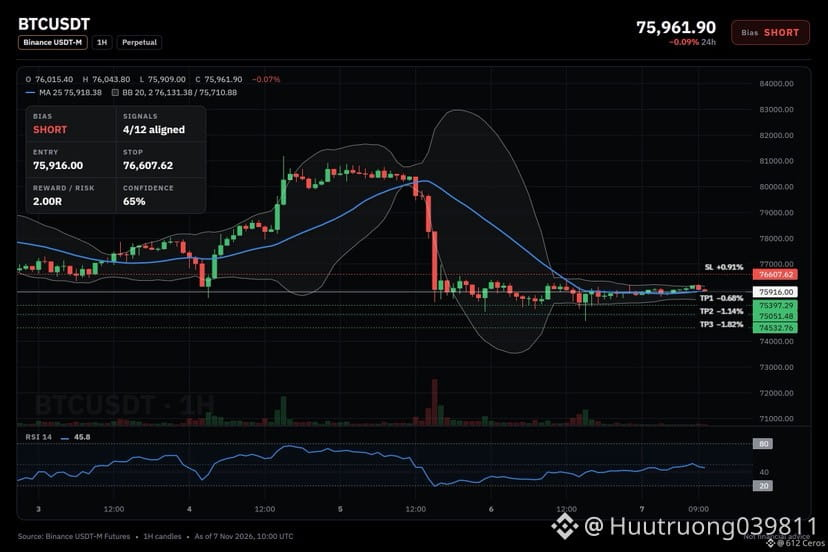
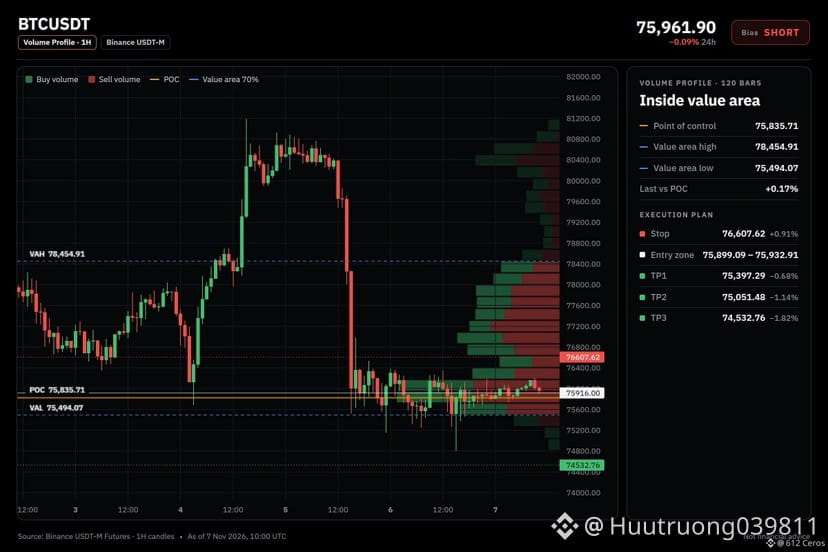
🔴 $BTC /USDT · Bias: SHORT
Four-hour and one-hour bearish stacks point the swing trend lower.
Entry: 75899.09 – 75932.91
TP1: 75397.29 (-0.7%)
TP2: 75051.48 (-1.1%)
TP3: 74532.76 (-1.8%)
SL: 76607.62 (+0.9%)
Note: moderate conviction only, keep size light.
Why: The 4h trend shows price below both EMAs in a bearish stack, meaning the swing trend is down.
Plan: close 50% at TP1, 25% at TP2, 25% at TP3, and move the stop to entry after TP1.
Do you see room for this short to reach the first target?
{spot}(BTCUSDT)
🔴 $BTC /USDT · Bias: SHORT
Four-hour and one-hour bearish stacks point the swing trend lower.
Entry: 75899.09 – 75932.91
TP1: 75397.29 (-0.7%)
TP2: 75051.48 (-1.1%)
TP3: 74532.76 (-1.8%)
SL: 76607.62 (+0.9%)
Note: moderate conviction only, keep size light.
Why: The 4h trend shows price below both EMAs in a bearish stack, meaning the swing trend is down.
Plan: close 50% at TP1, 25% at TP2, 25% at TP3, and move the stop to entry after TP1.
Do you see room for this short to reach the first target?
Four-hour and one-hour bearish stacks point the swing trend lower.
Entry: 75899.09 – 75932.91
TP1: 75397.29 (-0.7%)
TP2: 75051.48 (-1.1%)
TP3: 74532.76 (-1.8%)
SL: 76607.62 (+0.9%)
Note: moderate conviction only, keep size light.
Why: The 4h trend shows price below both EMAs in a bearish stack, meaning the swing trend is down.
Plan: close 50% at TP1, 25% at TP2, 25% at TP3, and move the stop to entry after TP1.
Do you see room for this short to reach the first target?
5
·
--
Azalma
Tərcüməyə bax
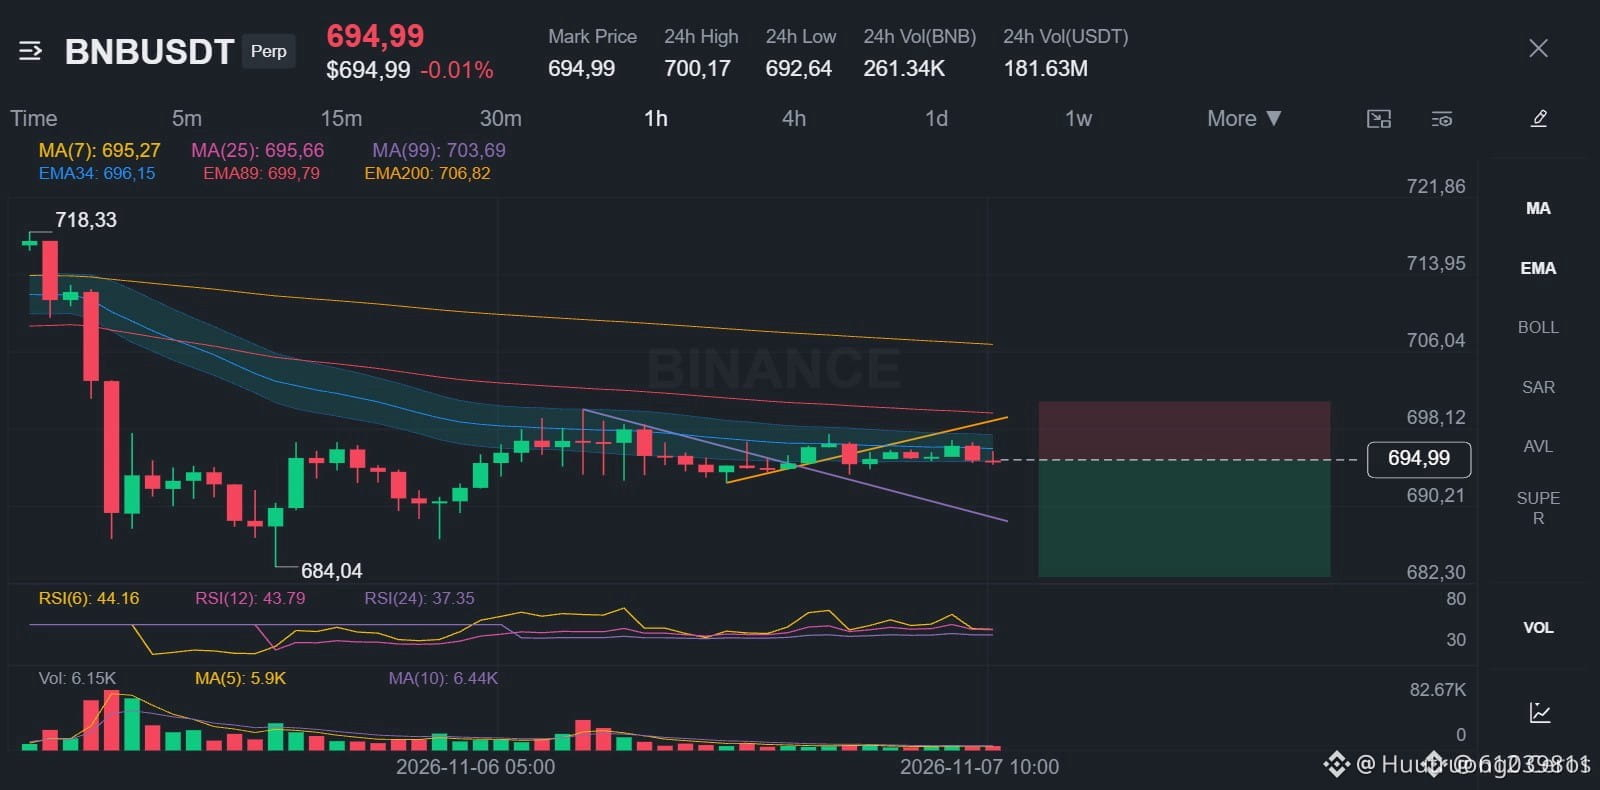
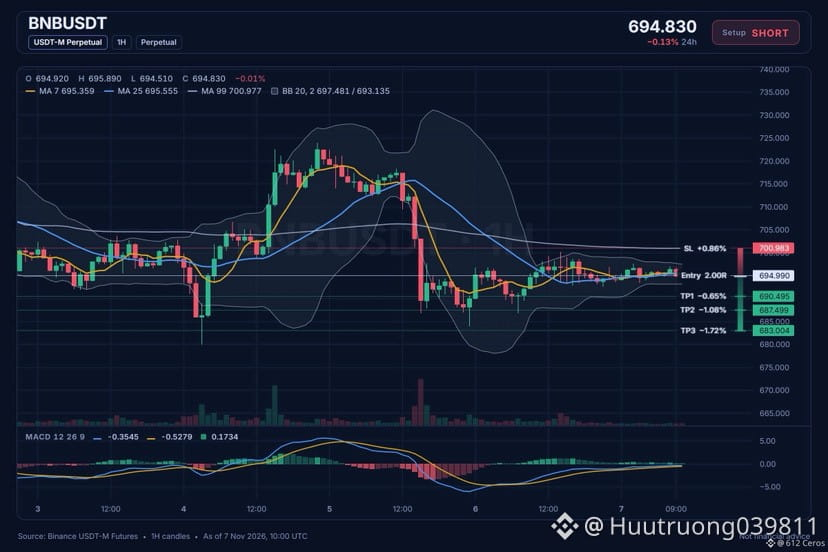
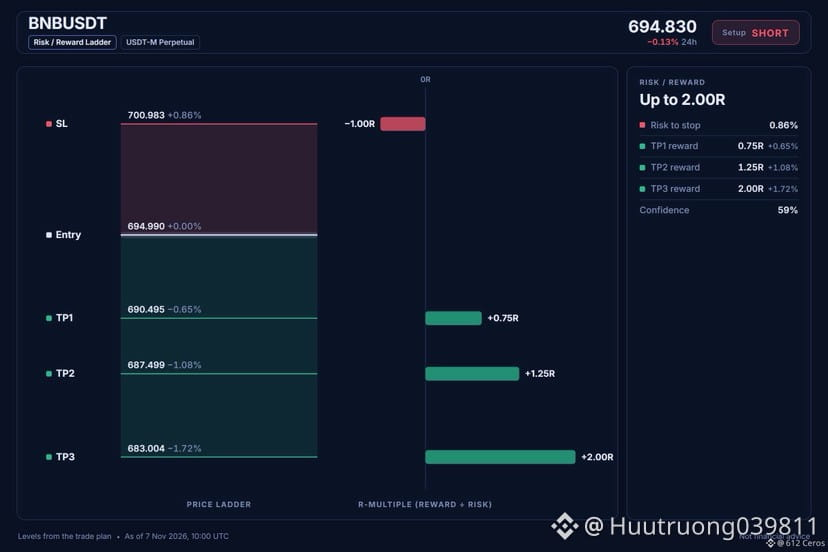
🔴 $BNB /USDT · Bias: SHORT
Price sits below both EMAs on the 4h chart, showing a bearish stack.
Entry: 694.817 – 695.163
TP1: 690.495 (-0.6%)
TP2: 687.499 (-1.1%)
TP3: 683.004 (-1.7%)
SL: 700.983 (+0.9%)
Note: moderate conviction only, keep size light.
Why: The 4h trend shows price below EMA50 and EMA200, a bearish stack meaning the swing trend is down.
Plan: close 50% at TP1, 25% at TP2, 25% at TP3, and move the stop to entry after TP1.
Do you see room for more downside from here?
{spot}(BNBUSDT)
🔴 $BNB /USDT · Bias: SHORT
Price sits below both EMAs on the 4h chart, showing a bearish stack.
Entry: 694.817 – 695.163
TP1: 690.495 (-0.6%)
TP2: 687.499 (-1.1%)
TP3: 683.004 (-1.7%)
SL: 700.983 (+0.9%)
Note: moderate conviction only, keep size light.
Why: The 4h trend shows price below EMA50 and EMA200, a bearish stack meaning the swing trend is down.
Plan: close 50% at TP1, 25% at TP2, 25% at TP3, and move the stop to entry after TP1.
Do you see room for more downside from here?
Price sits below both EMAs on the 4h chart, showing a bearish stack.
Entry: 694.817 – 695.163
TP1: 690.495 (-0.6%)
TP2: 687.499 (-1.1%)
TP3: 683.004 (-1.7%)
SL: 700.983 (+0.9%)
Note: moderate conviction only, keep size light.
Why: The 4h trend shows price below EMA50 and EMA200, a bearish stack meaning the swing trend is down.
Plan: close 50% at TP1, 25% at TP2, 25% at TP3, and move the stop to entry after TP1.
Do you see room for more downside from here?
10
·
--
Azalma
Tərcüməyə bax
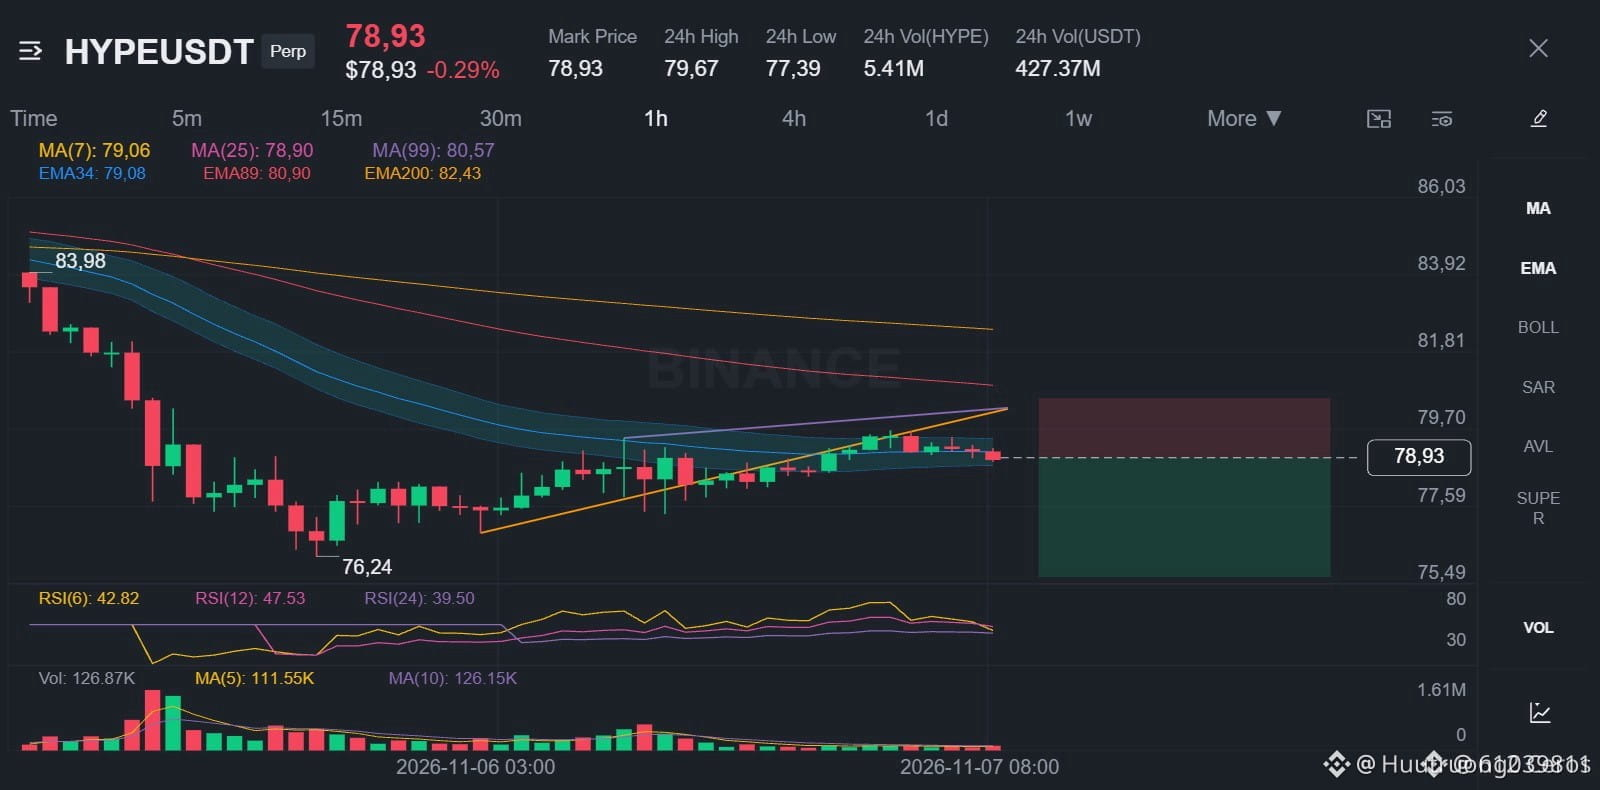
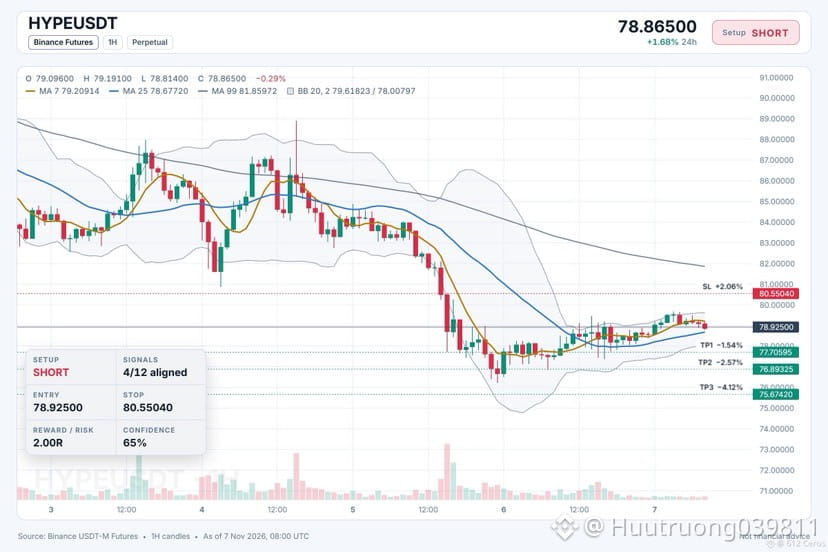
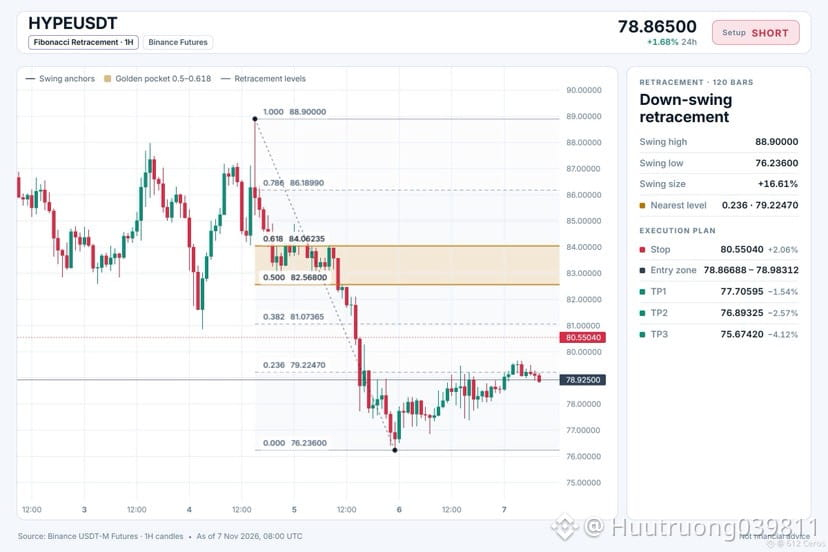
🔴 $HYPE /USDT · Bias: SHORT
4h and 1h bearish stacks keep price under both EMAs.
Entry: 78.86688 – 78.98312
TP1: 77.70595 (-1.5%)
TP2: 76.89325 (-2.6%)
TP3: 75.67420 (-4.1%)
SL: 80.55040 (+2.1%)
Note: moderate conviction only, keep size light.
Why: The 4h trend shows price below EMA50 below EMA200, a bearish stack meaning the swing trend is down.
Plan: close 50% at TP1, 25% at TP2, 25% at TP3, and move the stop to entry after TP1.
Do you see room for more downside from here?
{spot}(HYPEUSDT)
🔴 $HYPE /USDT · Bias: SHORT
4h and 1h bearish stacks keep price under both EMAs.
Entry: 78.86688 – 78.98312
TP1: 77.70595 (-1.5%)
TP2: 76.89325 (-2.6%)
TP3: 75.67420 (-4.1%)
SL: 80.55040 (+2.1%)
Note: moderate conviction only, keep size light.
Why: The 4h trend shows price below EMA50 below EMA200, a bearish stack meaning the swing trend is down.
Plan: close 50% at TP1, 25% at TP2, 25% at TP3, and move the stop to entry after TP1.
Do you see room for more downside from here?
4h and 1h bearish stacks keep price under both EMAs.
Entry: 78.86688 – 78.98312
TP1: 77.70595 (-1.5%)
TP2: 76.89325 (-2.6%)
TP3: 75.67420 (-4.1%)
SL: 80.55040 (+2.1%)
Note: moderate conviction only, keep size light.
Why: The 4h trend shows price below EMA50 below EMA200, a bearish stack meaning the swing trend is down.
Plan: close 50% at TP1, 25% at TP2, 25% at TP3, and move the stop to entry after TP1.
Do you see room for more downside from here?
7
·
--
Azalma
Tərcüməyə bax
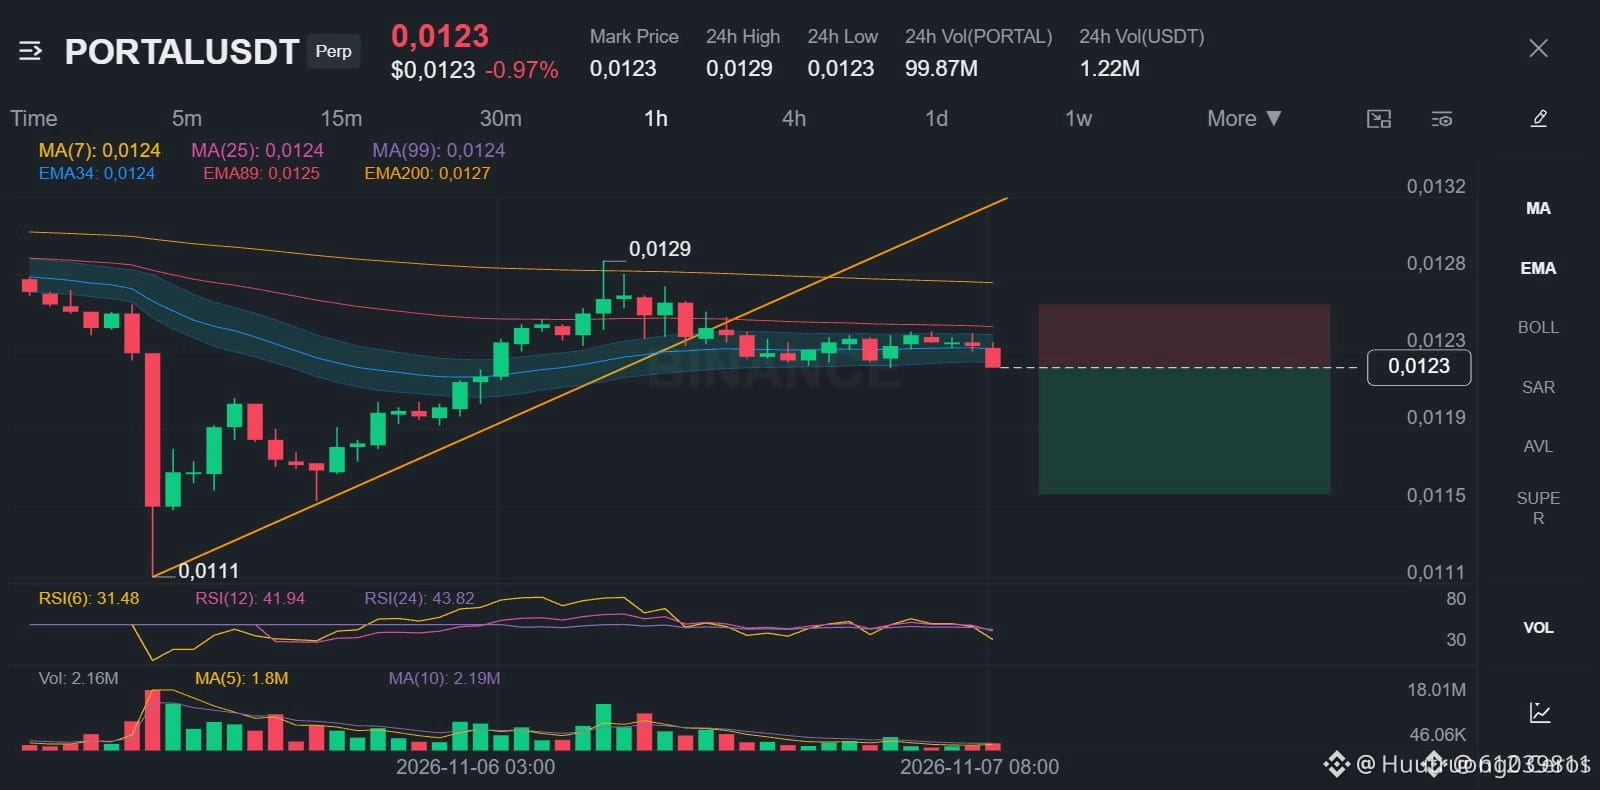
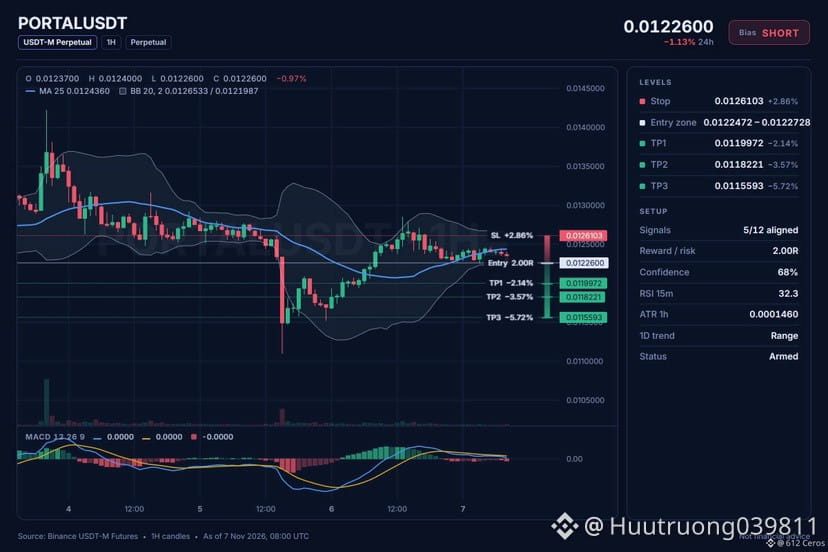
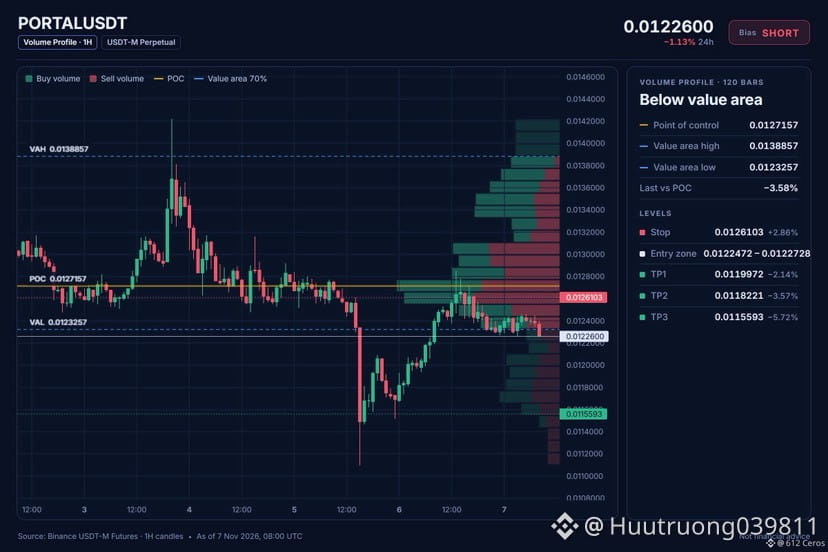
🔴 $PORTAL /USDT · Bias: SHORT
Four-hour trend shows bearish stack pushing price lower.
Entry: 0.0122472 – 0.0122728
TP1: 0.0119972 (-2.1%)
TP2: 0.0118221 (-3.6%)
TP3: 0.0115593 (-5.7%)
SL: 0.0126103 (+2.9%)
Note: moderate conviction only, keep size light.
Why: The 4h trend shows price below EMA50 and EMA200 in a bearish stack, meaning the swing trend is down.
Plan: close 50% at TP1, 25% at TP2, 25% at TP3, and move the stop to entry after TP1.
Where do you see price going from here?
{spot}(PORTALUSDT)
🔴 $PORTAL /USDT · Bias: SHORT
Four-hour trend shows bearish stack pushing price lower.
Entry: 0.0122472 – 0.0122728
TP1: 0.0119972 (-2.1%)
TP2: 0.0118221 (-3.6%)
TP3: 0.0115593 (-5.7%)
SL: 0.0126103 (+2.9%)
Note: moderate conviction only, keep size light.
Why: The 4h trend shows price below EMA50 and EMA200 in a bearish stack, meaning the swing trend is down.
Plan: close 50% at TP1, 25% at TP2, 25% at TP3, and move the stop to entry after TP1.
Where do you see price going from here?
Four-hour trend shows bearish stack pushing price lower.
Entry: 0.0122472 – 0.0122728
TP1: 0.0119972 (-2.1%)
TP2: 0.0118221 (-3.6%)
TP3: 0.0115593 (-5.7%)
SL: 0.0126103 (+2.9%)
Note: moderate conviction only, keep size light.
Why: The 4h trend shows price below EMA50 and EMA200 in a bearish stack, meaning the swing trend is down.
Plan: close 50% at TP1, 25% at TP2, 25% at TP3, and move the stop to entry after TP1.
Where do you see price going from here?
7
·
--
Azalma
Tərcüməyə bax
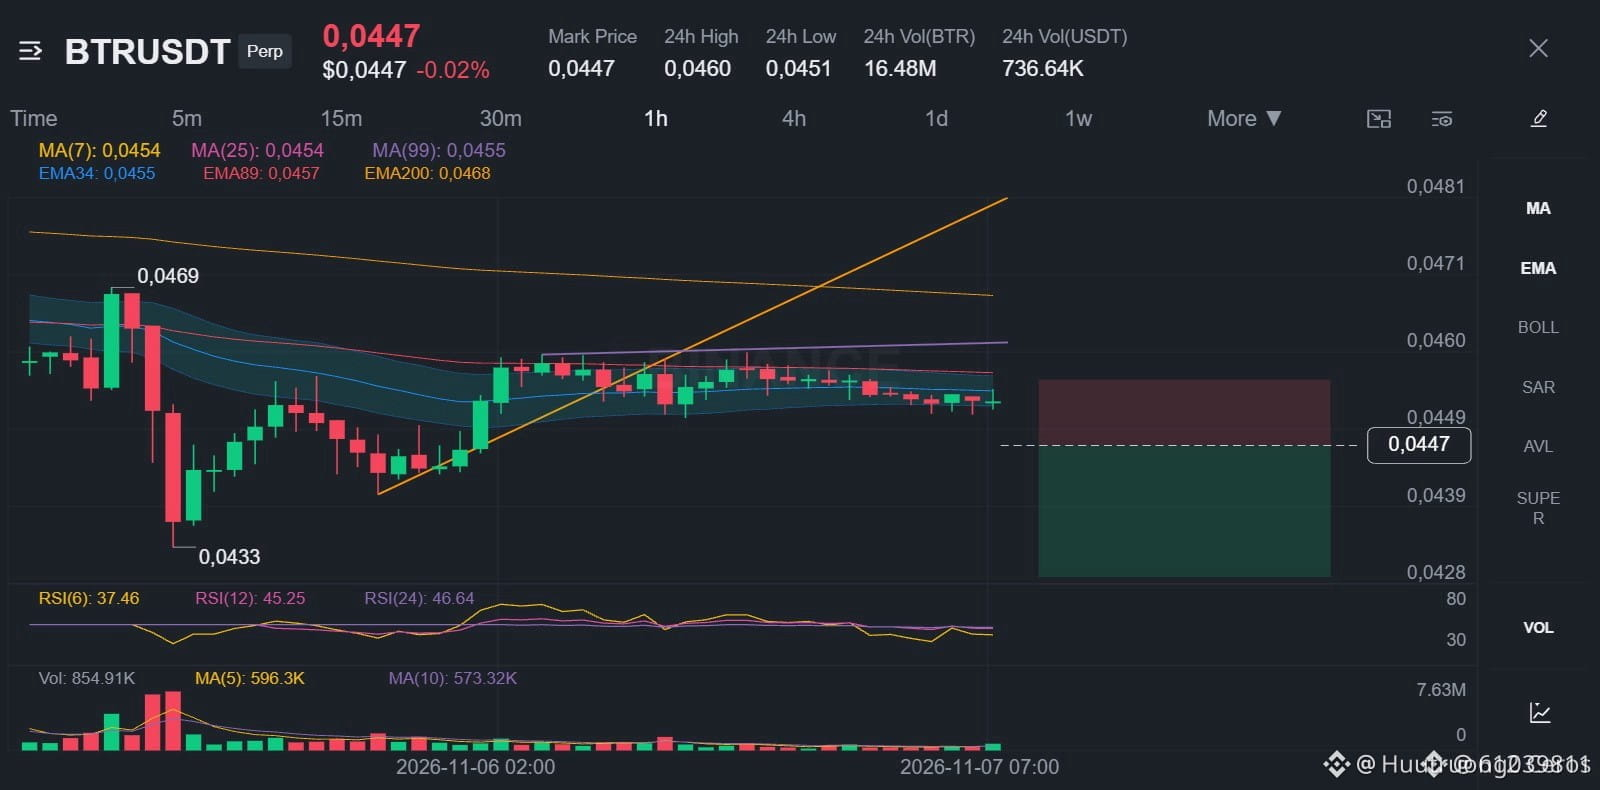
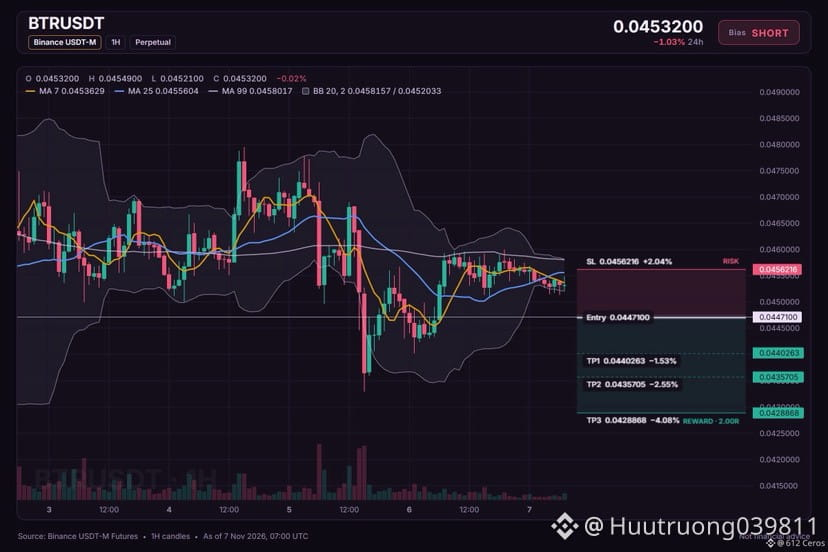
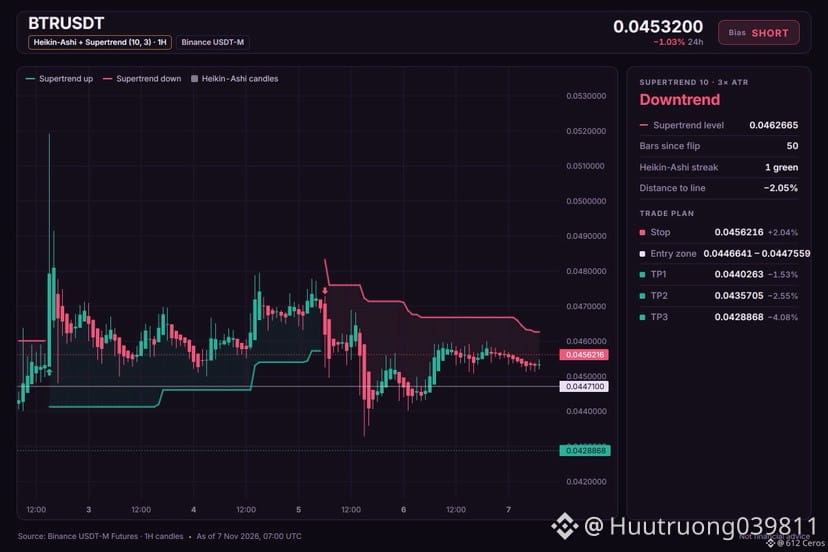
🔴 $BTR /USDT · Bias: SHORT
BTR keeps a bearish stack across daily, 4h and 1h timeframes.
Entry: 0.0446641 – 0.0447559
TP1: 0.0440263 (-1.5%)
TP2: 0.0435705 (-2.5%)
TP3: 0.0428868 (-4.1%)
SL: 0.0456216 (+2.0%)
Why: The daily trend shows price below both EMAs, a bearish stack that means the big-picture trend is down.
Risk: Range bottom, buyers often step in (RSI z −2.40)
Plan: close 50% at TP1, 25% at TP2, 25% at TP3, and move the stop to entry after TP1.
Where do you see this trade heading?
{future}(BTRUSDT)
🔴 $BTR /USDT · Bias: SHORT
BTR keeps a bearish stack across daily, 4h and 1h timeframes.
Entry: 0.0446641 – 0.0447559
TP1: 0.0440263 (-1.5%)
TP2: 0.0435705 (-2.5%)
TP3: 0.0428868 (-4.1%)
SL: 0.0456216 (+2.0%)
Why: The daily trend shows price below both EMAs, a bearish stack that means the big-picture trend is down.
Risk: Range bottom, buyers often step in (RSI z −2.40)
Plan: close 50% at TP1, 25% at TP2, 25% at TP3, and move the stop to entry after TP1.
Where do you see this trade heading?
BTR keeps a bearish stack across daily, 4h and 1h timeframes.
Entry: 0.0446641 – 0.0447559
TP1: 0.0440263 (-1.5%)
TP2: 0.0435705 (-2.5%)
TP3: 0.0428868 (-4.1%)
SL: 0.0456216 (+2.0%)
Why: The daily trend shows price below both EMAs, a bearish stack that means the big-picture trend is down.
Risk: Range bottom, buyers often step in (RSI z −2.40)
Plan: close 50% at TP1, 25% at TP2, 25% at TP3, and move the stop to entry after TP1.
Where do you see this trade heading?
9
·
--
Azalma
Tərcüməyə bax
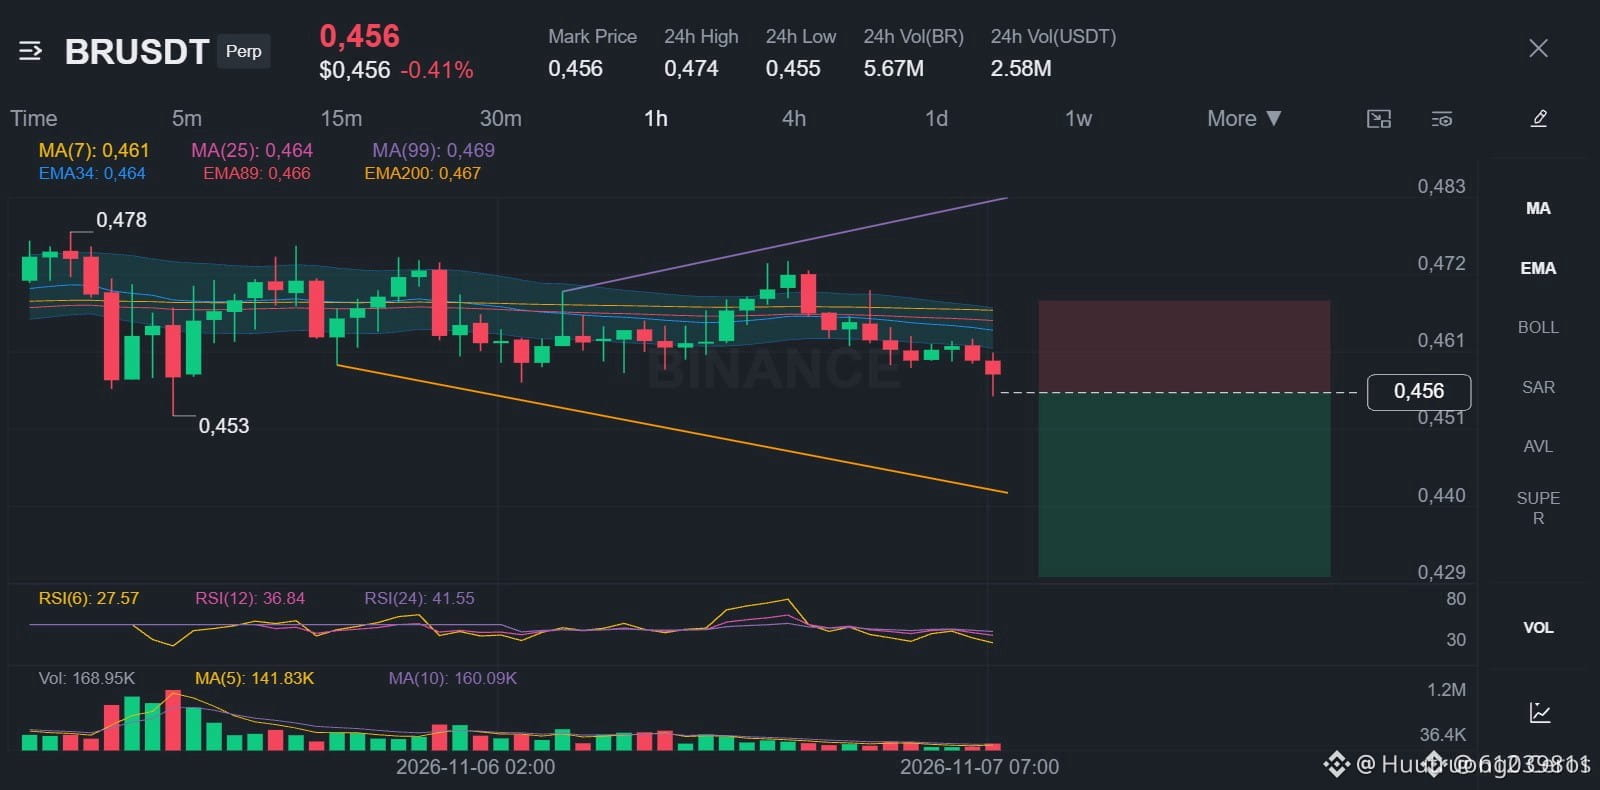
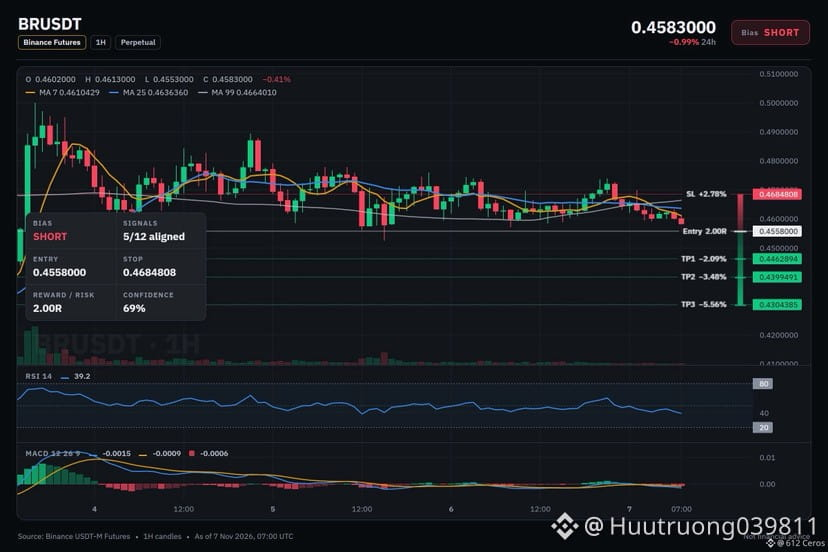
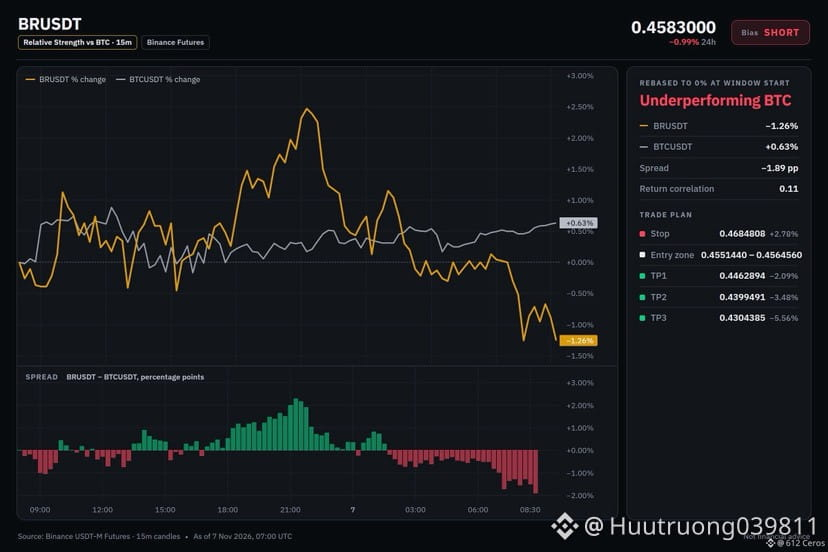
🔴 $BR /USDT · Bias: SHORT
BR 1h trend points lower in a bearish stack.
Entry: 0.4551440 – 0.4564560
TP1: 0.4462894 (-2.1%)
TP2: 0.4399491 (-3.5%)
TP3: 0.4304385 (-5.6%)
SL: 0.4684808 (+2.8%)
Note: moderate conviction only, keep size light.
Why: ADX 24.8 shows sellers in control, meaning the move is driven by selling pressure.
Plan: close 50% at TP1, 25% at TP2, 25% at TP3, and move the stop to entry after TP1.
Do you see room for more downside here?
{future}(BRUSDT)
🔴 $BR /USDT · Bias: SHORT
BR 1h trend points lower in a bearish stack.
Entry: 0.4551440 – 0.4564560
TP1: 0.4462894 (-2.1%)
TP2: 0.4399491 (-3.5%)
TP3: 0.4304385 (-5.6%)
SL: 0.4684808 (+2.8%)
Note: moderate conviction only, keep size light.
Why: ADX 24.8 shows sellers in control, meaning the move is driven by selling pressure.
Plan: close 50% at TP1, 25% at TP2, 25% at TP3, and move the stop to entry after TP1.
Do you see room for more downside here?
BR 1h trend points lower in a bearish stack.
Entry: 0.4551440 – 0.4564560
TP1: 0.4462894 (-2.1%)
TP2: 0.4399491 (-3.5%)
TP3: 0.4304385 (-5.6%)
SL: 0.4684808 (+2.8%)
Note: moderate conviction only, keep size light.
Why: ADX 24.8 shows sellers in control, meaning the move is driven by selling pressure.
Plan: close 50% at TP1, 25% at TP2, 25% at TP3, and move the stop to entry after TP1.
Do you see room for more downside here?
35
·
--
Azalma
Tərcüməyə bax
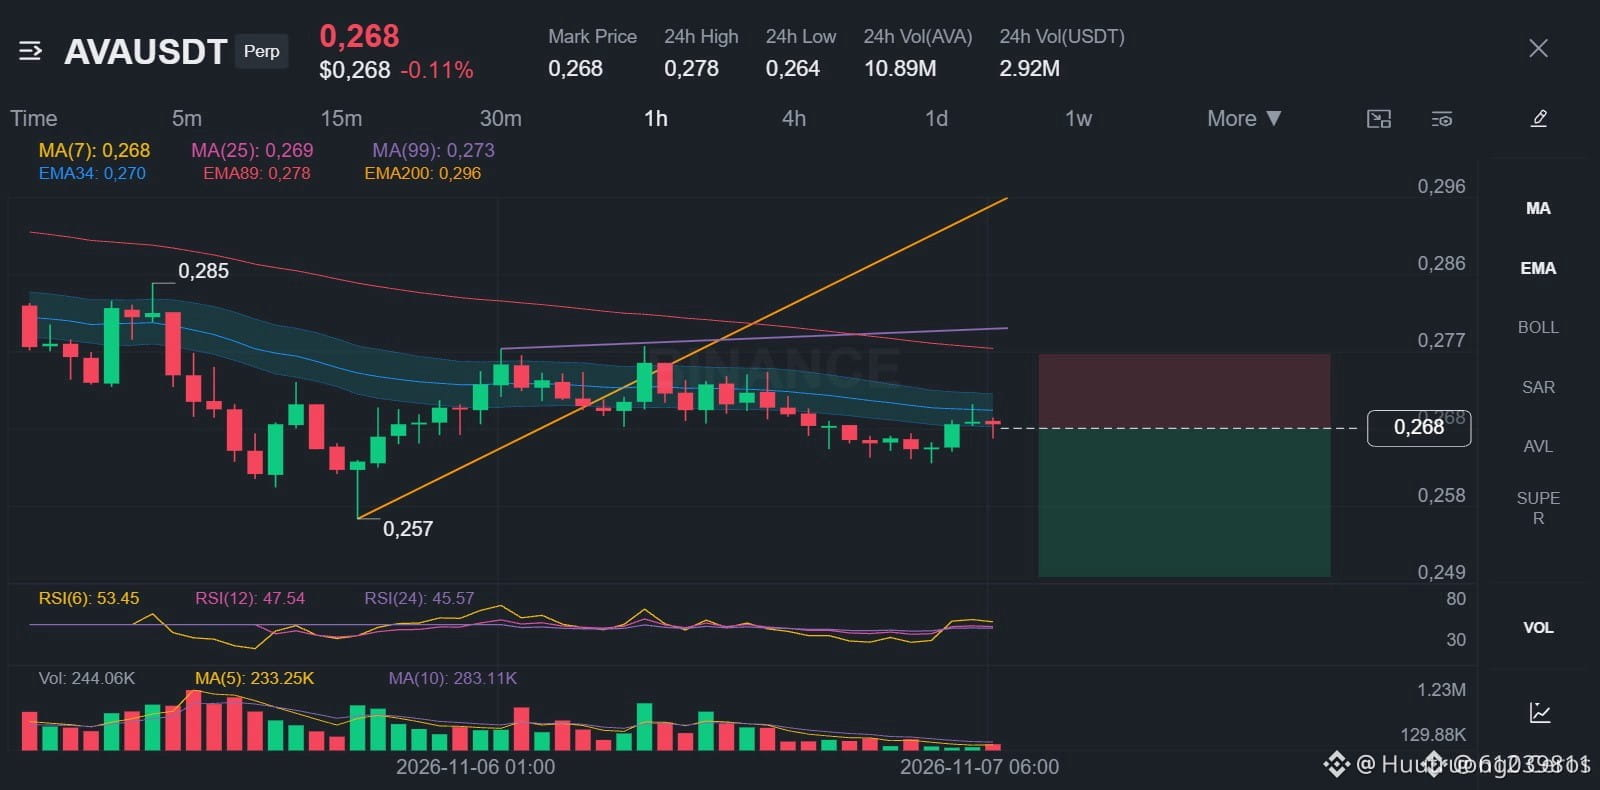
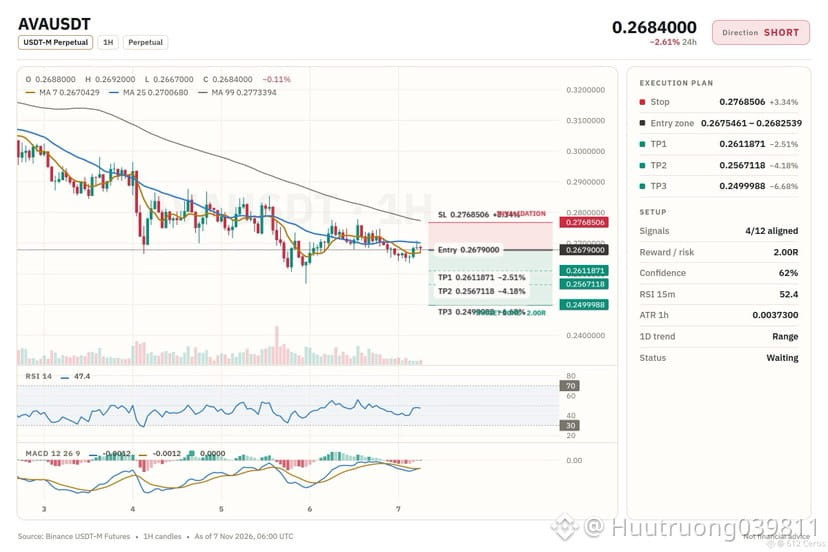
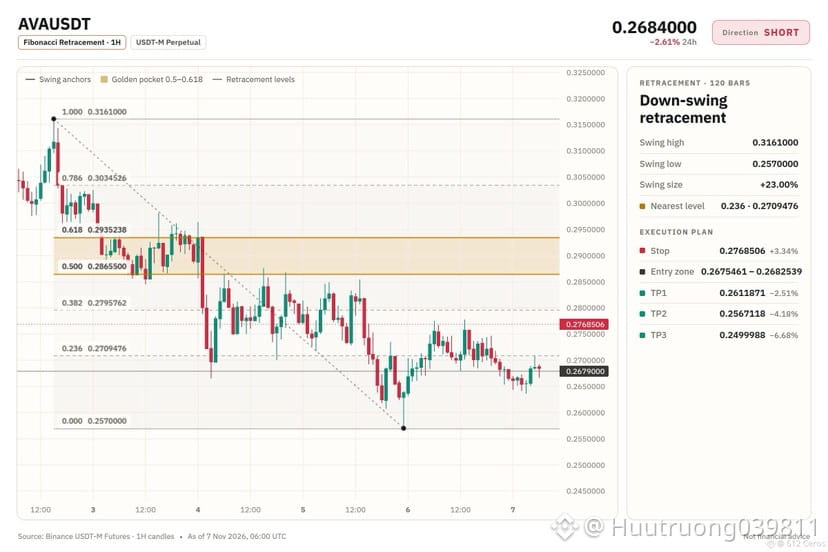
🔴 $AVA /USDT · Bias: SHORT
AVA is in a bearish stack on the 4h timeframe, pointing lower.
Entry: 0.2675461 – 0.2682539
TP1: 0.2611871 (-2.5%)
TP2: 0.2567118 (-4.2%)
TP3: 0.2499988 (-6.7%)
SL: 0.2768506 (+3.3%)
Note: moderate conviction only, keep size light.
Why: The 4h trend shows price below EMA50 and EMA200, a bearish stack meaning the swing trend is down.
Risk: Buyers are pushing right now (+0.26% 15m candle)
Plan: close 50% at TP1, 25% at TP2, 25% at TP3, and move the stop to entry after TP1.
Do you think price stays below the entry level here?
{spot}(AVAUSDT)
🔴 $AVA /USDT · Bias: SHORT
AVA is in a bearish stack on the 4h timeframe, pointing lower.
Entry: 0.2675461 – 0.2682539
TP1: 0.2611871 (-2.5%)
TP2: 0.2567118 (-4.2%)
TP3: 0.2499988 (-6.7%)
SL: 0.2768506 (+3.3%)
Note: moderate conviction only, keep size light.
Why: The 4h trend shows price below EMA50 and EMA200, a bearish stack meaning the swing trend is down.
Risk: Buyers are pushing right now (+0.26% 15m candle)
Plan: close 50% at TP1, 25% at TP2, 25% at TP3, and move the stop to entry after TP1.
Do you think price stays below the entry level here?
AVA is in a bearish stack on the 4h timeframe, pointing lower.
Entry: 0.2675461 – 0.2682539
TP1: 0.2611871 (-2.5%)
TP2: 0.2567118 (-4.2%)
TP3: 0.2499988 (-6.7%)
SL: 0.2768506 (+3.3%)
Note: moderate conviction only, keep size light.
Why: The 4h trend shows price below EMA50 and EMA200, a bearish stack meaning the swing trend is down.
Risk: Buyers are pushing right now (+0.26% 15m candle)
Plan: close 50% at TP1, 25% at TP2, 25% at TP3, and move the stop to entry after TP1.
Do you think price stays below the entry level here?
36
·
--
Azalma
Tərcüməyə bax
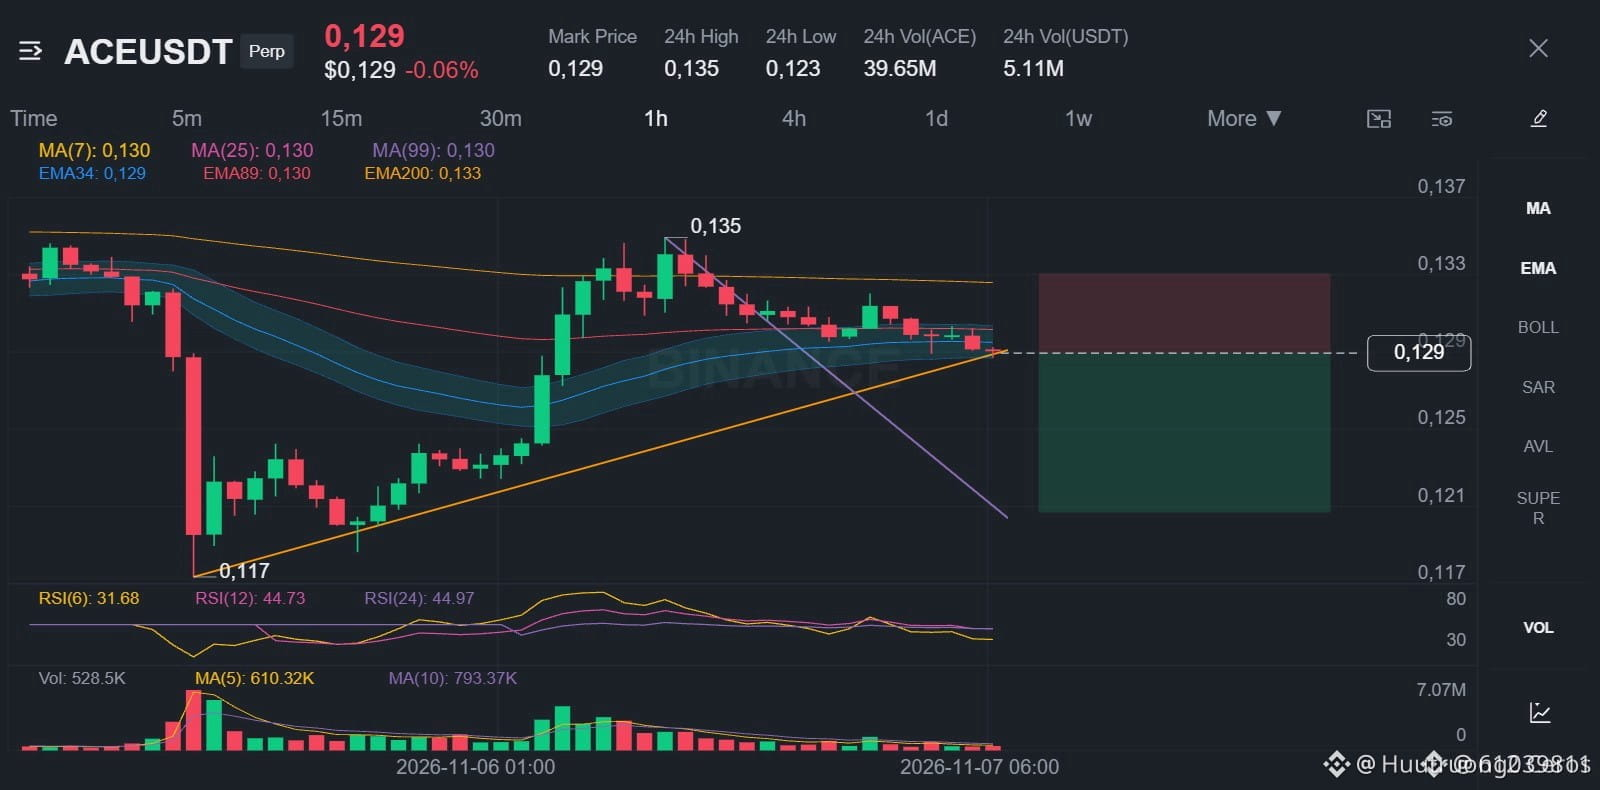
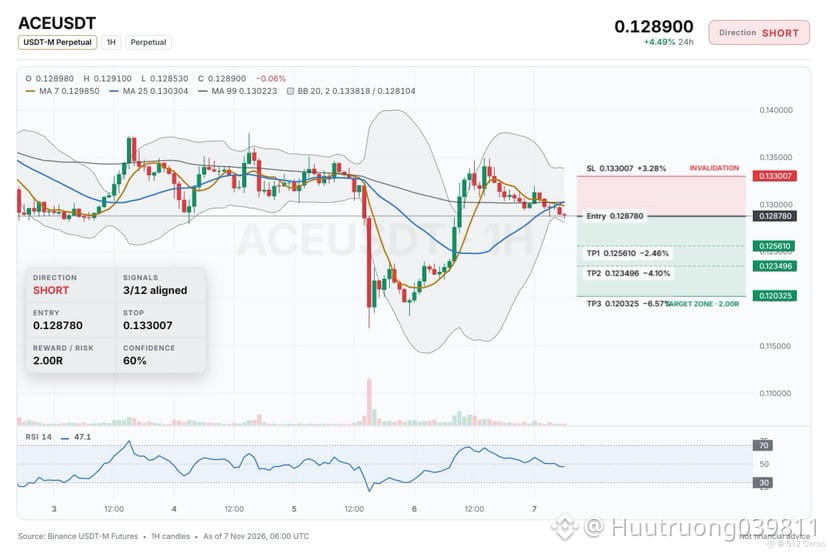
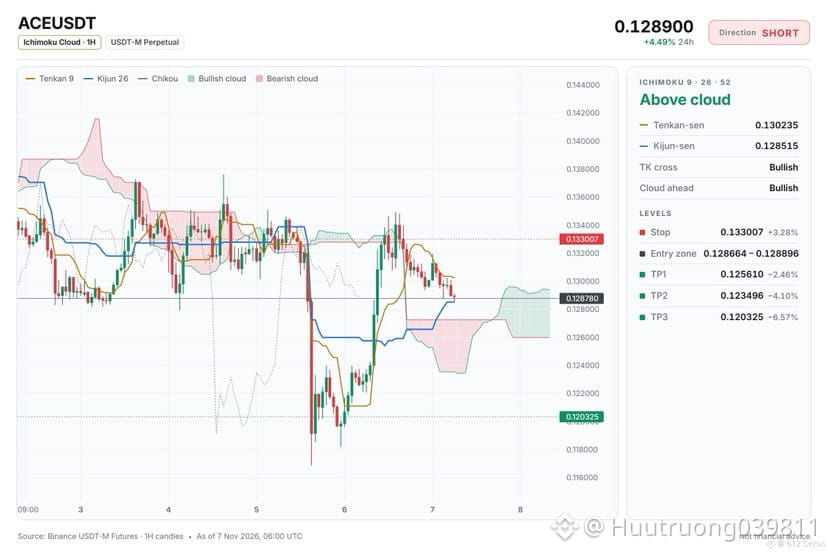
🔴 $ACE /USDT · Bias: SHORT
ACE is in a bearish stack on the 4h timeframe, pointing lower.
Entry: 0.128664 – 0.128896
TP1: 0.125610 (-2.5%)
TP2: 0.123496 (-4.1%)
TP3: 0.120325 (-6.6%)
SL: 0.133007 (+3.3%)
Note: moderate conviction only, keep size light.
Why: The 4h trend shows price below EMA50 below EMA200, a bearish stack meaning the swing trend is down.
Risk: Stronger than BTC (+3.34% 24h vs BTC)
Plan: close 50% at TP1, 25% at TP2, 25% at TP3, and move the stop to entry after TP1.
Do you think this short setup is worth taking?
{spot}(ACEUSDT)
🔴 $ACE /USDT · Bias: SHORT
ACE is in a bearish stack on the 4h timeframe, pointing lower.
Entry: 0.128664 – 0.128896
TP1: 0.125610 (-2.5%)
TP2: 0.123496 (-4.1%)
TP3: 0.120325 (-6.6%)
SL: 0.133007 (+3.3%)
Note: moderate conviction only, keep size light.
Why: The 4h trend shows price below EMA50 below EMA200, a bearish stack meaning the swing trend is down.
Risk: Stronger than BTC (+3.34% 24h vs BTC)
Plan: close 50% at TP1, 25% at TP2, 25% at TP3, and move the stop to entry after TP1.
Do you think this short setup is worth taking?
ACE is in a bearish stack on the 4h timeframe, pointing lower.
Entry: 0.128664 – 0.128896
TP1: 0.125610 (-2.5%)
TP2: 0.123496 (-4.1%)
TP3: 0.120325 (-6.6%)
SL: 0.133007 (+3.3%)
Note: moderate conviction only, keep size light.
Why: The 4h trend shows price below EMA50 below EMA200, a bearish stack meaning the swing trend is down.
Risk: Stronger than BTC (+3.34% 24h vs BTC)
Plan: close 50% at TP1, 25% at TP2, 25% at TP3, and move the stop to entry after TP1.
Do you think this short setup is worth taking?
60
·
--
Artım
Tərcüməyə bax
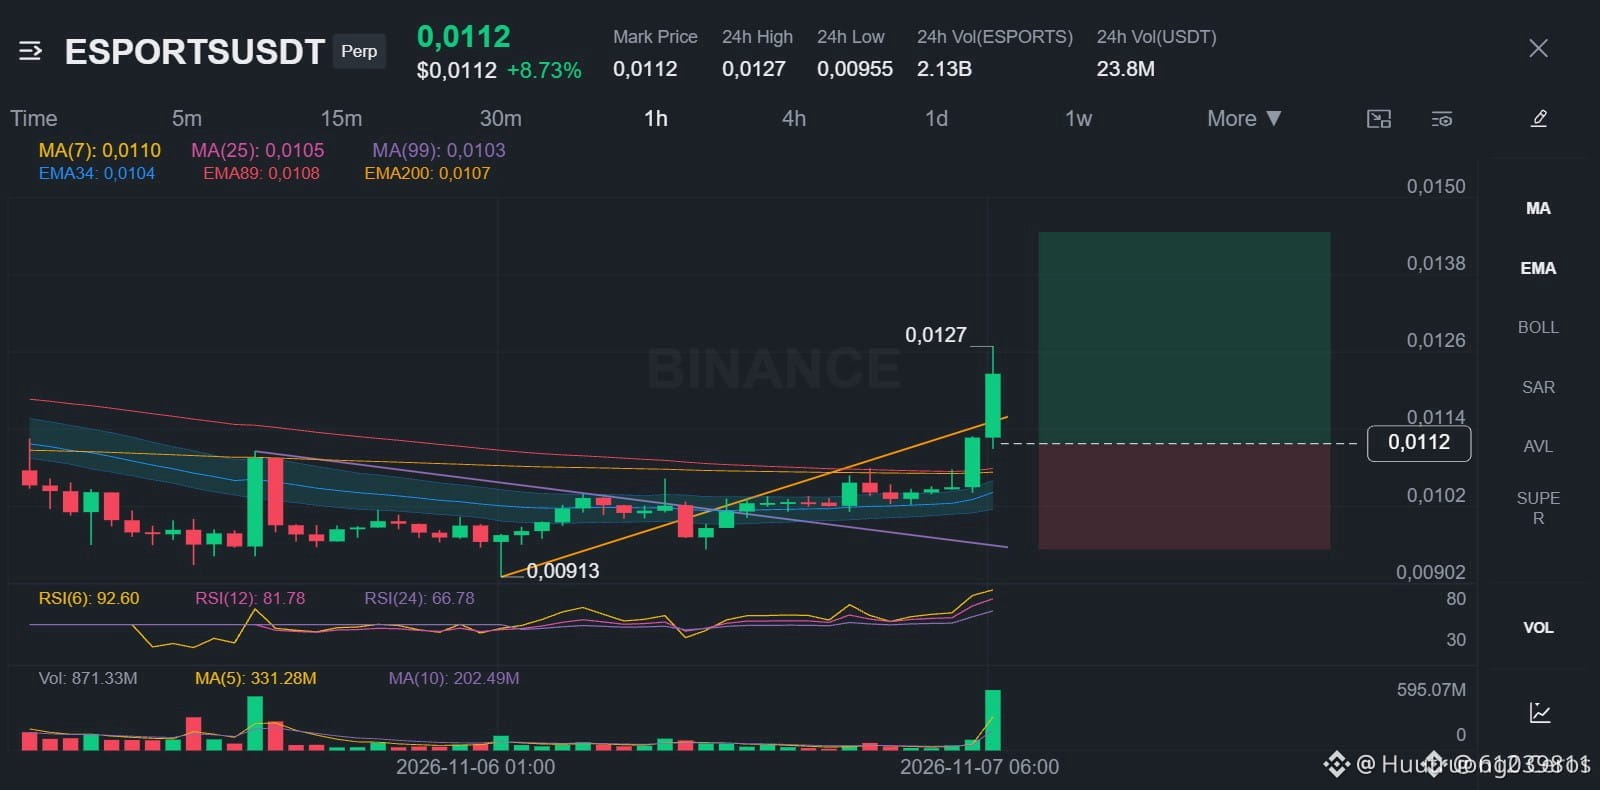
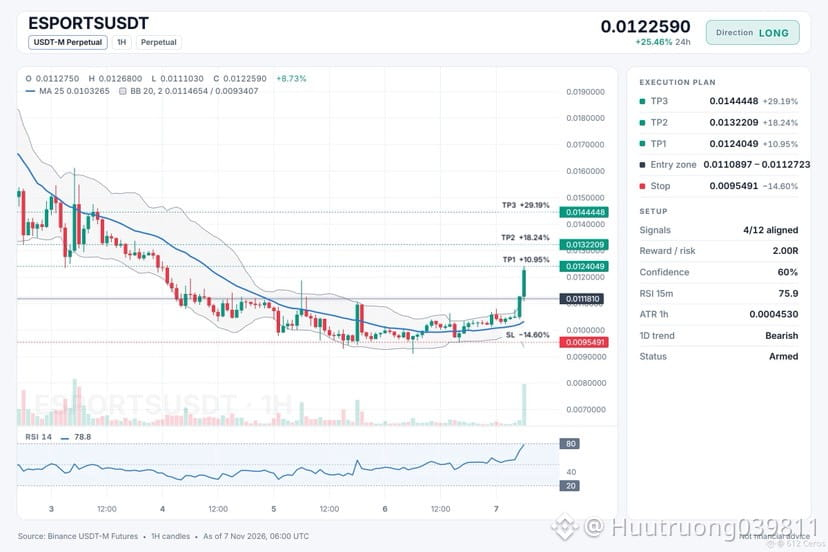
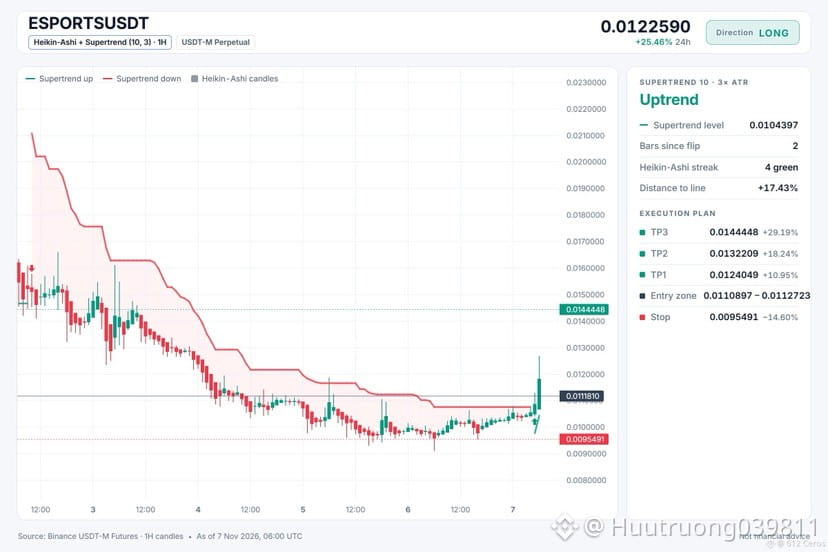
🟢 $ESPORTS /USDT · Bias: LONG
The 1h and 4h trends show bullish stacks pushing price higher.
Entry: 0.0110897 – 0.0112723
TP1: 0.0124049 (+10.9%)
TP2: 0.0132209 (+18.2%)
TP3: 0.0144448 (+29.2%)
SL: 0.0095491 (-14.6%)
Caution: counter-trend idea backed by 4 signals only. Smaller size, hard stop.
Why: The 1h bullish stack means the short-term trend is up, and buyers are driving the move with strong momentum.
Risk: Price ran hot, pullbacks are common from here (1h RSI 78.8, overbought)
Plan: close 50% at TP1, 25% at TP2, 25% at TP3, and move the stop to entry after TP1.
Do you see this as a valid reversal entry?
{future}(ESPORTSUSDT)
🟢 $ESPORTS /USDT · Bias: LONG
The 1h and 4h trends show bullish stacks pushing price higher.
Entry: 0.0110897 – 0.0112723
TP1: 0.0124049 (+10.9%)
TP2: 0.0132209 (+18.2%)
TP3: 0.0144448 (+29.2%)
SL: 0.0095491 (-14.6%)
Caution: counter-trend idea backed by 4 signals only. Smaller size, hard stop.
Why: The 1h bullish stack means the short-term trend is up, and buyers are driving the move with strong momentum.
Risk: Price ran hot, pullbacks are common from here (1h RSI 78.8, overbought)
Plan: close 50% at TP1, 25% at TP2, 25% at TP3, and move the stop to entry after TP1.
Do you see this as a valid reversal entry?
The 1h and 4h trends show bullish stacks pushing price higher.
Entry: 0.0110897 – 0.0112723
TP1: 0.0124049 (+10.9%)
TP2: 0.0132209 (+18.2%)
TP3: 0.0144448 (+29.2%)
SL: 0.0095491 (-14.6%)
Caution: counter-trend idea backed by 4 signals only. Smaller size, hard stop.
Why: The 1h bullish stack means the short-term trend is up, and buyers are driving the move with strong momentum.
Risk: Price ran hot, pullbacks are common from here (1h RSI 78.8, overbought)
Plan: close 50% at TP1, 25% at TP2, 25% at TP3, and move the stop to entry after TP1.
Do you see this as a valid reversal entry?
63
·
--
Azalma
Tərcüməyə bax
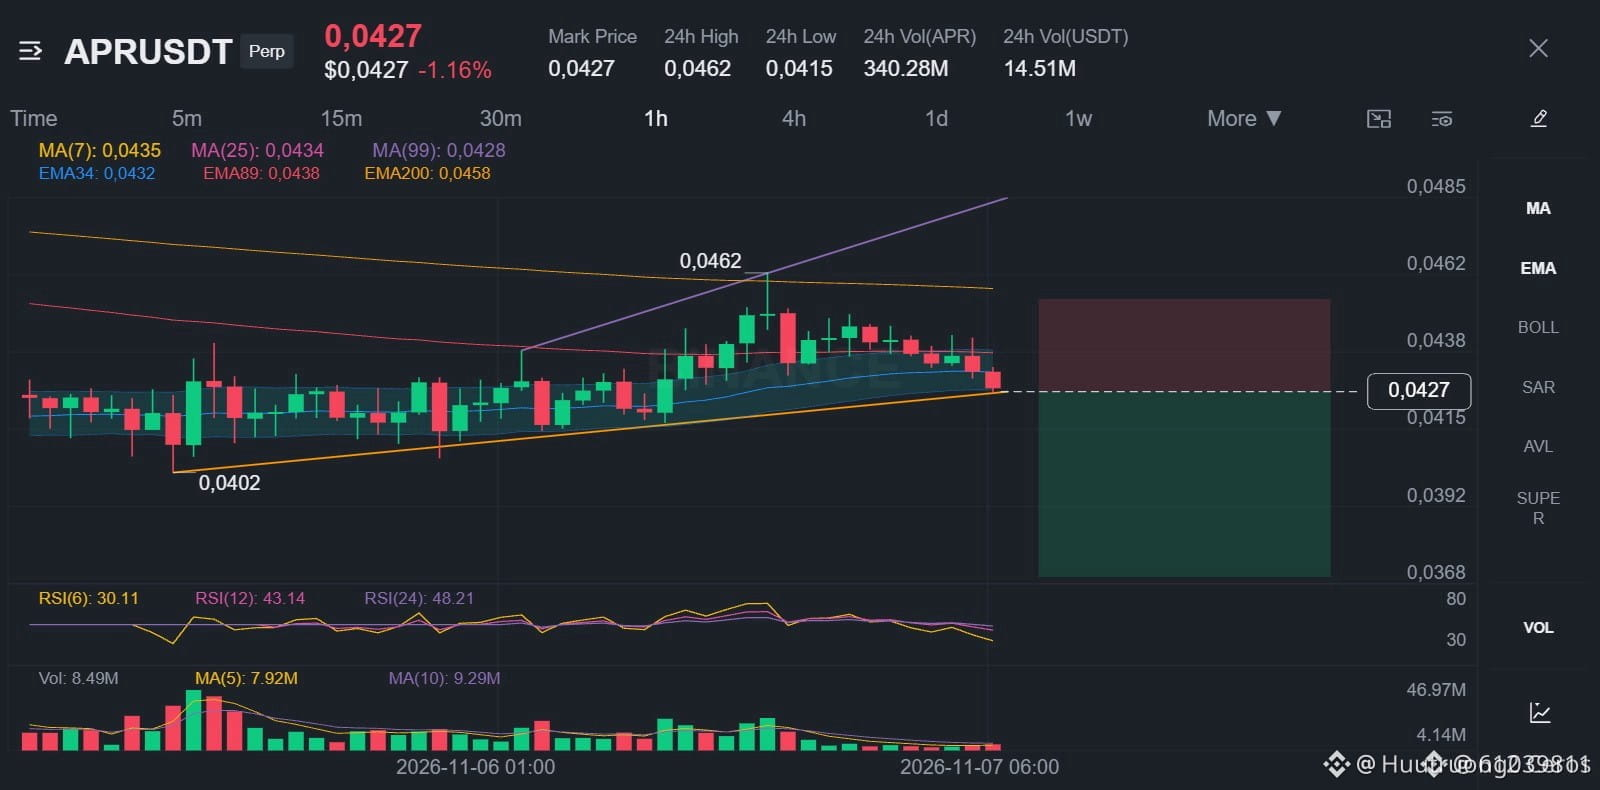
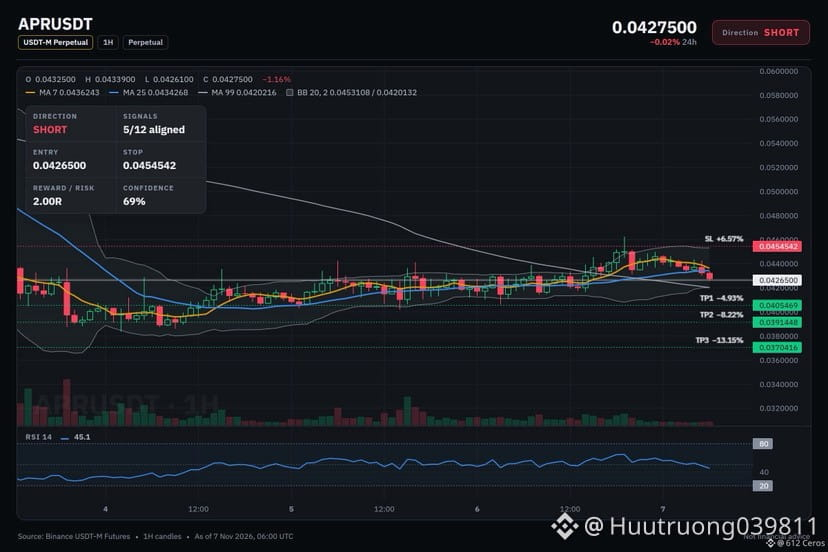
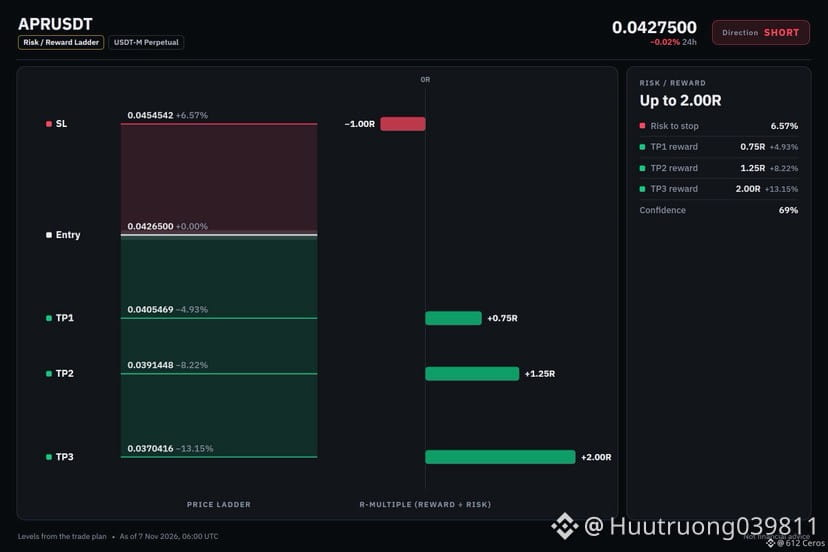
🔴 $APR /USDT · Bias: SHORT
The daily, 4h and 1h trends all point lower for APR, a bearish stack.
Entry: 0.0425272 – 0.0427728
TP1: 0.0405469 (-4.9%)
TP2: 0.0391448 (-8.2%)
TP3: 0.0370416 (-13.1%)
SL: 0.0454542 (+6.6%)
Note: moderate conviction only, keep size light.
Why: Daily trend: price below EMA50 below EMA200, bearish stack, meaning the big-picture trend is down.
Risk: Range bottom, buyers often step in (RSI z −3.26)
Plan: close 50% at TP1, 25% at TP2, 25% at TP3, and move the stop to entry after TP1.
Do you see a clean short entry here?
{future}(APRUSDT)
🔴 $APR /USDT · Bias: SHORT
The daily, 4h and 1h trends all point lower for APR, a bearish stack.
Entry: 0.0425272 – 0.0427728
TP1: 0.0405469 (-4.9%)
TP2: 0.0391448 (-8.2%)
TP3: 0.0370416 (-13.1%)
SL: 0.0454542 (+6.6%)
Note: moderate conviction only, keep size light.
Why: Daily trend: price below EMA50 below EMA200, bearish stack, meaning the big-picture trend is down.
Risk: Range bottom, buyers often step in (RSI z −3.26)
Plan: close 50% at TP1, 25% at TP2, 25% at TP3, and move the stop to entry after TP1.
Do you see a clean short entry here?
The daily, 4h and 1h trends all point lower for APR, a bearish stack.
Entry: 0.0425272 – 0.0427728
TP1: 0.0405469 (-4.9%)
TP2: 0.0391448 (-8.2%)
TP3: 0.0370416 (-13.1%)
SL: 0.0454542 (+6.6%)
Note: moderate conviction only, keep size light.
Why: Daily trend: price below EMA50 below EMA200, bearish stack, meaning the big-picture trend is down.
Risk: Range bottom, buyers often step in (RSI z −3.26)
Plan: close 50% at TP1, 25% at TP2, 25% at TP3, and move the stop to entry after TP1.
Do you see a clean short entry here?
80
Tərcüməyə bax
#BinancePick 🚀 Exploring new opportunities in Web3 with Binance! Every step is a chance to learn, grow, and earn. 💎
What’s your favorite crypto project? 👇
#BinancePick 🚀 Exploring new opportunities in Web3 with Binance! Every step is a chance to learn, grow, and earn. 💎
What’s your favorite crypto project? 👇
What’s your favorite crypto project? 👇

8
·
--
Azalma
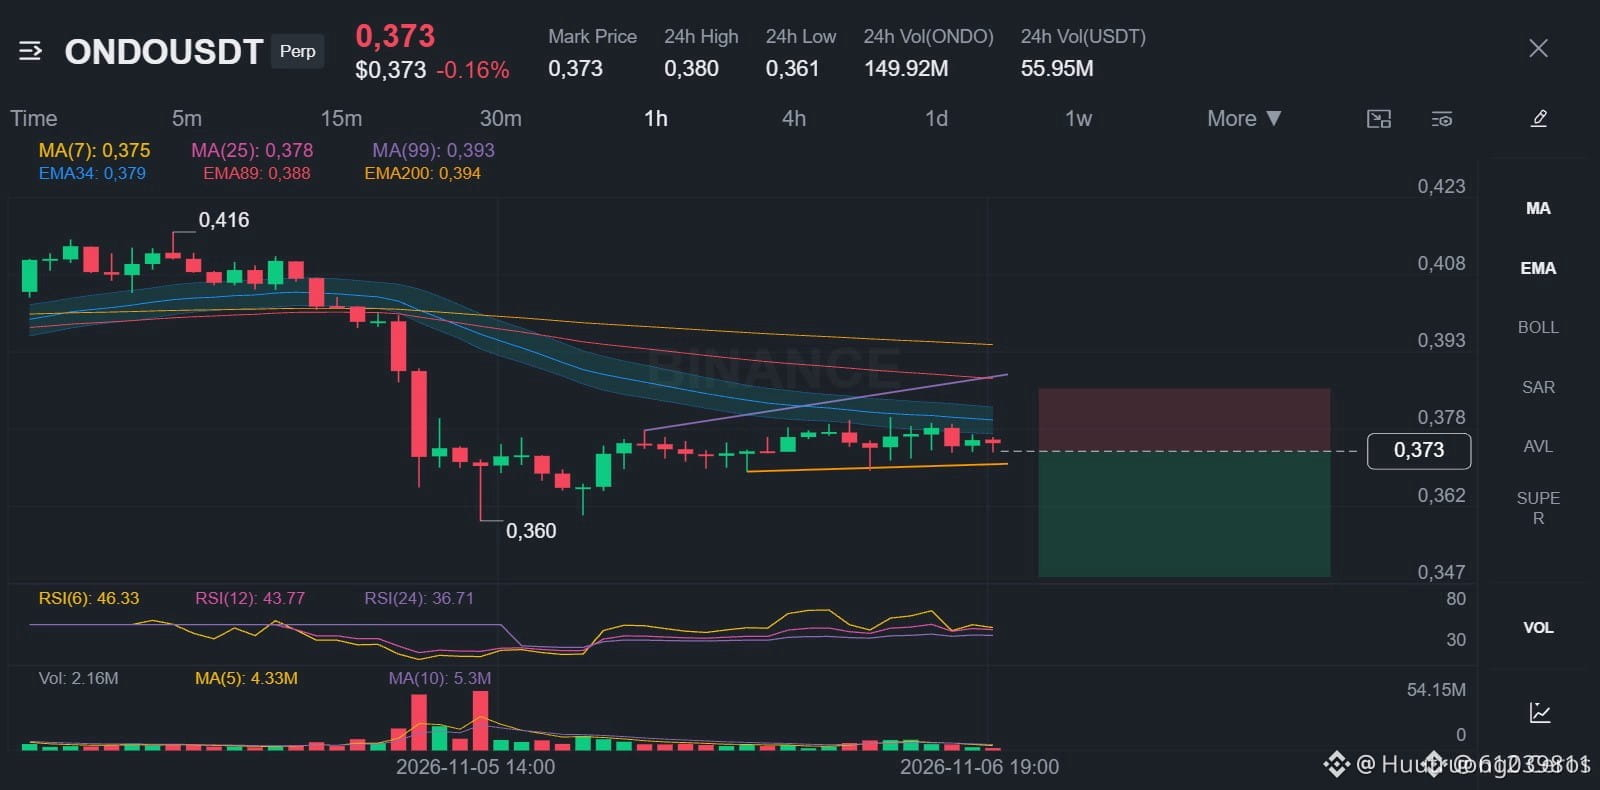
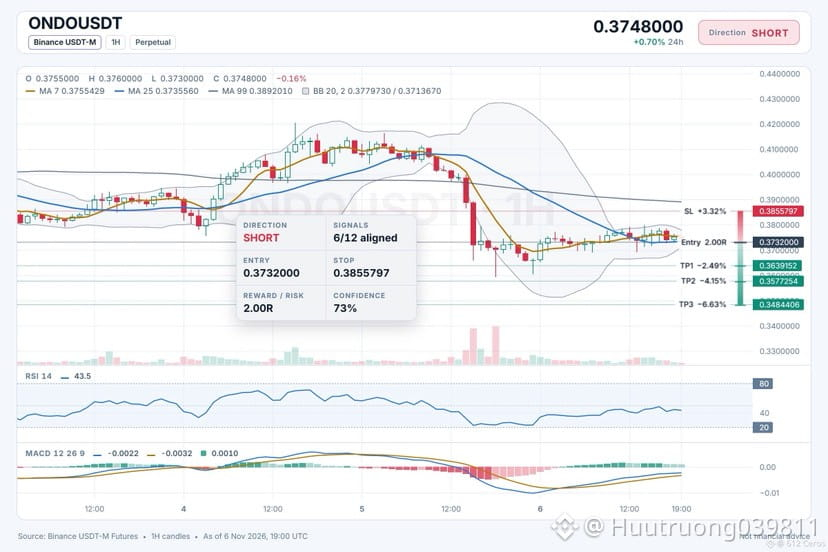
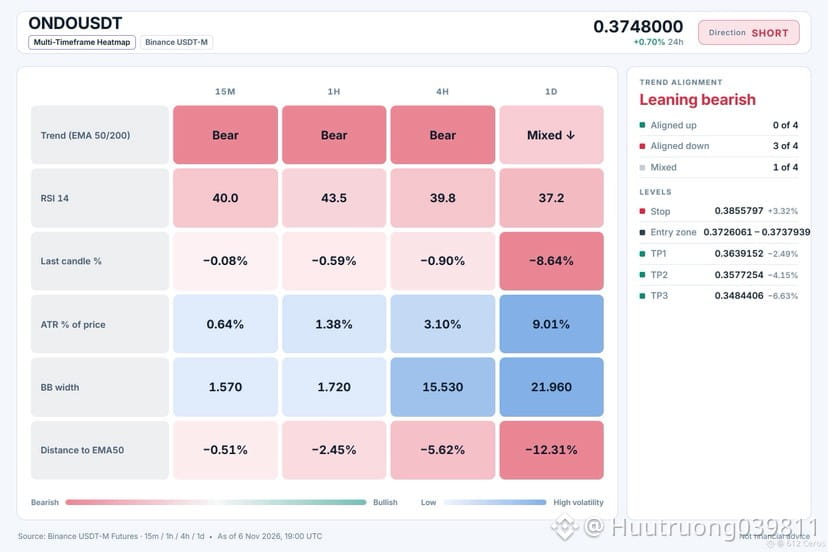
🔴 $ONDO /USDT · İstiqamət: SATIŞ
4 saatlıq qrafikdə qiymət aşağı yönlü EMA düzülüşünün altındadır, buna görə də orta müddətli trend aşağıdır.
Giriş: 0.3726061 – 0.3737939
TP1: 0.3639152 (-2.5%)
TP2: 0.3577254 (-4.1%)
TP3: 0.3484406 (-6.6%)
SL: 0.3855797 (+3.3%)
Səbəb: 4 saatlıq trend qiymətin EMA50 və EMA200-dən aşağı olduğunu göstərir. Bu, orta müddətli trendin aşağı yönlü olduğuna işarə edən ayı düzülüşüdür.
Plan: TP1-də mövqenin 50%-ni, TP2-də 25%-ni, TP3-də 25%-ni bağlayın və TP1-dən sonra stopu giriş səviyyəsinə çəkin.
Giriş zonasından ONDO üçün növbəti hərəkəti necə görürsünüz?
{spot}(ONDOUSDT)
🔴 $ONDO /USDT · İstiqamət: SATIŞ
4 saatlıq qrafikdə qiymət aşağı yönlü EMA düzülüşünün altındadır, buna görə də orta müddətli trend aşağıdır.
Giriş: 0.3726061 – 0.3737939
TP1: 0.3639152 (-2.5%)
TP2: 0.3577254 (-4.1%)
TP3: 0.3484406 (-6.6%)
SL: 0.3855797 (+3.3%)
Səbəb: 4 saatlıq trend qiymətin EMA50 və EMA200-dən aşağı olduğunu göstərir. Bu, orta müddətli trendin aşağı yönlü olduğuna işarə edən ayı düzülüşüdür.
Plan: TP1-də mövqenin 50%-ni, TP2-də 25%-ni, TP3-də 25%-ni bağlayın və TP1-dən sonra stopu giriş səviyyəsinə çəkin.
Giriş zonasından ONDO üçün növbəti hərəkəti necə görürsünüz?
4 saatlıq qrafikdə qiymət aşağı yönlü EMA düzülüşünün altındadır, buna görə də orta müddətli trend aşağıdır.
Giriş: 0.3726061 – 0.3737939
TP1: 0.3639152 (-2.5%)
TP2: 0.3577254 (-4.1%)
TP3: 0.3484406 (-6.6%)
SL: 0.3855797 (+3.3%)
Səbəb: 4 saatlıq trend qiymətin EMA50 və EMA200-dən aşağı olduğunu göstərir. Bu, orta müddətli trendin aşağı yönlü olduğuna işarə edən ayı düzülüşüdür.
Plan: TP1-də mövqenin 50%-ni, TP2-də 25%-ni, TP3-də 25%-ni bağlayın və TP1-dən sonra stopu giriş səviyyəsinə çəkin.
Giriş zonasından ONDO üçün növbəti hərəkəti necə görürsünüz?
23
·
--
Azalma
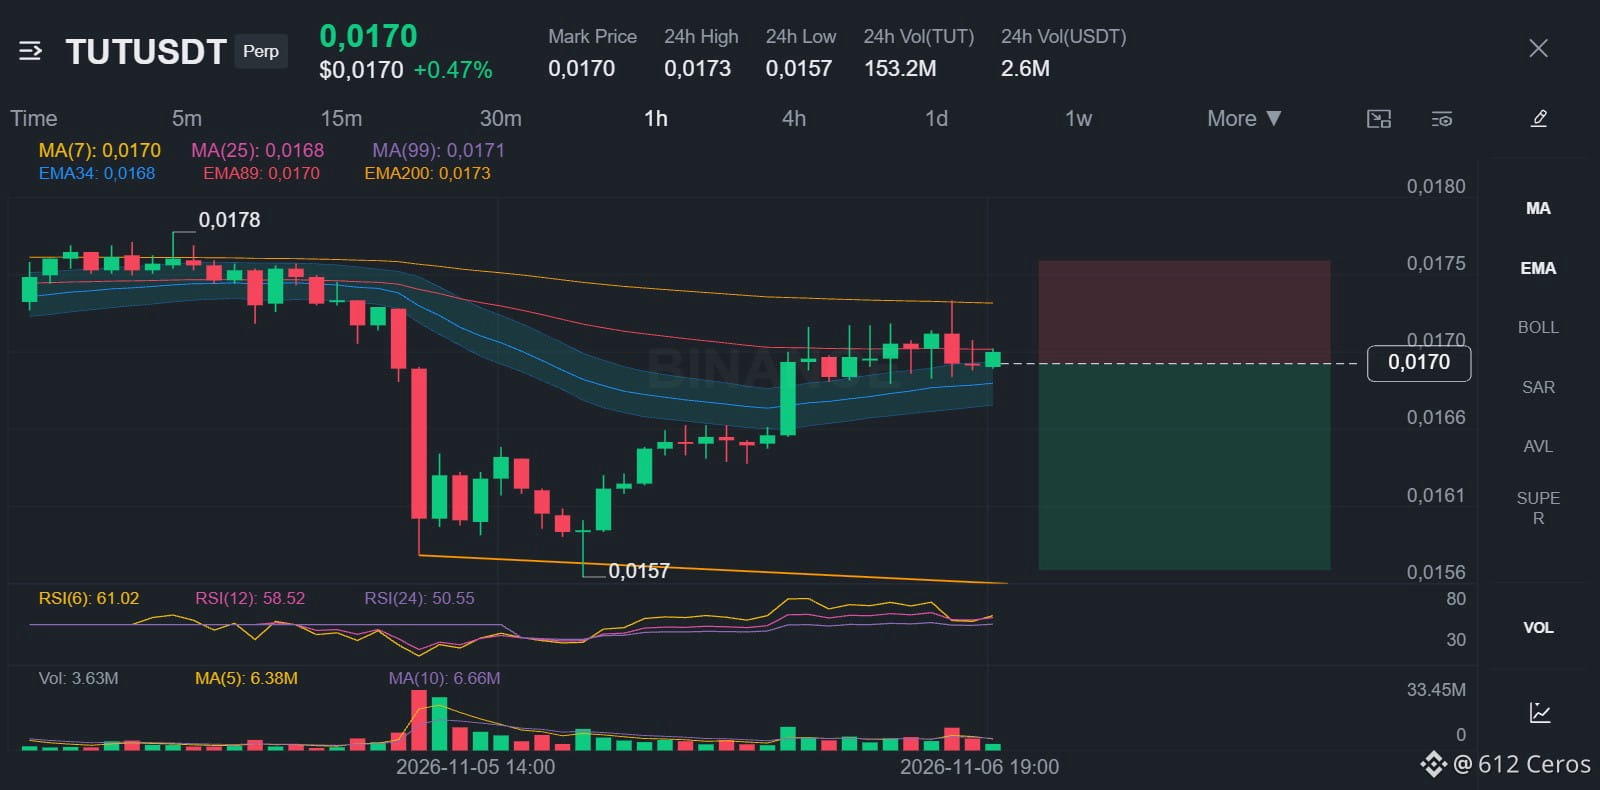
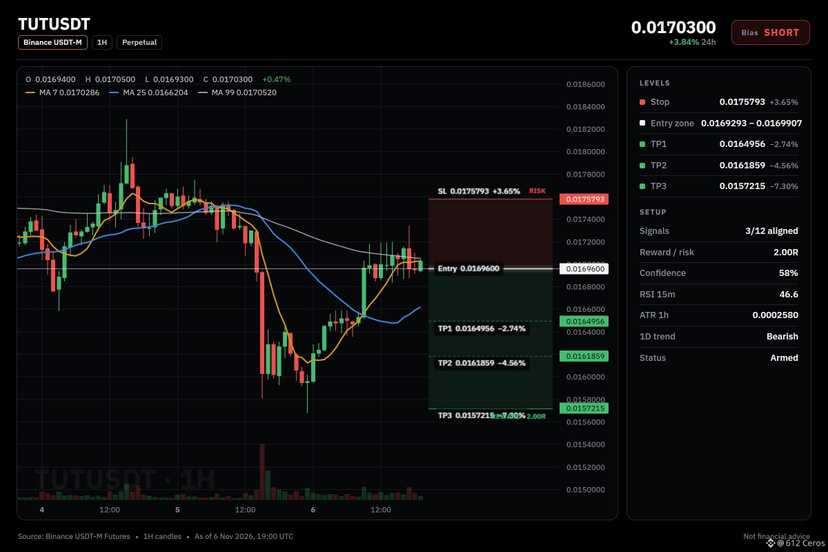
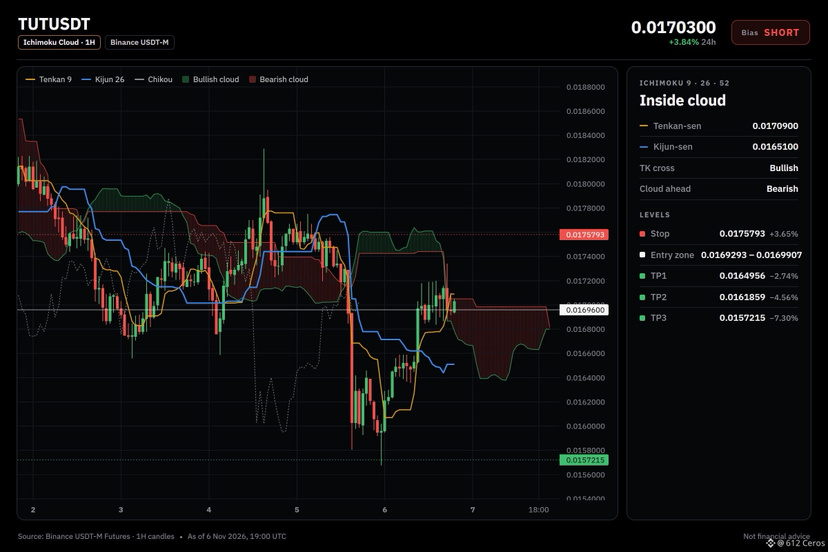
🔴 $TUT /USDT · Meyil: QISA
Gündəlik trend eniş yönümlüdür və 4 saatlıq trend də eniş yönümlüdür, buna görə qiymət aşağı düşməlidir.
Giriş: 0.0169293 – 0.0169907
TP1: 0.0164956 (-2.7%)
TP2: 0.0161859 (-4.6%)
TP3: 0.0157215 (-7.3%)
SL: 0.0175793 (+3.7%)
Qeyd: inam orta səviyyədədir, mövqenin ölçüsünü kiçik saxlayın.
Səbəb: Gündəlik trend eniş yönümlü EMA düzülüşünü göstərir, yəni ümumi trend aşağı istiqamətlidir; 4 saatlıq trend də eniş yönümlü EMA düzülüşünü göstərir, yəni qısamüddətli trend aşağı istiqamətlidir.
Risk: Alıcıların impulsu var (1 saatlıq RSI 57.0)
Plan: TP1-də mövqenin 50%-ni, TP2-də 25%-ni, TP3-də 25%-ni bağlayın və TP1-dən sonra stop-loss-u giriş qiymətinə keçirin.
Sizcə, giriş zonasında bu qısa mövqeyə girməyə dəyərmi?
{spot}(TUTUSDT)
🔴 $TUT /USDT · Meyil: QISA
Gündəlik trend eniş yönümlüdür və 4 saatlıq trend də eniş yönümlüdür, buna görə qiymət aşağı düşməlidir.
Giriş: 0.0169293 – 0.0169907
TP1: 0.0164956 (-2.7%)
TP2: 0.0161859 (-4.6%)
TP3: 0.0157215 (-7.3%)
SL: 0.0175793 (+3.7%)
Qeyd: inam orta səviyyədədir, mövqenin ölçüsünü kiçik saxlayın.
Səbəb: Gündəlik trend eniş yönümlü EMA düzülüşünü göstərir, yəni ümumi trend aşağı istiqamətlidir; 4 saatlıq trend də eniş yönümlü EMA düzülüşünü göstərir, yəni qısamüddətli trend aşağı istiqamətlidir.
Risk: Alıcıların impulsu var (1 saatlıq RSI 57.0)
Plan: TP1-də mövqenin 50%-ni, TP2-də 25%-ni, TP3-də 25%-ni bağlayın və TP1-dən sonra stop-loss-u giriş qiymətinə keçirin.
Sizcə, giriş zonasında bu qısa mövqeyə girməyə dəyərmi?
Gündəlik trend eniş yönümlüdür və 4 saatlıq trend də eniş yönümlüdür, buna görə qiymət aşağı düşməlidir.
Giriş: 0.0169293 – 0.0169907
TP1: 0.0164956 (-2.7%)
TP2: 0.0161859 (-4.6%)
TP3: 0.0157215 (-7.3%)
SL: 0.0175793 (+3.7%)
Qeyd: inam orta səviyyədədir, mövqenin ölçüsünü kiçik saxlayın.
Səbəb: Gündəlik trend eniş yönümlü EMA düzülüşünü göstərir, yəni ümumi trend aşağı istiqamətlidir; 4 saatlıq trend də eniş yönümlü EMA düzülüşünü göstərir, yəni qısamüddətli trend aşağı istiqamətlidir.
Risk: Alıcıların impulsu var (1 saatlıq RSI 57.0)
Plan: TP1-də mövqenin 50%-ni, TP2-də 25%-ni, TP3-də 25%-ni bağlayın və TP1-dən sonra stop-loss-u giriş qiymətinə keçirin.
Sizcə, giriş zonasında bu qısa mövqeyə girməyə dəyərmi?
23
·
--
Azalma
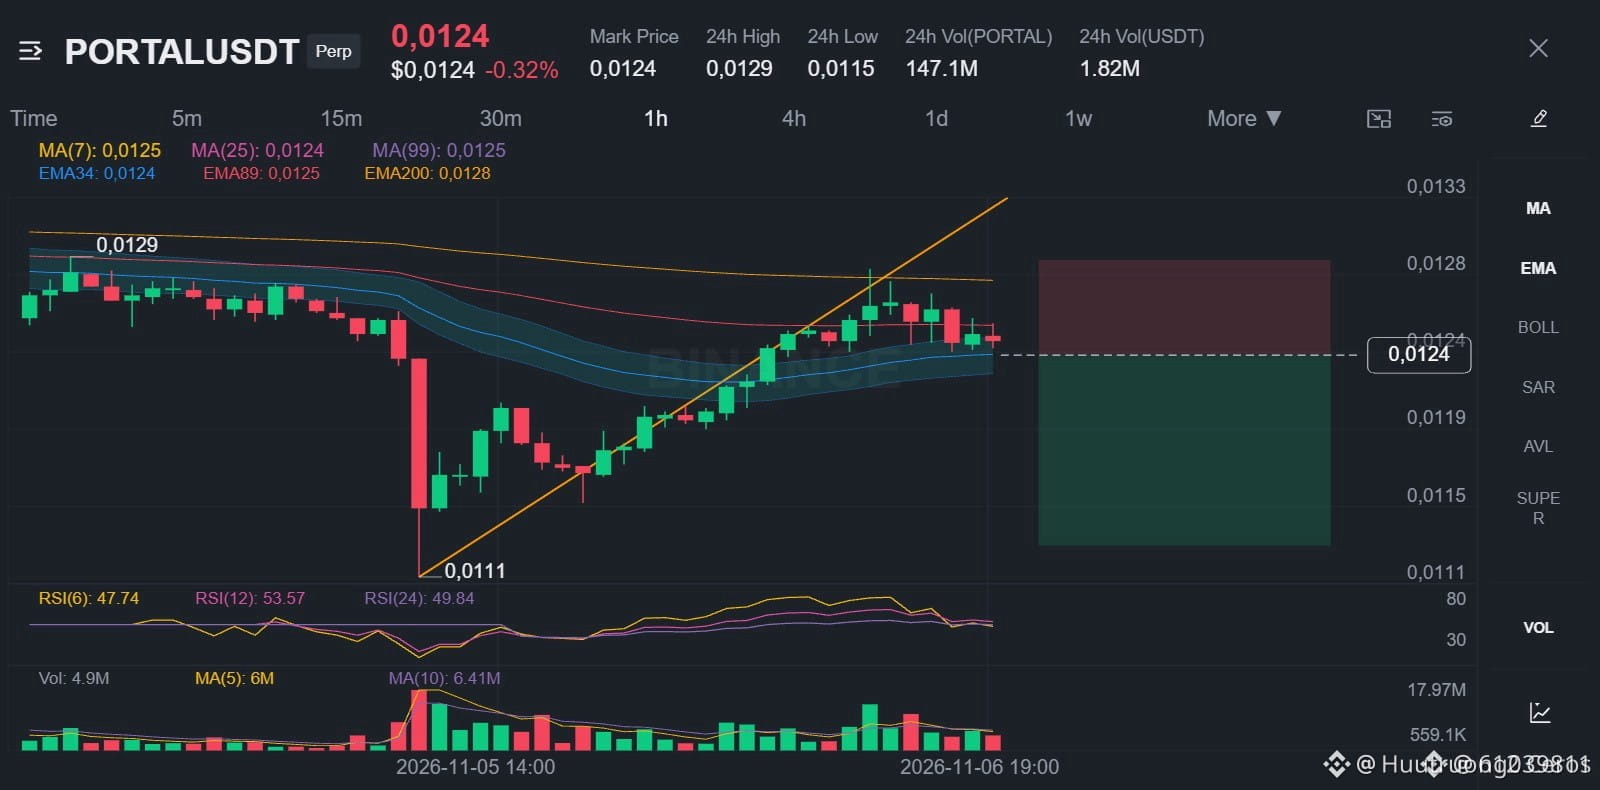
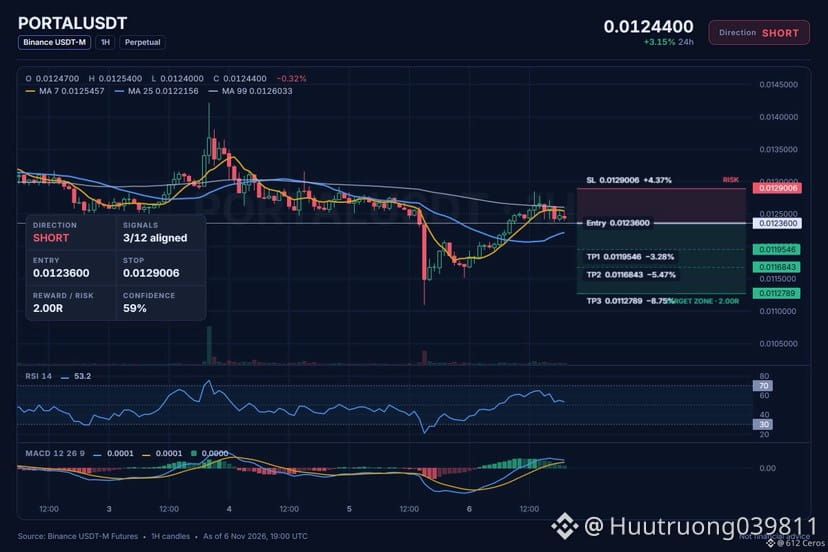
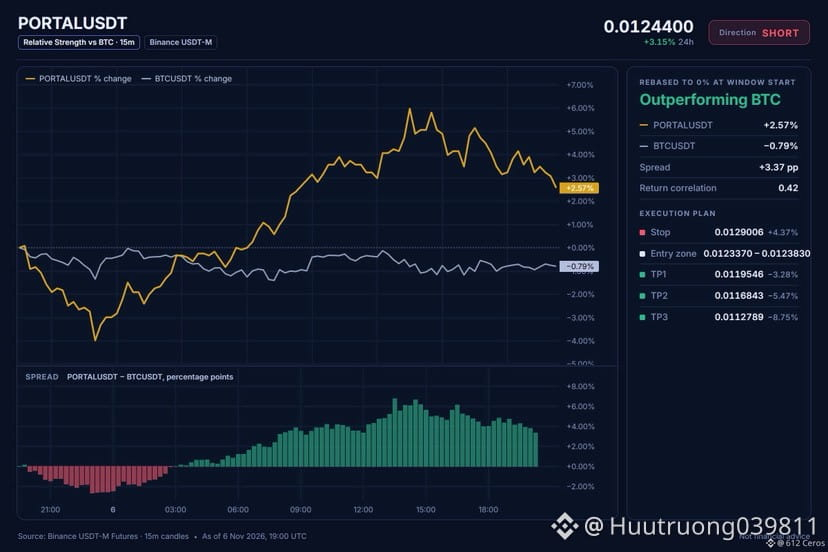
🔴 $PORTAL /USDT · İstiqamət: QISA
4 saatlıq qrafikdə qiymət ardıcıl ayı EMA-larından aşağıdır, buna görə də orta müddətli trend eniş istiqamətindədir.
Giriş: 0.0123370 – 0.0123830
TP1: 0.0119546 (-3.3%)
TP2: 0.0116843 (-5.5%)
TP3: 0.0112789 (-8.7%)
SL: 0.0129006 (+4.4%)
Qeyd: Əminlik orta səviyyədədir, mövqenin ölçüsünü kiçik saxlayın.
Səbəb: 4 saatlıq trenddə qiymət EMA50 və EMA200-dən aşağıdır və EMA-lar ayı düzülüşündədir; bu da orta müddətli trendin aydın şəkildə eniş istiqamətində olduğunu göstərir.
Risk: BTC-dən daha güclüdür (24 saatda BTC-yə nisbətən +4.20%)
Plan: TP1-də mövqenin 50%-ni, TP2-də 25%-ni, TP3-də 25%-ni bağlayın və TP1-dən sonra stopu giriş qiymətinə çəkin.
Sizcə, bu qısa mövqe quruluşunun hazırda uğurlu olma ehtimalı yüksəkdirmi?
{spot}(PORTALUSDT)
🔴 $PORTAL /USDT · İstiqamət: QISA
4 saatlıq qrafikdə qiymət ardıcıl ayı EMA-larından aşağıdır, buna görə də orta müddətli trend eniş istiqamətindədir.
Giriş: 0.0123370 – 0.0123830
TP1: 0.0119546 (-3.3%)
TP2: 0.0116843 (-5.5%)
TP3: 0.0112789 (-8.7%)
SL: 0.0129006 (+4.4%)
Qeyd: Əminlik orta səviyyədədir, mövqenin ölçüsünü kiçik saxlayın.
Səbəb: 4 saatlıq trenddə qiymət EMA50 və EMA200-dən aşağıdır və EMA-lar ayı düzülüşündədir; bu da orta müddətli trendin aydın şəkildə eniş istiqamətində olduğunu göstərir.
Risk: BTC-dən daha güclüdür (24 saatda BTC-yə nisbətən +4.20%)
Plan: TP1-də mövqenin 50%-ni, TP2-də 25%-ni, TP3-də 25%-ni bağlayın və TP1-dən sonra stopu giriş qiymətinə çəkin.
Sizcə, bu qısa mövqe quruluşunun hazırda uğurlu olma ehtimalı yüksəkdirmi?
4 saatlıq qrafikdə qiymət ardıcıl ayı EMA-larından aşağıdır, buna görə də orta müddətli trend eniş istiqamətindədir.
Giriş: 0.0123370 – 0.0123830
TP1: 0.0119546 (-3.3%)
TP2: 0.0116843 (-5.5%)
TP3: 0.0112789 (-8.7%)
SL: 0.0129006 (+4.4%)
Qeyd: Əminlik orta səviyyədədir, mövqenin ölçüsünü kiçik saxlayın.
Səbəb: 4 saatlıq trenddə qiymət EMA50 və EMA200-dən aşağıdır və EMA-lar ayı düzülüşündədir; bu da orta müddətli trendin aydın şəkildə eniş istiqamətində olduğunu göstərir.
Risk: BTC-dən daha güclüdür (24 saatda BTC-yə nisbətən +4.20%)
Plan: TP1-də mövqenin 50%-ni, TP2-də 25%-ni, TP3-də 25%-ni bağlayın və TP1-dən sonra stopu giriş qiymətinə çəkin.
Sizcə, bu qısa mövqe quruluşunun hazırda uğurlu olma ehtimalı yüksəkdirmi?
21
·
--
Azalma
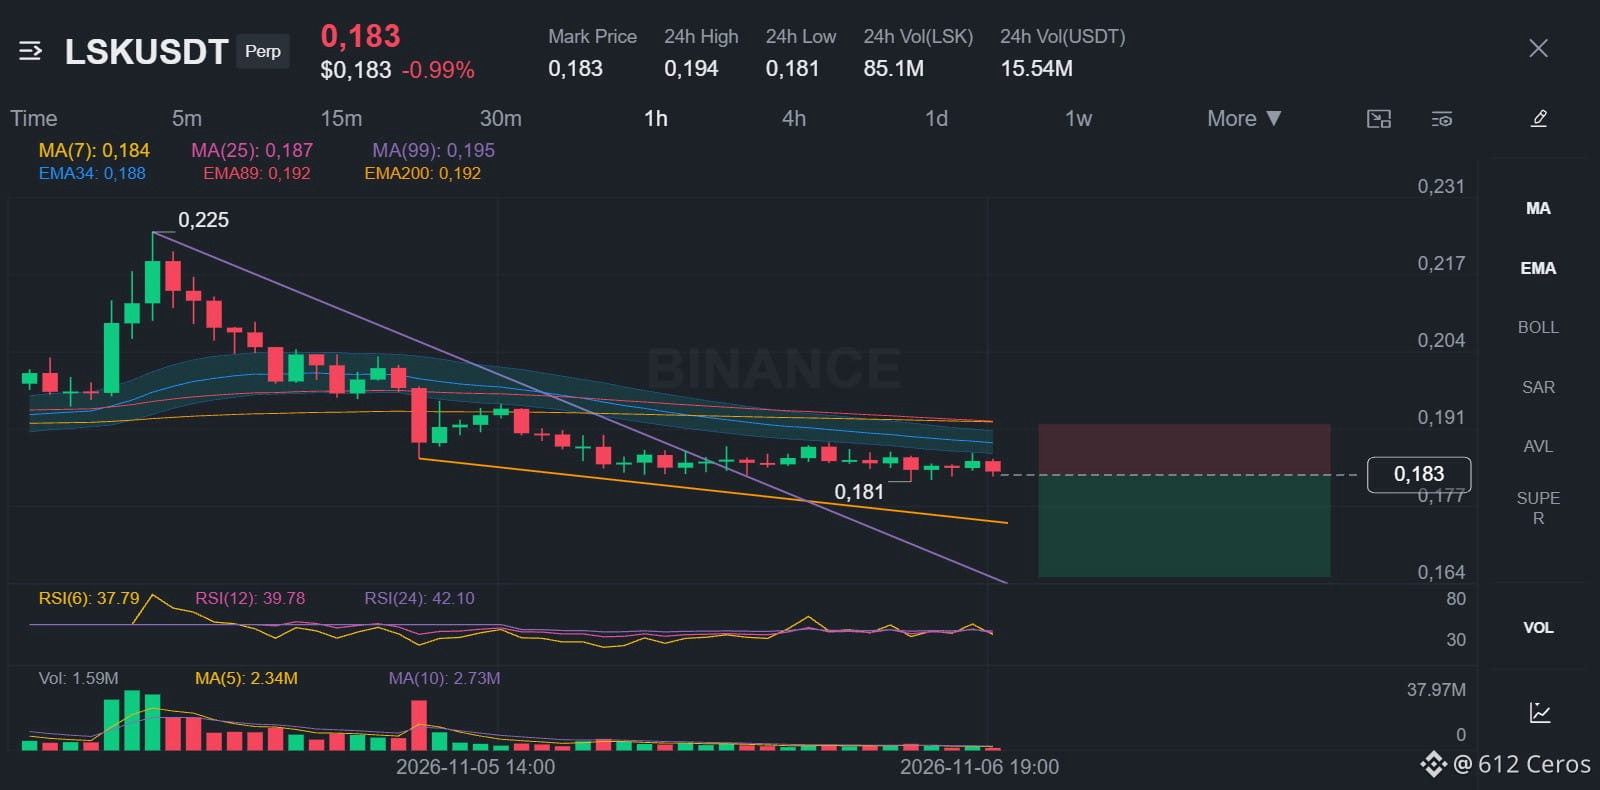
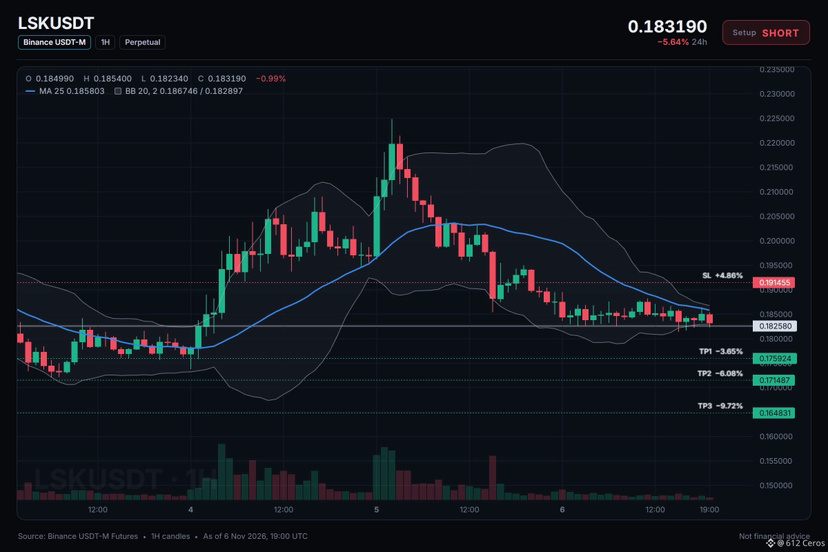
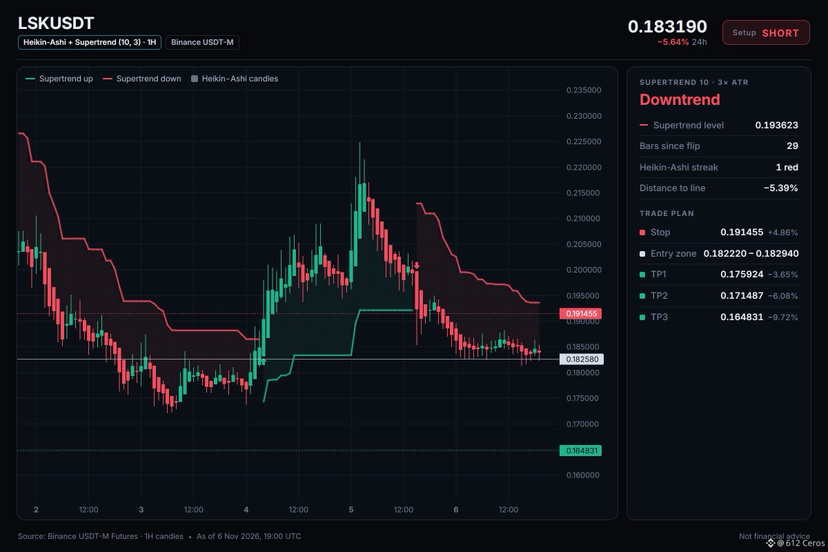
🔴 $LSK /USDT · İstiqamət: QISA
4 saatlıq trend qiymətin ayı yönümlü EMA-lar dəstəsindən aşağıda olduğunu göstərir, buna görə də svinq trendi aşağı yönəlib.
Giriş: 0.182220 – 0.182940
TP1: 0.175924 (-3.6%)
TP2: 0.171487 (-6.1%)
TP3: 0.164831 (-9.7%)
SL: 0.191455 (+4.9%)
Qeyd: əminlik səviyyəsi yalnız ortadır, mövqe həcmini kiçik saxlayın.
Səbəb: 4 saatlıq trend qiymətin ayı yönümlü EMA-lar dəstəsindən aşağıda olduğunu göstərir. Bu, svinq trendinin aşağı yönəldiyini bildirir; 43.9 RSI isə satıcıların impulsu qoruduğunu göstərir.
Plan: TP1-də mövqenin 50%-ni, TP2-də 25%-ni, TP3-də 25%-ni bağlayın və TP1-dən sonra stopu giriş səviyyəsinə keçirin.
Bu cütlükdə ən yaxşı qısa mövqe hədəfini harada görürsünüz?
{spot}(LSKUSDT)
🔴 $LSK /USDT · İstiqamət: QISA
4 saatlıq trend qiymətin ayı yönümlü EMA-lar dəstəsindən aşağıda olduğunu göstərir, buna görə də svinq trendi aşağı yönəlib.
Giriş: 0.182220 – 0.182940
TP1: 0.175924 (-3.6%)
TP2: 0.171487 (-6.1%)
TP3: 0.164831 (-9.7%)
SL: 0.191455 (+4.9%)
Qeyd: əminlik səviyyəsi yalnız ortadır, mövqe həcmini kiçik saxlayın.
Səbəb: 4 saatlıq trend qiymətin ayı yönümlü EMA-lar dəstəsindən aşağıda olduğunu göstərir. Bu, svinq trendinin aşağı yönəldiyini bildirir; 43.9 RSI isə satıcıların impulsu qoruduğunu göstərir.
Plan: TP1-də mövqenin 50%-ni, TP2-də 25%-ni, TP3-də 25%-ni bağlayın və TP1-dən sonra stopu giriş səviyyəsinə keçirin.
Bu cütlükdə ən yaxşı qısa mövqe hədəfini harada görürsünüz?
4 saatlıq trend qiymətin ayı yönümlü EMA-lar dəstəsindən aşağıda olduğunu göstərir, buna görə də svinq trendi aşağı yönəlib.
Giriş: 0.182220 – 0.182940
TP1: 0.175924 (-3.6%)
TP2: 0.171487 (-6.1%)
TP3: 0.164831 (-9.7%)
SL: 0.191455 (+4.9%)
Qeyd: əminlik səviyyəsi yalnız ortadır, mövqe həcmini kiçik saxlayın.
Səbəb: 4 saatlıq trend qiymətin ayı yönümlü EMA-lar dəstəsindən aşağıda olduğunu göstərir. Bu, svinq trendinin aşağı yönəldiyini bildirir; 43.9 RSI isə satıcıların impulsu qoruduğunu göstərir.
Plan: TP1-də mövqenin 50%-ni, TP2-də 25%-ni, TP3-də 25%-ni bağlayın və TP1-dən sonra stopu giriş səviyyəsinə keçirin.
Bu cütlükdə ən yaxşı qısa mövqe hədəfini harada görürsünüz?
14
·
--
Azalma
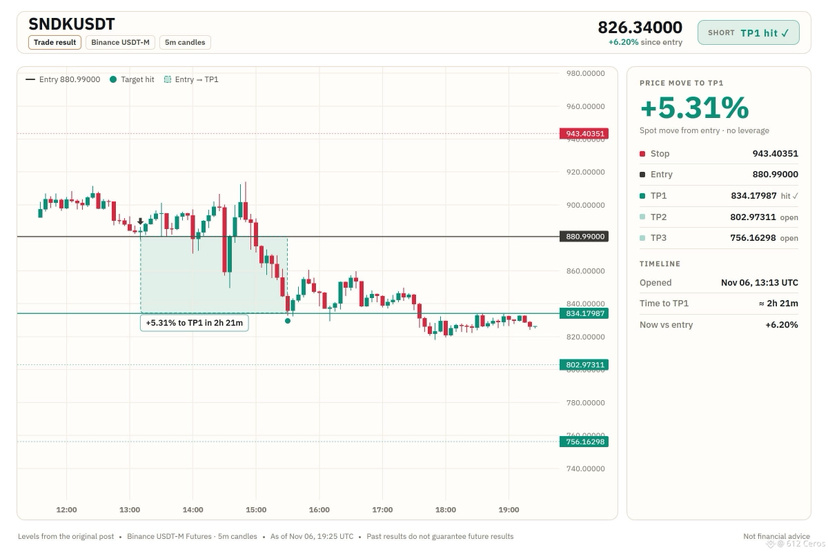
$SNDK USDT short mövqeyi TP1-ə çatdı 📉📊
Giriş qiymətindən təxminən 2 saat 21 dəqiqə ərzində spot qiymətində +5.31% hərəkət oldu. Leverage istifadə edilməyib.
Riskinizi həmişə idarə edin və mövqelərin ölçüsünü məsuliyyətlə müəyyənləşdirin. Təhlükəsiz ticarət edin ✌️
{future}(SNDKUSDT)
$SNDK USDT short mövqeyi TP1-ə çatdı 📉📊
Giriş qiymətindən təxminən 2 saat 21 dəqiqə ərzində spot qiymətində +5.31% hərəkət oldu. Leverage istifadə edilməyib.
Riskinizi həmişə idarə edin və mövqelərin ölçüsünü məsuliyyətlə müəyyənləşdirin. Təhlükəsiz ticarət edin ✌️
Giriş qiymətindən təxminən 2 saat 21 dəqiqə ərzində spot qiymətində +5.31% hərəkət oldu. Leverage istifadə edilməyib.
Riskinizi həmişə idarə edin və mövqelərin ölçüsünü məsuliyyətlə müəyyənləşdirin. Təhlükəsiz ticarət edin ✌️
Huutruong039811
·
--
Azalma🔴 $SNDK /USDT · Meyil: SHORT
Günlük, 4s və 1s qrafiklərində trendlər EMA-ların ayı bazarına xas düzülüşünü göstərir, buna görə qiymətin düşəcəyi gözlənilir.
Giriş: 878.20593 – 883.77407
TP1: 834.17987 (-5.3%)
TP2: 802.97311 (-8.9%)
TP3: 756.16298 (-14.2%)
SL: 943.40351 (+7.1%)
Səbəb: Günlük trend qiymətin EMA50-dən, EMA50-nin isə EMA200-dən aşağı olduğunu göstərir. Bu, ayı bazarına xas düzülüşdür və ümumi trendin aşağı istiqamətli olduğunu bildirir.
Risk: Alıcılar hərəkəti idarə edir (15 dəqiqəlik ADX 32.4)
Plan: TP1-də mövqenin 50%-ni, TP2-də 25%-ni, TP3-də isə 25%-ni bağlayın və TP1-dən sonra stop-loss-u giriş qiymətinə keçirin.
Bu qısa mövqeyə giriş zonasında girməyə dəyər olduğu ilə razısınız?
Günlük, 4s və 1s qrafiklərində trendlər EMA-ların ayı bazarına xas düzülüşünü göstərir, buna görə qiymətin düşəcəyi gözlənilir.
Giriş: 878.20593 – 883.77407
TP1: 834.17987 (-5.3%)
TP2: 802.97311 (-8.9%)
TP3: 756.16298 (-14.2%)
SL: 943.40351 (+7.1%)
Səbəb: Günlük trend qiymətin EMA50-dən, EMA50-nin isə EMA200-dən aşağı olduğunu göstərir. Bu, ayı bazarına xas düzülüşdür və ümumi trendin aşağı istiqamətli olduğunu bildirir.
Risk: Alıcılar hərəkəti idarə edir (15 dəqiqəlik ADX 32.4)
Plan: TP1-də mövqenin 50%-ni, TP2-də 25%-ni, TP3-də isə 25%-ni bağlayın və TP1-dən sonra stop-loss-u giriş qiymətinə keçirin.
Bu qısa mövqeyə giriş zonasında girməyə dəyər olduğu ilə razısınız?
23
·
--
Azalma
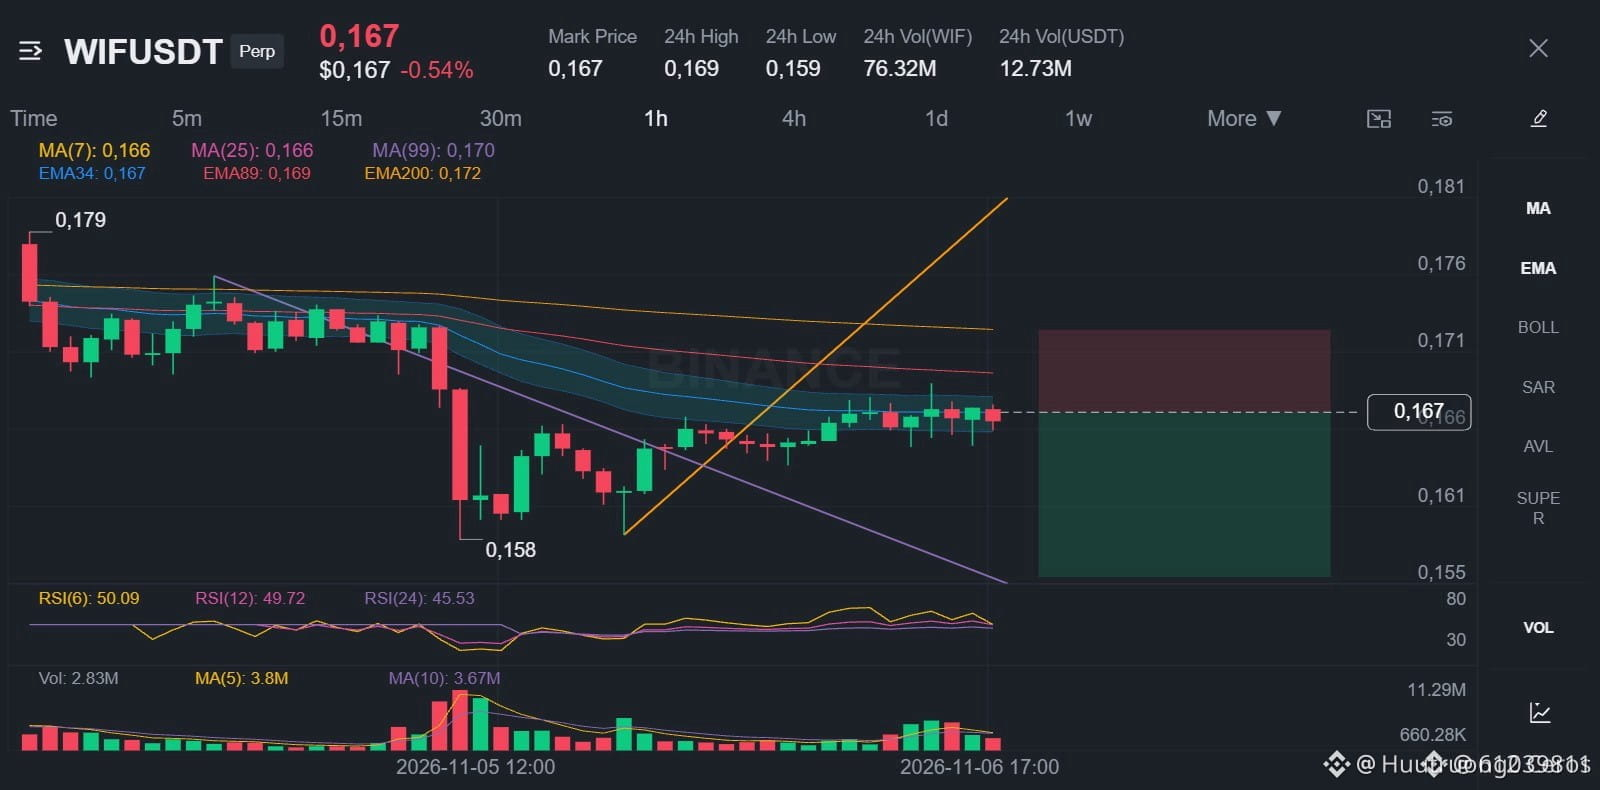
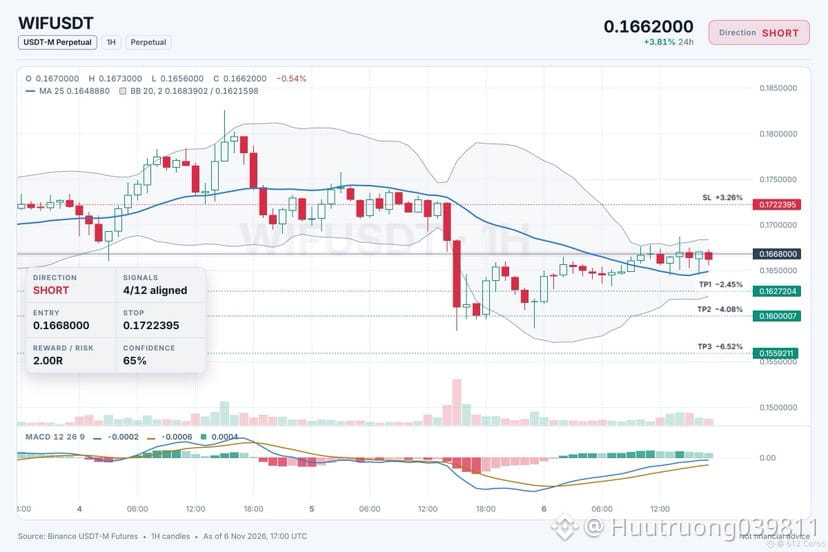
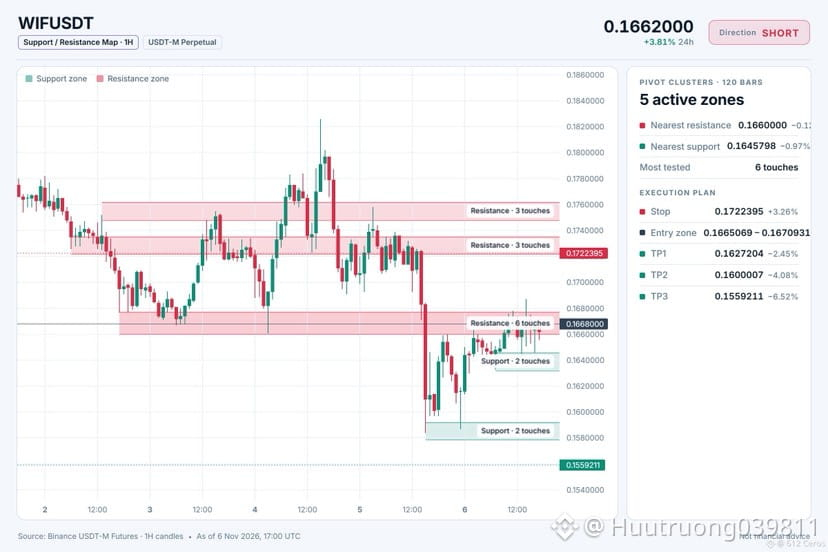
🔴 $WIF /USDT · Mövqe: QISA
Gündəlik trend EMA-ların eniş yönümlü düzülüşünü göstərir, buna görə qiymət aşağı düşməlidir.
Giriş: 0.1665069 – 0.1670931
TP1: 0.1627204 (-2.4%)
TP2: 0.1600007 (-4.1%)
TP3: 0.1559211 (-6.5%)
SL: 0.1722395 (+3.3%)
Qeyd: əminlik orta səviyyədədir, mövqenin həcmini kiçik saxlayın.
Səbəb: Gündəlik trend qiymətin EMA50 və EMA200-dən aşağı olduğunu göstərir, bu isə ümumi trendin eniş istiqamətində olması deməkdir.
Risk: BTC-dən güclüdür (24 saatda BTC ilə müqayisədə +2.41%)
Plan: TP1-də 50%, TP2-də 25%, TP3-də 25% bağlayın və TP1-dən sonra stopu giriş səviyyəsinə keçirin.
Sizcə, bu əməliyyatın istiqaməti necə olacaq?
{spot}(WIFUSDT)
🔴 $WIF /USDT · Mövqe: QISA
Gündəlik trend EMA-ların eniş yönümlü düzülüşünü göstərir, buna görə qiymət aşağı düşməlidir.
Giriş: 0.1665069 – 0.1670931
TP1: 0.1627204 (-2.4%)
TP2: 0.1600007 (-4.1%)
TP3: 0.1559211 (-6.5%)
SL: 0.1722395 (+3.3%)
Qeyd: əminlik orta səviyyədədir, mövqenin həcmini kiçik saxlayın.
Səbəb: Gündəlik trend qiymətin EMA50 və EMA200-dən aşağı olduğunu göstərir, bu isə ümumi trendin eniş istiqamətində olması deməkdir.
Risk: BTC-dən güclüdür (24 saatda BTC ilə müqayisədə +2.41%)
Plan: TP1-də 50%, TP2-də 25%, TP3-də 25% bağlayın və TP1-dən sonra stopu giriş səviyyəsinə keçirin.
Sizcə, bu əməliyyatın istiqaməti necə olacaq?
Gündəlik trend EMA-ların eniş yönümlü düzülüşünü göstərir, buna görə qiymət aşağı düşməlidir.
Giriş: 0.1665069 – 0.1670931
TP1: 0.1627204 (-2.4%)
TP2: 0.1600007 (-4.1%)
TP3: 0.1559211 (-6.5%)
SL: 0.1722395 (+3.3%)
Qeyd: əminlik orta səviyyədədir, mövqenin həcmini kiçik saxlayın.
Səbəb: Gündəlik trend qiymətin EMA50 və EMA200-dən aşağı olduğunu göstərir, bu isə ümumi trendin eniş istiqamətində olması deməkdir.
Risk: BTC-dən güclüdür (24 saatda BTC ilə müqayisədə +2.41%)
Plan: TP1-də 50%, TP2-də 25%, TP3-də 25% bağlayın və TP1-dən sonra stopu giriş səviyyəsinə keçirin.
Sizcə, bu əməliyyatın istiqaməti necə olacaq?
19
·
--
Artım
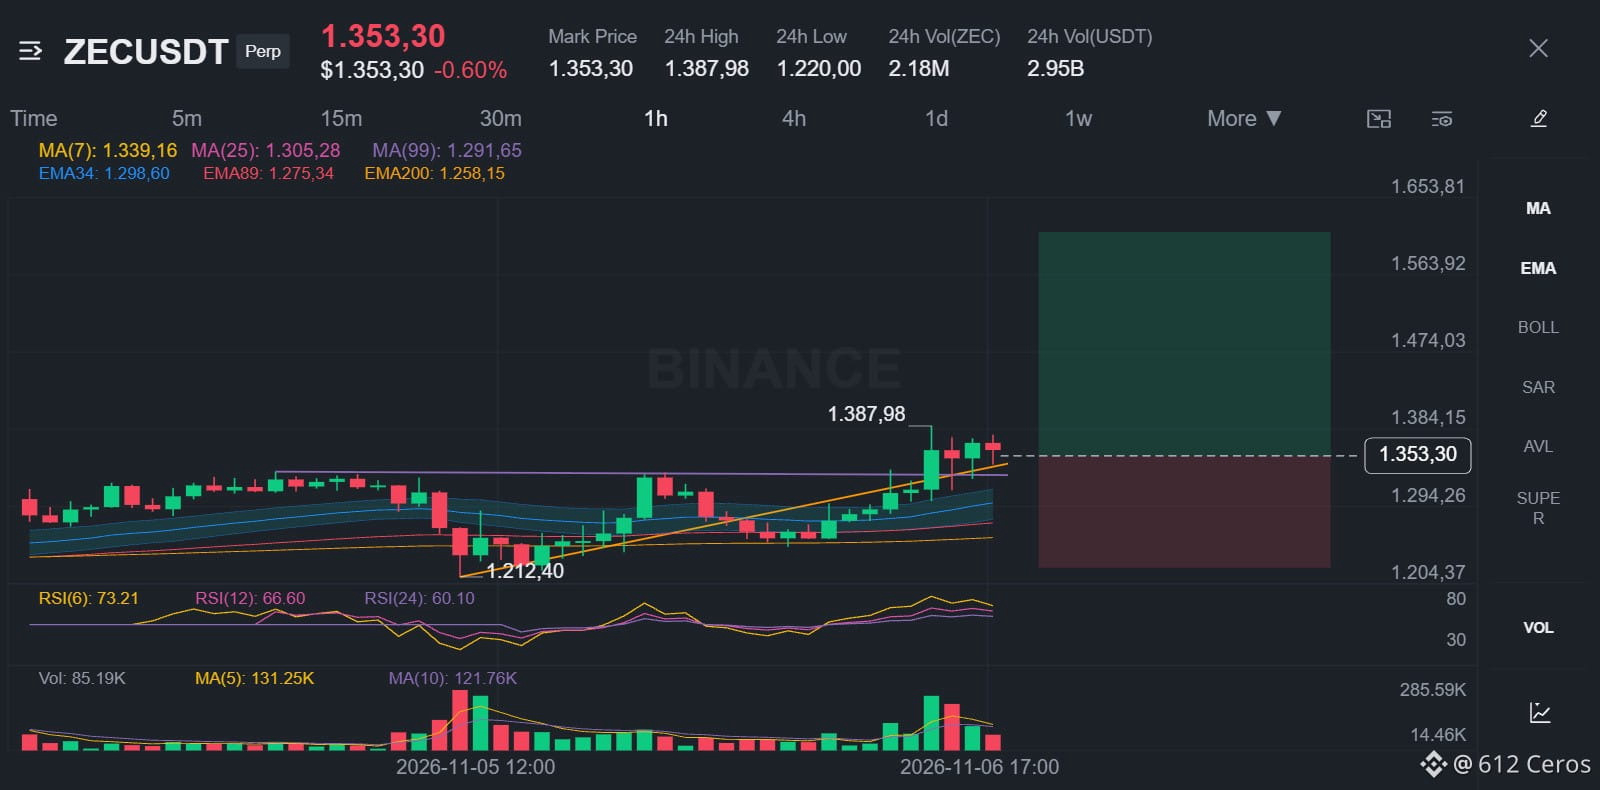
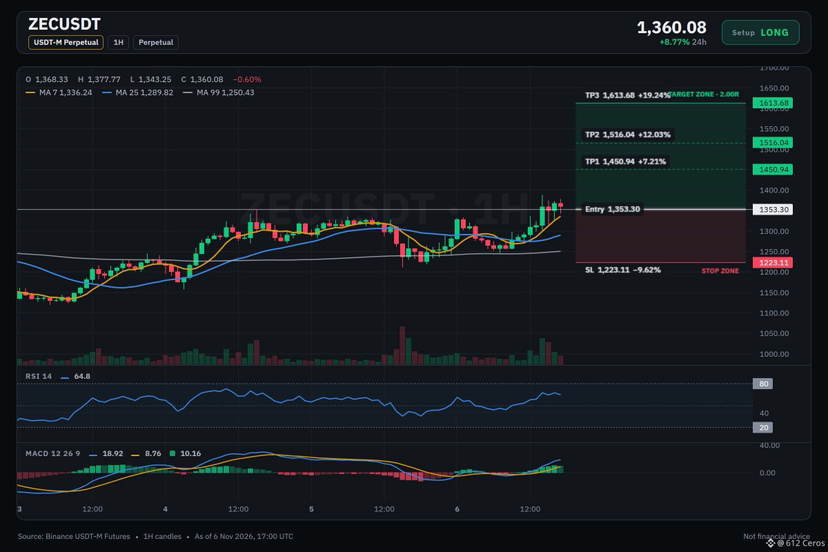
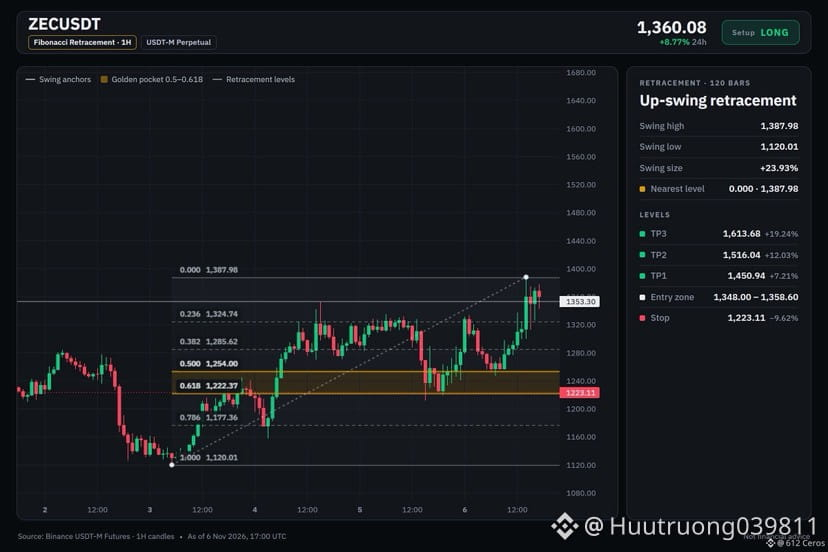
🟢 $ZEC /USDT · Meyl: LONG
Gündəlik trend yüksəliş yönümlüdür, buna görə qiymət giriş zonasından yuxarı qalxmalıdır.
Giriş: 1348.00 – 1358.60
TP1: 1450.94 (+7.2%)
TP2: 1516.04 (+12.0%)
TP3: 1613.68 (+19.2%)
SL: 1223.11 (-9.6%)
Səbəb: Gündəlik trend qiymətin EMA50-dən, EMA50-nin isə EMA200-dən yuxarı olduğunu göstərir. Bu yüksəliş yönümlü düzülüş ümumi trendin yuxarı olduğunu bildirir.
Plan: TP1-də mövqenin 50%-ni, TP2-də 25%-ni, TP3-də 25%-ni bağlayın və TP1-dən sonra stopu giriş qiymətinə çəkin.
Sizcə, ZEC bundan sonra hansı istiqamətdə hərəkət edəcək?
{spot}(ZECUSDT)
🟢 $ZEC /USDT · Meyl: LONG
Gündəlik trend yüksəliş yönümlüdür, buna görə qiymət giriş zonasından yuxarı qalxmalıdır.
Giriş: 1348.00 – 1358.60
TP1: 1450.94 (+7.2%)
TP2: 1516.04 (+12.0%)
TP3: 1613.68 (+19.2%)
SL: 1223.11 (-9.6%)
Səbəb: Gündəlik trend qiymətin EMA50-dən, EMA50-nin isə EMA200-dən yuxarı olduğunu göstərir. Bu yüksəliş yönümlü düzülüş ümumi trendin yuxarı olduğunu bildirir.
Plan: TP1-də mövqenin 50%-ni, TP2-də 25%-ni, TP3-də 25%-ni bağlayın və TP1-dən sonra stopu giriş qiymətinə çəkin.
Sizcə, ZEC bundan sonra hansı istiqamətdə hərəkət edəcək?
Gündəlik trend yüksəliş yönümlüdür, buna görə qiymət giriş zonasından yuxarı qalxmalıdır.
Giriş: 1348.00 – 1358.60
TP1: 1450.94 (+7.2%)
TP2: 1516.04 (+12.0%)
TP3: 1613.68 (+19.2%)
SL: 1223.11 (-9.6%)
Səbəb: Gündəlik trend qiymətin EMA50-dən, EMA50-nin isə EMA200-dən yuxarı olduğunu göstərir. Bu yüksəliş yönümlü düzülüş ümumi trendin yuxarı olduğunu bildirir.
Plan: TP1-də mövqenin 50%-ni, TP2-də 25%-ni, TP3-də 25%-ni bağlayın və TP1-dən sonra stopu giriş qiymətinə çəkin.
Sizcə, ZEC bundan sonra hansı istiqamətdə hərəkət edəcək?
11
Daha çox kontent araşdırmaq üçün daxil olun
Binance Square-də qlobal kriptovalyuta istifadəçilərinə qoşulun
⚡️ Kriptovalyuta haqqında ən son və faydalı məlumatları əldə edin.
💬 Dünyanın ən böyük kriptovalyuta birjası tərəfindən etibar edilir.
👍 Doğrulanmış yaradıcılardan gələn real məlumatları kəşf edin.
E-poçt/Telefon nömrəsi
Trenddə olan mövzular
JobsReportRaisesHikeOdds
332,204 baxış
Müzakirə edir: 2,537
TradFi xəbərləri | İşsizlik 4.1%-ə düşərkən, ABŞ oktyabrda 165,000 iş yeri yaratdı — proqnozlaşdırılan 65,000-dən iki dəfədən çox
Binance News
·38 bəyənmə
·23.6k baxış
CPITestsDecemberRateOutlook
59,025 baxış
Müzakirə edir: 638
BitcoinRebounds$75KAsChipsLead
27,926 baxış
Müzakirə edir: 260