
CryptoQuant Quicktake
9k Paylaşımlar

CryptoQuant Quicktake
 Square Verified+
Şikayət et
İstifadəçini blokla
CryptoQuant.com - Leading On-chain Data/Analytics Provider
0 İzlənilir
23.3K+ İzləyicilər
27.2K+ Bəyəndi
Postlar
Məqalə
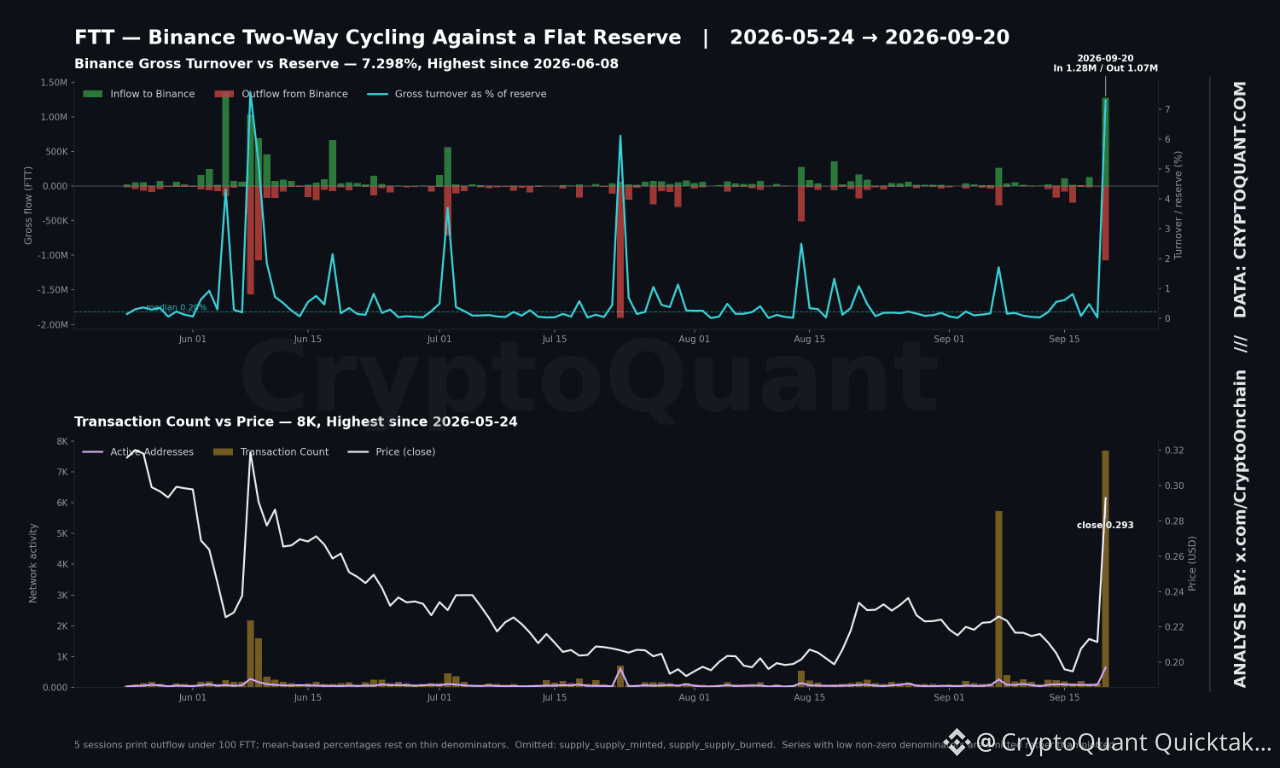
Binance FTT Çıxış Tranzaksiya Sayı Sentyabrın 20-də 315-ə Çatır — Altı Ayın Ən Yüksəyi olan göstərici...Binance FTT çıxış tranzaksiyalarının sayı sentyabrın 20-də 315-ə çatdı. Həmin sessiyada Binance girişləri 1,277,448 FTT təşkil etdi. Binance netflow həftənin sentyabrın 20-də bitən hissəsi boyunca gündəlik orta hesabla −2,060.91 FTT oldu.
Bəzi göstəricilər nazik əsaslar üzərində dayanır. Binance çıxışı sentyabrın 9-da 0.000, sentyabrın 12-də isə 25.92 göstərdi; buna görə də çıxışın orta göstəricisində həftəlik +557% artım demək olar ki, boş bir məxrəcə söykənir. Birjalarda ünvan sayları əksər sessiyalarda tək rəqəmlərlə gedir və faiz kimi dərc edilmir. supply_minted və supply_burned hər üç üfüqdə 0.000 çıxır — köhnə/məlumatı olmayan seriyalar, istisna olunub.
Binance FTT Çıxış Tranzaksiya Sayı Sentyabrın 20-də 315-ə Çatır — Altı Ayın Ən Yüksəyi olan göstərici...
Binance FTT çıxış tranzaksiyalarının sayı sentyabrın 20-də 315-ə çatdı. Həmin sessiyada Binance girişləri 1,277,448 FTT təşkil etdi. Binance netflow həftənin sentyabrın 20-də bitən hissəsi boyunca gündəlik orta hesabla −2,060.91 FTT oldu.
Bəzi göstəricilər nazik əsaslar üzərində dayanır. Binance çıxışı sentyabrın 9-da 0.000, sentyabrın 12-də isə 25.92 göstərdi; buna görə də çıxışın orta göstəricisində həftəlik +557% artım demək olar ki, boş bir məxrəcə söykənir. Birjalarda ünvan sayları əksər sessiyalarda tək rəqəmlərlə gedir və faiz kimi dərc edilmir. supply_minted və supply_burned hər üç üfüqdə 0.000 çıxır — köhnə/məlumatı olmayan seriyalar, istisna olunub.
Bəzi göstəricilər nazik əsaslar üzərində dayanır. Binance çıxışı sentyabrın 9-da 0.000, sentyabrın 12-də isə 25.92 göstərdi; buna görə də çıxışın orta göstəricisində həftəlik +557% artım demək olar ki, boş bir məxrəcə söykənir. Birjalarda ünvan sayları əksər sessiyalarda tək rəqəmlərlə gedir və faiz kimi dərc edilmir. supply_minted və supply_burned hər üç üfüqdə 0.000 çıxır — köhnə/məlumatı olmayan seriyalar, istisna olunub.
200
Məqalə
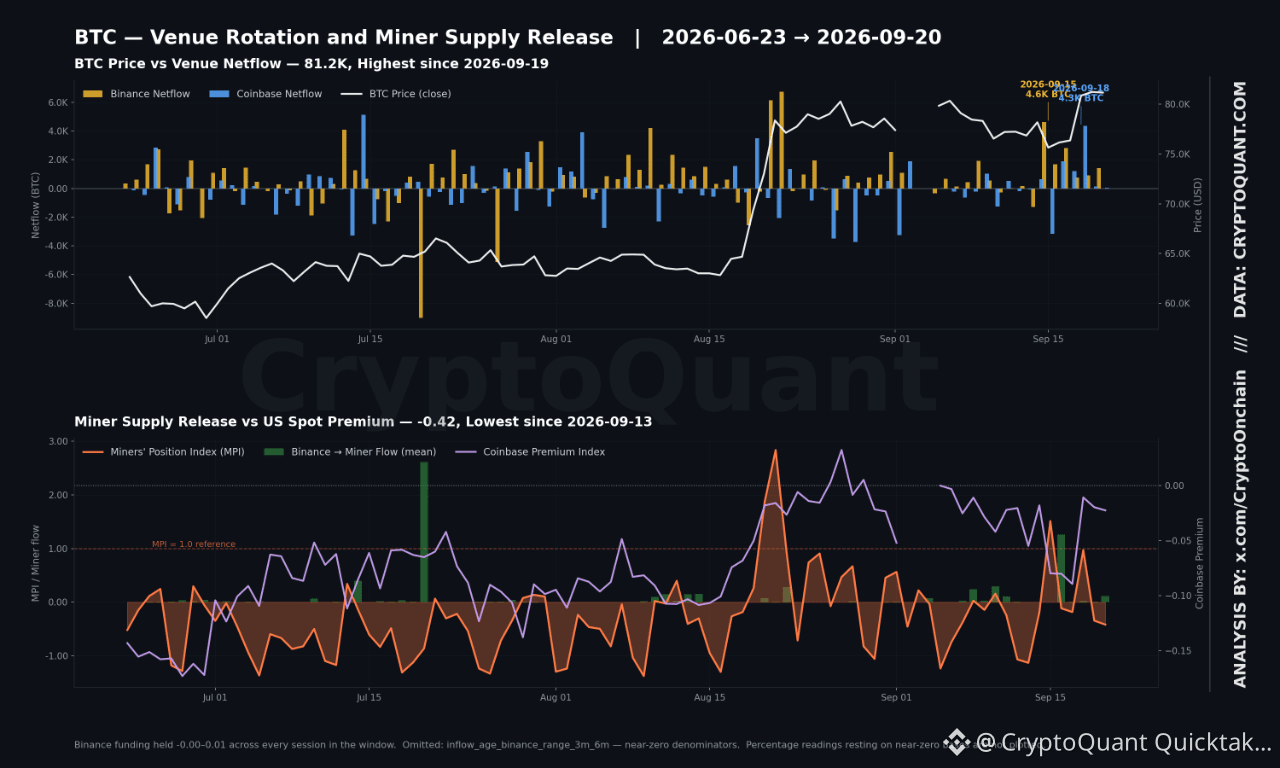
Bitcoin 19 Sentyabrda 81,224-də Bağlanır — 15 Sentyabrın Aşağı Həddindən 7.4% Hərəkətdən SonraBitcoin 19 sentyabrda 81,224.60-da bağlandı; bu, hesabat pəncərəsindəki ən yüksək göstəricidir. Coinbase netflow 18 sentyabrda +4,347.08 BTC-yə çatdı. Mədənçilərin Mövqe İndeksi 20 sentyabrda bitən həftədə orta hesabla 0.17 oldu və aylıq bazadan 814% yuxarıda idi.
İki seriya istisna edilib: NVT Golden Cross yaxın sıfır baza üzərində rüblük +37,431% göstərir — yalnız onun 0.47 səviyyəsi və −47% həftəlik hərəkəti istifadə oluna bilər. Yaş qrupu üzrə daxilolmalar (binance_3m_6m 0.23 BTC, all_10y_inf 3.59 BTC) elə aşağı məxrəclər üzərindədir ki, dərc etmək mümkün deyil və birincisi ümumiyyətlə həftəlik-həftəlik dəyər vermir.
Bitcoin 19 Sentyabrda 81,224-də Bağlanır — 15 Sentyabrın Aşağı Həddindən 7.4% Hərəkətdən Sonra
Bitcoin 19 sentyabrda 81,224.60-da bağlandı; bu, hesabat pəncərəsindəki ən yüksək göstəricidir. Coinbase netflow 18 sentyabrda +4,347.08 BTC-yə çatdı. Mədənçilərin Mövqe İndeksi 20 sentyabrda bitən həftədə orta hesabla 0.17 oldu və aylıq bazadan 814% yuxarıda idi.
İki seriya istisna edilib: NVT Golden Cross yaxın sıfır baza üzərində rüblük +37,431% göstərir — yalnız onun 0.47 səviyyəsi və −47% həftəlik hərəkəti istifadə oluna bilər. Yaş qrupu üzrə daxilolmalar (binance_3m_6m 0.23 BTC, all_10y_inf 3.59 BTC) elə aşağı məxrəclər üzərindədir ki, dərc etmək mümkün deyil və birincisi ümumiyyətlə həftəlik-həftəlik dəyər vermir.
İki seriya istisna edilib: NVT Golden Cross yaxın sıfır baza üzərində rüblük +37,431% göstərir — yalnız onun 0.47 səviyyəsi və −47% həftəlik hərəkəti istifadə oluna bilər. Yaş qrupu üzrə daxilolmalar (binance_3m_6m 0.23 BTC, all_10y_inf 3.59 BTC) elə aşağı məxrəclər üzərindədir ki, dərc etmək mümkün deyil və birincisi ümumiyyətlə həftəlik-həftəlik dəyər vermir.
144
Məqalə
Tərcüməyə bax
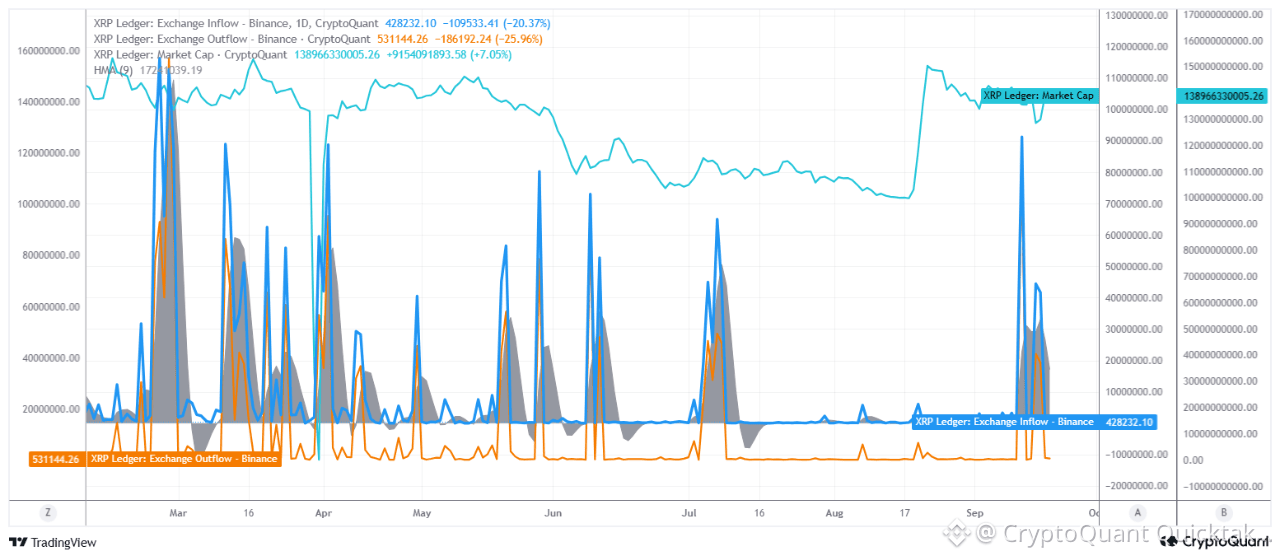
XRP's Supportive Structure Is Drawing AttentionIn this chart, the most notable signal may be that the difference between XRP entering Binance and XRP leaving the exchange remains negative in the latest period.
According to the latest data on the chart:
Exchange Inflow: -20.37%
Exchange Outflow: -25.96%
Net Flow: approximately -102,912 XRP
XRP Market Cap: $138.97 billion (+7.05%)
In other words, the amount of XRP leaving Binance has recently been higher than the amount of XRP entering Binance.
This indicates that a portion of the supply is moving out of exchanges in the short term. The fact that this is happening while the price is rising is particularly important. Investors may be keeping some of their XRP outside exchanges rather than sending it to exchanges to sell. Therefore, selling pressure may weaken and the potential for an upward price reaction may be supported. However, it is important to emphasize that this alone does not guarantee an upward move.
Another important point here is that not only outflows but also inflows have declined significantly. While Inflow is down 20.37%, Outflow is down 25.96%. This situation may reduce volatility.
When we evaluate these data together with Market Cap, the XRP Market Cap line has recently risen strongly from around the $103 billion region to above $150 billion. Afterward, a correction occurred, bringing the market cap back to approximately $139 billion.
With market cap still remaining at relatively high levels while net exchange flow is negative,this may indicate that the correction following the rally has not yet turned into a completely new wave of selling. This creates a supportive structure for XRP's supply dynamics in the short term.
In its current structure, this chart shows a supportive supply dynamic for XRP's short-term price action. If this structure remains intact, the potential for an upward reaction following the current correction could be further supported.
Written by PelinayPA
XRP's Supportive Structure Is Drawing Attention
In this chart, the most notable signal may be that the difference between XRP entering Binance and XRP leaving the exchange remains negative in the latest period.
According to the latest data on the chart:
Exchange Inflow: -20.37%
Exchange Outflow: -25.96%
Net Flow: approximately -102,912 XRP
XRP Market Cap: $138.97 billion (+7.05%)
In other words, the amount of XRP leaving Binance has recently been higher than the amount of XRP entering Binance.
This indicates that a portion of the supply is moving out of exchanges in the short term. The fact that this is happening while the price is rising is particularly important. Investors may be keeping some of their XRP outside exchanges rather than sending it to exchanges to sell. Therefore, selling pressure may weaken and the potential for an upward price reaction may be supported. However, it is important to emphasize that this alone does not guarantee an upward move.
Another important point here is that not only outflows but also inflows have declined significantly. While Inflow is down 20.37%, Outflow is down 25.96%. This situation may reduce volatility.
When we evaluate these data together with Market Cap, the XRP Market Cap line has recently risen strongly from around the $103 billion region to above $150 billion. Afterward, a correction occurred, bringing the market cap back to approximately $139 billion.
With market cap still remaining at relatively high levels while net exchange flow is negative,this may indicate that the correction following the rally has not yet turned into a completely new wave of selling. This creates a supportive structure for XRP's supply dynamics in the short term.
In its current structure, this chart shows a supportive supply dynamic for XRP's short-term price action. If this structure remains intact, the potential for an upward reaction following the current correction could be further supported.
Written by PelinayPA
According to the latest data on the chart:
Exchange Inflow: -20.37%
Exchange Outflow: -25.96%
Net Flow: approximately -102,912 XRP
XRP Market Cap: $138.97 billion (+7.05%)
In other words, the amount of XRP leaving Binance has recently been higher than the amount of XRP entering Binance.
This indicates that a portion of the supply is moving out of exchanges in the short term. The fact that this is happening while the price is rising is particularly important. Investors may be keeping some of their XRP outside exchanges rather than sending it to exchanges to sell. Therefore, selling pressure may weaken and the potential for an upward price reaction may be supported. However, it is important to emphasize that this alone does not guarantee an upward move.
Another important point here is that not only outflows but also inflows have declined significantly. While Inflow is down 20.37%, Outflow is down 25.96%. This situation may reduce volatility.
When we evaluate these data together with Market Cap, the XRP Market Cap line has recently risen strongly from around the $103 billion region to above $150 billion. Afterward, a correction occurred, bringing the market cap back to approximately $139 billion.
With market cap still remaining at relatively high levels while net exchange flow is negative,this may indicate that the correction following the rally has not yet turned into a completely new wave of selling. This creates a supportive structure for XRP's supply dynamics in the short term.
In its current structure, this chart shows a supportive supply dynamic for XRP's short-term price action. If this structure remains intact, the potential for an upward reaction following the current correction could be further supported.
Written by PelinayPA
119
Məqalə
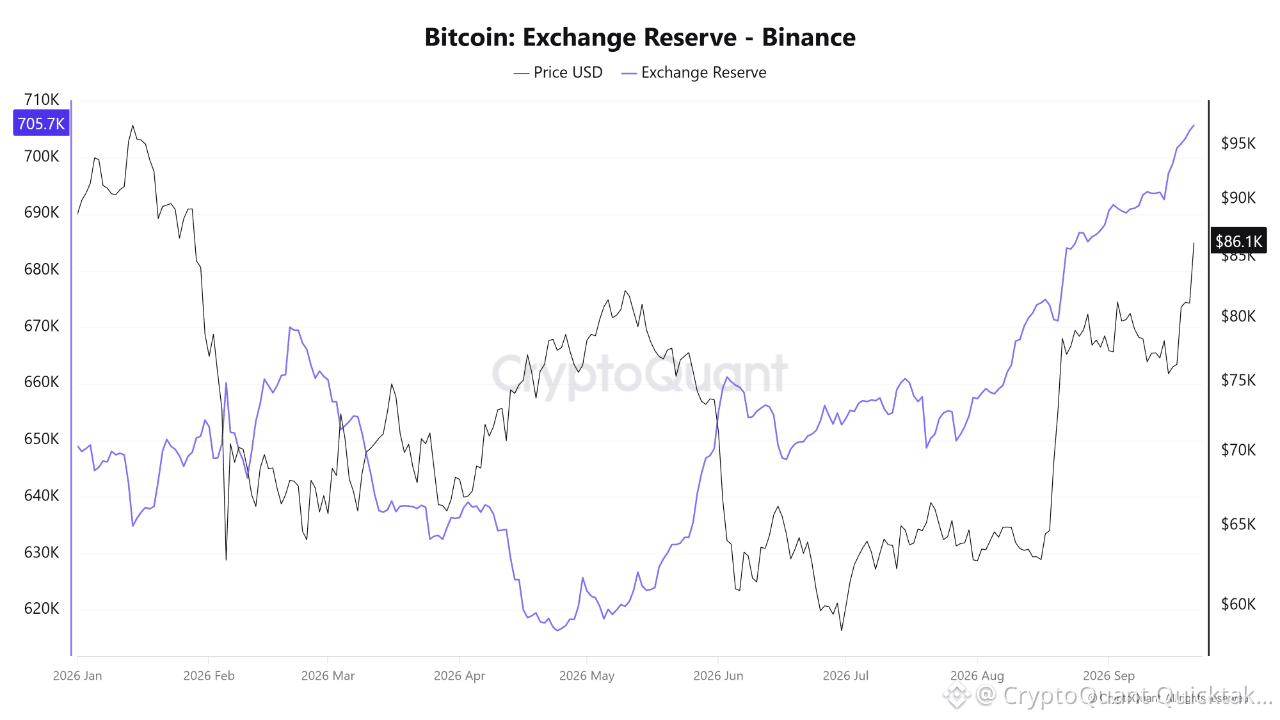
Bitcoin 86,000 ABŞ dollarını Aşır: Binance Ehtiyatları Xəbərdarlıq Siqnalı QaldırırBitcoin 86,000 ABŞ dollarını keçərək səkkiz aylıq maksimuma çatdı. Rallinin üç əsas qüvvəsi var idi: ABŞ spot Bitcoin ETF-lərinə yenidən axınların başlaması, Xəzinə istiqrazlarının gəlirləri və neft qiymətlərinin azalması ilə riskə dair sentimentin yaxşılaşması və böyük həcmli short-squeeze. 24 saat ərzində təxminən 367 milyon ABŞ dolları dəyərində Bitcoin short-ları likvidasiya edilərək hərəkatı sürətləndirdi.
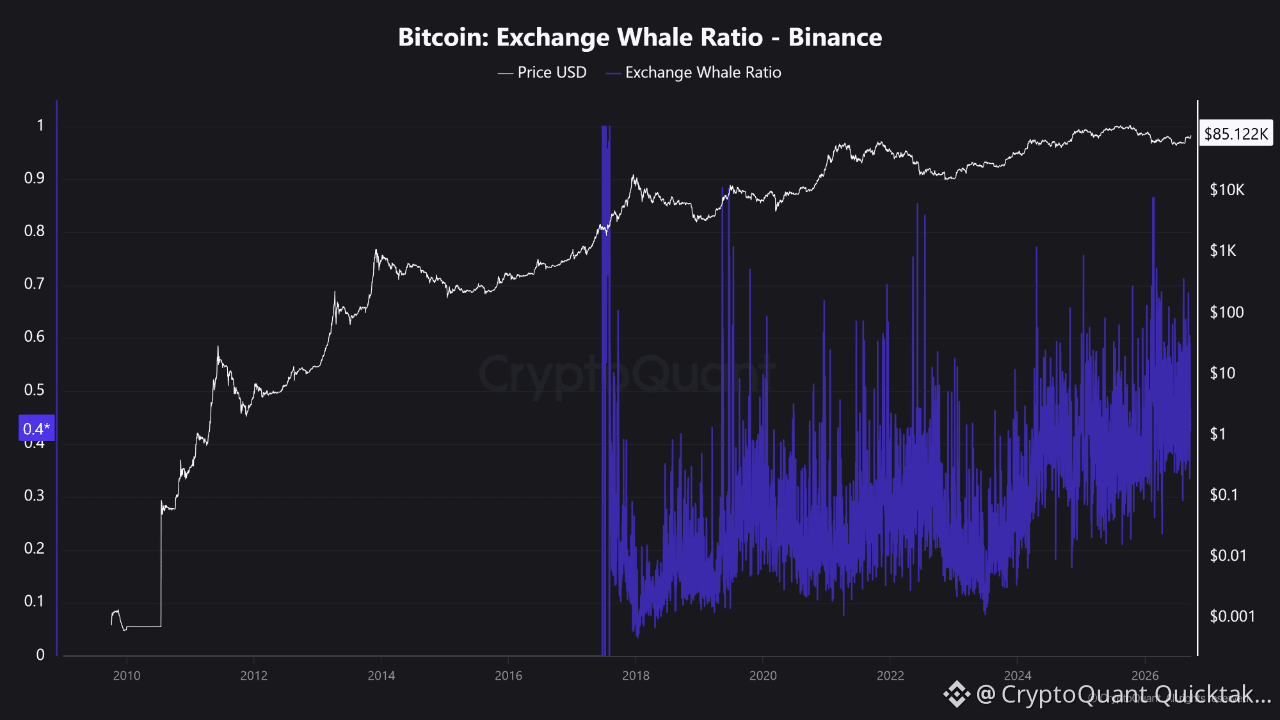
Bununla belə, on-chain mənzərə tam olaraq optimist deyil. CryptoQuant məlumatları sentyabrın 19-da Binance-in Bitcoin ehtiyatının təxminən 702,900 BTC olduğunu göstərdi; bu rəqəm iyulun sonundan təxminən 55,000 BTC daha çoxdur. Birjanadakı ehtiyatların artması dərhal satışa zəmanət vermir, amma satış üçün potensial olaraq mövcud olan BTC-nin miqdarını artırır. Binance-in Exchange Whale Ratio göstəricisi təxminən 0.43 idi, netflow isə təxminən 439 BTC müsbət idi; bu da bəzi sikkələrin hələ də birjaya yönləndiyini göstərir.
Bitcoin 86,000 ABŞ dollarını Aşır: Binance Ehtiyatları Xəbərdarlıq Siqnalı Qaldırır
Bitcoin 86,000 ABŞ dollarını keçərək səkkiz aylıq maksimuma çatdı. Rallinin üç əsas qüvvəsi var idi: ABŞ spot Bitcoin ETF-lərinə yenidən axınların başlaması, Xəzinə istiqrazlarının gəlirləri və neft qiymətlərinin azalması ilə riskə dair sentimentin yaxşılaşması və böyük həcmli short-squeeze. 24 saat ərzində təxminən 367 milyon ABŞ dolları dəyərində Bitcoin short-ları likvidasiya edilərək hərəkatı sürətləndirdi.
Bununla belə, on-chain mənzərə tam olaraq optimist deyil. CryptoQuant məlumatları sentyabrın 19-da Binance-in Bitcoin ehtiyatının təxminən 702,900 BTC olduğunu göstərdi; bu rəqəm iyulun sonundan təxminən 55,000 BTC daha çoxdur. Birjanadakı ehtiyatların artması dərhal satışa zəmanət vermir, amma satış üçün potensial olaraq mövcud olan BTC-nin miqdarını artırır. Binance-in Exchange Whale Ratio göstəricisi təxminən 0.43 idi, netflow isə təxminən 439 BTC müsbət idi; bu da bəzi sikkələrin hələ də birjaya yönləndiyini göstərir.
Bununla belə, on-chain mənzərə tam olaraq optimist deyil. CryptoQuant məlumatları sentyabrın 19-da Binance-in Bitcoin ehtiyatının təxminən 702,900 BTC olduğunu göstərdi; bu rəqəm iyulun sonundan təxminən 55,000 BTC daha çoxdur. Birjanadakı ehtiyatların artması dərhal satışa zəmanət vermir, amma satış üçün potensial olaraq mövcud olan BTC-nin miqdarını artırır. Binance-in Exchange Whale Ratio göstəricisi təxminən 0.43 idi, netflow isə təxminən 439 BTC müsbət idi; bu da bəzi sikkələrin hələ də birjaya yönləndiyini göstərir.
165
Məqalə
Tərcüməyə bax
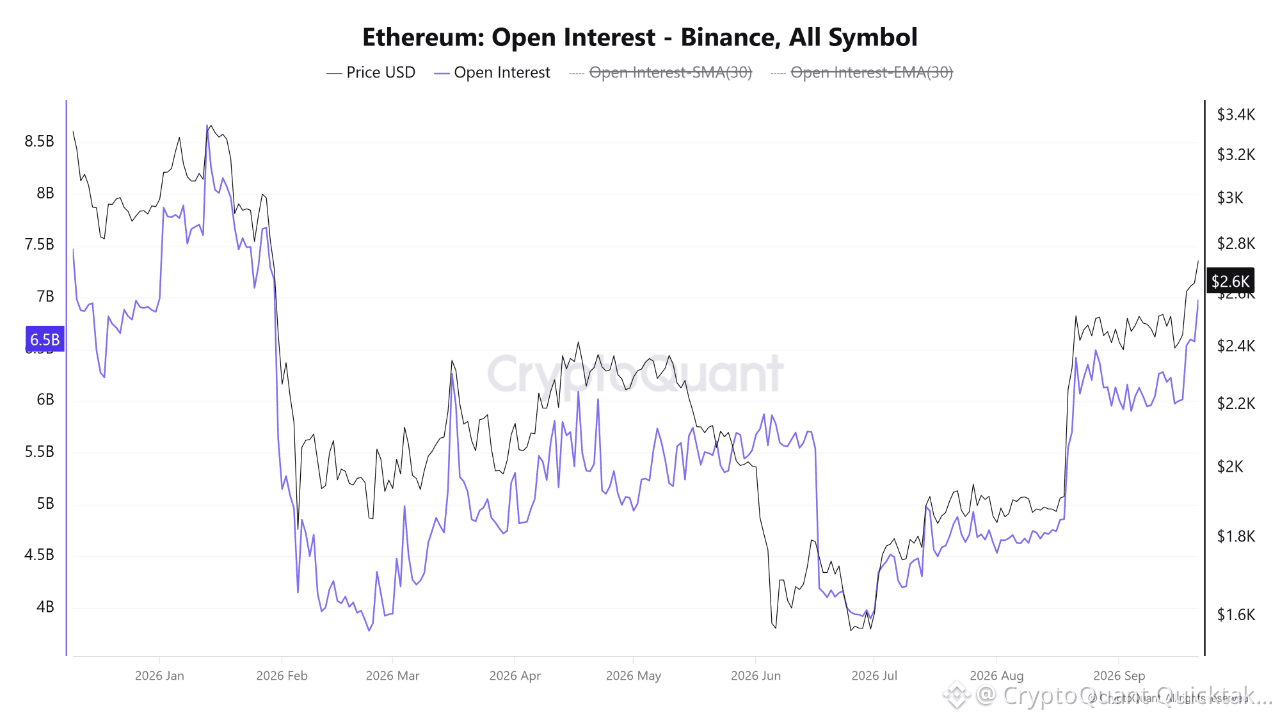
Ethereum Open Interest Hits a Nine-Month High on BinanceData reveals a notable rise in open interest for Ethereum contracts on Binance, coinciding with the recent upward movement in ETH prices. According to the data, open interest reached approximately $6.58 billion on its highest level since January—after hovering at significantly lower levels in the preceding weeks.
This surge follows a marked increase in open interest since late August, when it stood at around $4.8 billion before accelerating throughout September. At the same time, the price of Ethereum climbed to approximately $2,644, highlighting the concurrent rise in open positions and ETH’s price.
A rise in open interest reflects an increase in the value of outstanding contracts in the derivatives market, indicating greater participation and renewed activity in Ethereum contracts on Binance. The increase suggests that more capital is being allocated to open positions, highlighting stronger engagement in the Ethereum derivatives market and a notable expansion in overall market activity.
Nevertheless, the combination of rising prices and increased open interest shows that the recent market movement has been accompanied by heightened participation in the derivatives market
Written by Arab Chain
Ethereum Open Interest Hits a Nine-Month High on Binance
Data reveals a notable rise in open interest for Ethereum contracts on Binance, coinciding with the recent upward movement in ETH prices. According to the data, open interest reached approximately $6.58 billion on its highest level since January—after hovering at significantly lower levels in the preceding weeks.
This surge follows a marked increase in open interest since late August, when it stood at around $4.8 billion before accelerating throughout September. At the same time, the price of Ethereum climbed to approximately $2,644, highlighting the concurrent rise in open positions and ETH’s price.
A rise in open interest reflects an increase in the value of outstanding contracts in the derivatives market, indicating greater participation and renewed activity in Ethereum contracts on Binance. The increase suggests that more capital is being allocated to open positions, highlighting stronger engagement in the Ethereum derivatives market and a notable expansion in overall market activity.
Nevertheless, the combination of rising prices and increased open interest shows that the recent market movement has been accompanied by heightened participation in the derivatives market
Written by Arab Chain
This surge follows a marked increase in open interest since late August, when it stood at around $4.8 billion before accelerating throughout September. At the same time, the price of Ethereum climbed to approximately $2,644, highlighting the concurrent rise in open positions and ETH’s price.
A rise in open interest reflects an increase in the value of outstanding contracts in the derivatives market, indicating greater participation and renewed activity in Ethereum contracts on Binance. The increase suggests that more capital is being allocated to open positions, highlighting stronger engagement in the Ethereum derivatives market and a notable expansion in overall market activity.
Nevertheless, the combination of rising prices and increased open interest shows that the recent market movement has been accompanied by heightened participation in the derivatives market
Written by Arab Chain
178
Məqalə
Tərcüməyə bax
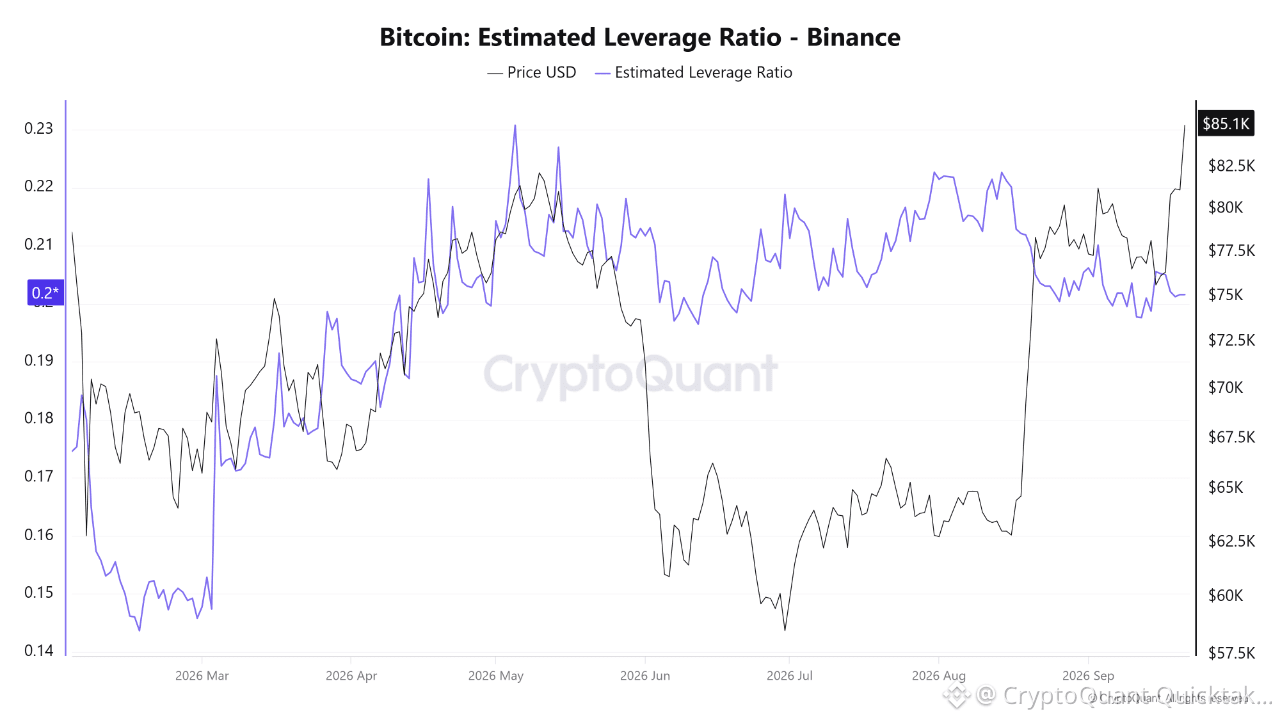
BTC Rises to $85K, but Leverage Still Hasn’t Heated UpBTC just moved up to ~$85.1K, but the Estimated Leverage Ratio on Binance is still around 0.20.
What caught my attention is that the leverage ratio has fallen quite clearly since late August, while BTC moved from around ~$77K to ~$85K.
In other words: price is rising, but leverage isn’t rising with it.
I see this as quite different from the situation in May, when the leverage ratio reached around 0.23 and the market was also much more leveraged.
If the current move continues while leverage stays around 0.20, this setup is more interesting than a pump driven by growing leverage. It’s not enough to call a trend yet, but at least Binance isn’t showing the same kind of leverage buildup we saw before.
That’s the part I’m watching.
Written by Rei Researcher
BTC Rises to $85K, but Leverage Still Hasn’t Heated Up
BTC just moved up to ~$85.1K, but the Estimated Leverage Ratio on Binance is still around 0.20.
What caught my attention is that the leverage ratio has fallen quite clearly since late August, while BTC moved from around ~$77K to ~$85K.
In other words: price is rising, but leverage isn’t rising with it.
I see this as quite different from the situation in May, when the leverage ratio reached around 0.23 and the market was also much more leveraged.
If the current move continues while leverage stays around 0.20, this setup is more interesting than a pump driven by growing leverage. It’s not enough to call a trend yet, but at least Binance isn’t showing the same kind of leverage buildup we saw before.
That’s the part I’m watching.
Written by Rei Researcher
What caught my attention is that the leverage ratio has fallen quite clearly since late August, while BTC moved from around ~$77K to ~$85K.
In other words: price is rising, but leverage isn’t rising with it.
I see this as quite different from the situation in May, when the leverage ratio reached around 0.23 and the market was also much more leveraged.
If the current move continues while leverage stays around 0.20, this setup is more interesting than a pump driven by growing leverage. It’s not enough to call a trend yet, but at least Binance isn’t showing the same kind of leverage buildup we saw before.
That’s the part I’m watching.
Written by Rei Researcher
1
1
279
Məqalə
Tərcüməyə bax
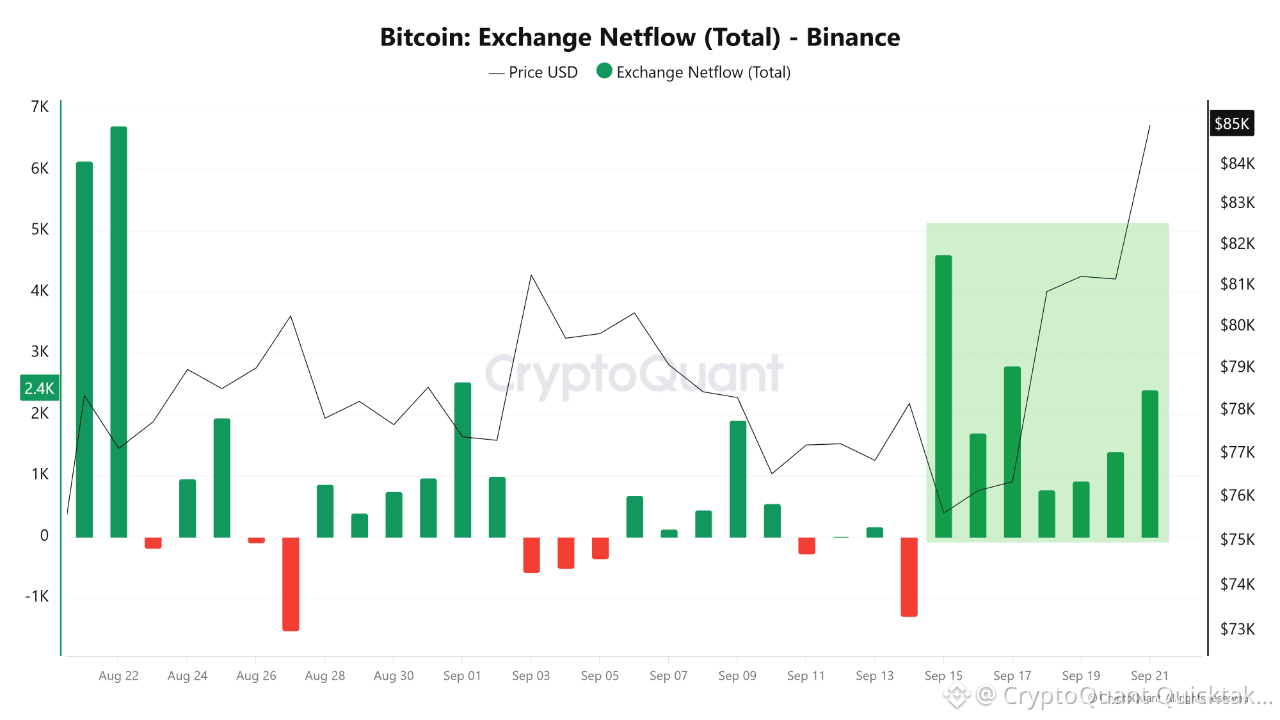
BTC Is Back At $85K, While Binance Sees Heavy Net InflowsBTC just pushed back to ~$85K, but Binance has seen a clear wave of positive exchange netflow over the past week.
The spike around Sep 15 stands out — roughly 4.6K BTC flowed into the exchange. Since then, netflow has stayed mostly positive, with several sizable inflows.
Normally, that’s something I’d watch carefully because more BTC moving onto an exchange can mean more potential sell-side supply.
But the interesting part is the price action.
BTC climbed from roughly $76K to $85K while these inflows were happening. That suggests the market has been able to absorb a meaningful amount of BTC moving onto Binance without breaking down.
I wouldn’t call positive netflow bullish on its own. But if these inflows continue and BTC keeps holding higher, the ability to absorb that supply becomes the more important signal.
That’s the part I’m watching.
Written by Rei Researcher
BTC Is Back At $85K, While Binance Sees Heavy Net Inflows
BTC just pushed back to ~$85K, but Binance has seen a clear wave of positive exchange netflow over the past week.
The spike around Sep 15 stands out — roughly 4.6K BTC flowed into the exchange. Since then, netflow has stayed mostly positive, with several sizable inflows.
Normally, that’s something I’d watch carefully because more BTC moving onto an exchange can mean more potential sell-side supply.
But the interesting part is the price action.
BTC climbed from roughly $76K to $85K while these inflows were happening. That suggests the market has been able to absorb a meaningful amount of BTC moving onto Binance without breaking down.
I wouldn’t call positive netflow bullish on its own. But if these inflows continue and BTC keeps holding higher, the ability to absorb that supply becomes the more important signal.
That’s the part I’m watching.
Written by Rei Researcher
The spike around Sep 15 stands out — roughly 4.6K BTC flowed into the exchange. Since then, netflow has stayed mostly positive, with several sizable inflows.
Normally, that’s something I’d watch carefully because more BTC moving onto an exchange can mean more potential sell-side supply.
But the interesting part is the price action.
BTC climbed from roughly $76K to $85K while these inflows were happening. That suggests the market has been able to absorb a meaningful amount of BTC moving onto Binance without breaking down.
I wouldn’t call positive netflow bullish on its own. But if these inflows continue and BTC keeps holding higher, the ability to absorb that supply becomes the more important signal.
That’s the part I’m watching.
Written by Rei Researcher
133
Məqalə
BTC 84K-dan Yuxarı Qayıtdıqca Böyük Fil Depozitləri Binance-ə Daxil OlubBitcoin bərpa olunmasını davam etdirib və sentyabrın 21-də ayın əvvəlindəki orta 75 min ABŞ dolları səviyyələrindən geri qayıtdıqdan sonra 84.000–85.000 ABŞ dolları aralığında ticarət edir.
Onçeyn məlumatlar son sessiyalarda Binance-ə bir neçə diqqətçəkən böyük köçürməni göstərir. BIT ilə əlaqəli (əvvəllər Matrixport) bir cüzdan çoxsaylı əməliyyatlar üzrə təxminən 2.400 BTC depozit edib; bunlara sentyabrın 15-də edilən 1.400 BTC köçürməsi və sentyabrın 19-da edilən digər 1.000 BTC köçürməsi daxildir. Mədənçiliklə bağlı bir ünvanından edilən 700 BTC-lik köçürmə də daxil olmaqla əlavə böyük depozitlər qeydə alınıb.
BTC 84K-dan Yuxarı Qayıtdıqca Böyük Fil Depozitləri Binance-ə Daxil Olub
Bitcoin bərpa olunmasını davam etdirib və sentyabrın 21-də ayın əvvəlindəki orta 75 min ABŞ dolları səviyyələrindən geri qayıtdıqdan sonra 84.000–85.000 ABŞ dolları aralığında ticarət edir.
Onçeyn məlumatlar son sessiyalarda Binance-ə bir neçə diqqətçəkən böyük köçürməni göstərir. BIT ilə əlaqəli (əvvəllər Matrixport) bir cüzdan çoxsaylı əməliyyatlar üzrə təxminən 2.400 BTC depozit edib; bunlara sentyabrın 15-də edilən 1.400 BTC köçürməsi və sentyabrın 19-da edilən digər 1.000 BTC köçürməsi daxildir. Mədənçiliklə bağlı bir ünvanından edilən 700 BTC-lik köçürmə də daxil olmaqla əlavə böyük depozitlər qeydə alınıb.
Onçeyn məlumatlar son sessiyalarda Binance-ə bir neçə diqqətçəkən böyük köçürməni göstərir. BIT ilə əlaqəli (əvvəllər Matrixport) bir cüzdan çoxsaylı əməliyyatlar üzrə təxminən 2.400 BTC depozit edib; bunlara sentyabrın 15-də edilən 1.400 BTC köçürməsi və sentyabrın 19-da edilən digər 1.000 BTC köçürməsi daxildir. Mədənçiliklə bağlı bir ünvanından edilən 700 BTC-lik köçürmə də daxil olmaqla əlavə böyük depozitlər qeydə alınıb.
1
183
Məqalə
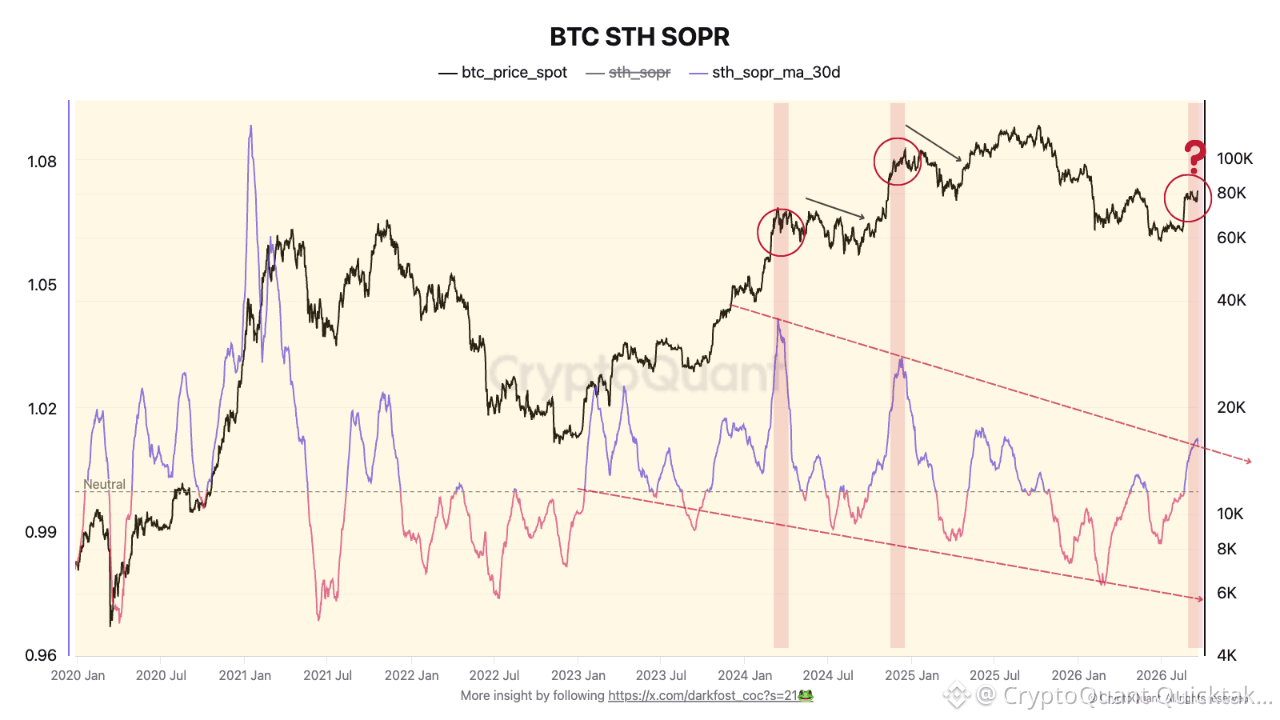
Bitcoinin Bərpası Qısamüddətli Sahiblərin Mənfəətə Satış Sınağı ilə ÜzləşirBitcoinin 80 min dollara doğru bərpası Qısamüddətli Sahib SOPR-nin 30 günlük hərəkətli ortalamasını yenidən 1-dən yuxarı itələdi.
Zərərə məruz qalma mərhələsindən sonra yaxınlarda hərəkət etdirilmiş sikkələr yenidən ümumilikdə mənfəət içində xərclənir. Qiymətin altında bu, reallaşdırılmış gəlirliliyin yaxşılaşdığını göstərir; eyni zamanda, investorların yüksəlişdən istifadə edib çıxmaq üçün imkan yaradır.
Tarixən bu keçid bazar şəraitindən asılı olaraq müxtəlif nəticələrə malik olub.
Davamlı yüksəlişlər dövründə mənfəət reallaşdırılması artan qiymətlərlə birgə mövcud ola bilər, çünki tələbat mövcud təklifi udur. Daha zəif bərpa proseslərində isə gəlirliliyə qayıdış bazarın udmaqda çətinlik çəkdiyi satışa həvəsləndirə bilər.
Bitcoinin Bərpası Qısamüddətli Sahiblərin Mənfəətə Satış Sınağı ilə Üzləşir
Bitcoinin 80 min dollara doğru bərpası Qısamüddətli Sahib SOPR-nin 30 günlük hərəkətli ortalamasını yenidən 1-dən yuxarı itələdi.
Zərərə məruz qalma mərhələsindən sonra yaxınlarda hərəkət etdirilmiş sikkələr yenidən ümumilikdə mənfəət içində xərclənir. Qiymətin altında bu, reallaşdırılmış gəlirliliyin yaxşılaşdığını göstərir; eyni zamanda, investorların yüksəlişdən istifadə edib çıxmaq üçün imkan yaradır.
Tarixən bu keçid bazar şəraitindən asılı olaraq müxtəlif nəticələrə malik olub.
Davamlı yüksəlişlər dövründə mənfəət reallaşdırılması artan qiymətlərlə birgə mövcud ola bilər, çünki tələbat mövcud təklifi udur. Daha zəif bərpa proseslərində isə gəlirliliyə qayıdış bazarın udmaqda çətinlik çəkdiyi satışa həvəsləndirə bilər.
Zərərə məruz qalma mərhələsindən sonra yaxınlarda hərəkət etdirilmiş sikkələr yenidən ümumilikdə mənfəət içində xərclənir. Qiymətin altında bu, reallaşdırılmış gəlirliliyin yaxşılaşdığını göstərir; eyni zamanda, investorların yüksəlişdən istifadə edib çıxmaq üçün imkan yaradır.
Tarixən bu keçid bazar şəraitindən asılı olaraq müxtəlif nəticələrə malik olub.
Davamlı yüksəlişlər dövründə mənfəət reallaşdırılması artan qiymətlərlə birgə mövcud ola bilər, çünki tələbat mövcud təklifi udur. Daha zəif bərpa proseslərində isə gəlirliliyə qayıdış bazarın udmaqda çətinlik çəkdiyi satışa həvəsləndirə bilər.
1
231
Məqalə
Tərcüməyə bax
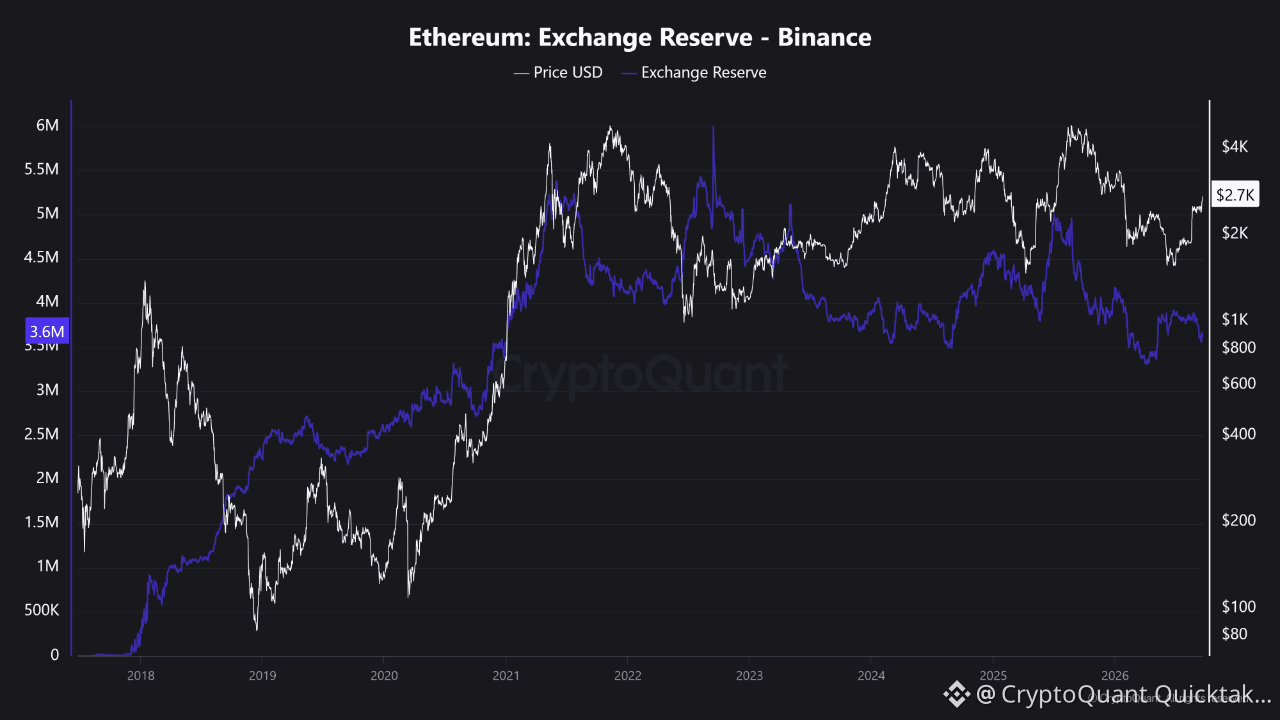
Binance ETH Withdrawals Stay Elevated As Price Breaks Above $2,700Ethereum has extended its recovery, trading around $2,700–$2,720 on Sept 21 after reclaiming the $2,600 level earlier in the week.
CryptoQuant data shows that withdrawal activity on Binance remains notably elevated. Recent data indicates that the monthly average of ETH withdrawal transactions on Binance has climbed to levels not seen since 2023, roughly double the pace recorded at the start of the year. This sustained outflow activity has coincided with the strong price recovery from the mid-$2,300–$2,400 range.
Elevated withdrawals typically reduce the amount of ETH immediately available for sale on the exchange. When this occurs during a clear upward move, it can reflect accumulation or longer-term positioning as holders move coins off-platform. At the same time, earlier sessions in mid-September also recorded meaningful net outflows from Binance, including multi-hundred-million-dollar readings, adding to the broader pattern of ETH leaving the largest exchange.
The current setup creates a constructive on-chain backdrop: price is advancing while liquid ETH supply on Binance is being drawn down through elevated withdrawal activity. For the move to remain healthy, continued net outflows or stable-to-declining reserves would support the idea that demand is absorbing available supply rather than being met by fresh deposits.
Traders should monitor whether Binance ETH netflows remain negative and whether reserve levels continue to trend lower as price tests higher resistance zones.
Written by theophiluspep
Binance ETH Withdrawals Stay Elevated As Price Breaks Above $2,700
Ethereum has extended its recovery, trading around $2,700–$2,720 on Sept 21 after reclaiming the $2,600 level earlier in the week.
CryptoQuant data shows that withdrawal activity on Binance remains notably elevated. Recent data indicates that the monthly average of ETH withdrawal transactions on Binance has climbed to levels not seen since 2023, roughly double the pace recorded at the start of the year. This sustained outflow activity has coincided with the strong price recovery from the mid-$2,300–$2,400 range.
Elevated withdrawals typically reduce the amount of ETH immediately available for sale on the exchange. When this occurs during a clear upward move, it can reflect accumulation or longer-term positioning as holders move coins off-platform. At the same time, earlier sessions in mid-September also recorded meaningful net outflows from Binance, including multi-hundred-million-dollar readings, adding to the broader pattern of ETH leaving the largest exchange.
The current setup creates a constructive on-chain backdrop: price is advancing while liquid ETH supply on Binance is being drawn down through elevated withdrawal activity. For the move to remain healthy, continued net outflows or stable-to-declining reserves would support the idea that demand is absorbing available supply rather than being met by fresh deposits.
Traders should monitor whether Binance ETH netflows remain negative and whether reserve levels continue to trend lower as price tests higher resistance zones.
Written by theophiluspep
CryptoQuant data shows that withdrawal activity on Binance remains notably elevated. Recent data indicates that the monthly average of ETH withdrawal transactions on Binance has climbed to levels not seen since 2023, roughly double the pace recorded at the start of the year. This sustained outflow activity has coincided with the strong price recovery from the mid-$2,300–$2,400 range.
Elevated withdrawals typically reduce the amount of ETH immediately available for sale on the exchange. When this occurs during a clear upward move, it can reflect accumulation or longer-term positioning as holders move coins off-platform. At the same time, earlier sessions in mid-September also recorded meaningful net outflows from Binance, including multi-hundred-million-dollar readings, adding to the broader pattern of ETH leaving the largest exchange.
The current setup creates a constructive on-chain backdrop: price is advancing while liquid ETH supply on Binance is being drawn down through elevated withdrawal activity. For the move to remain healthy, continued net outflows or stable-to-declining reserves would support the idea that demand is absorbing available supply rather than being met by fresh deposits.
Traders should monitor whether Binance ETH netflows remain negative and whether reserve levels continue to trend lower as price tests higher resistance zones.
Written by theophiluspep
1
200
Məqalə
Tərcüməyə bax
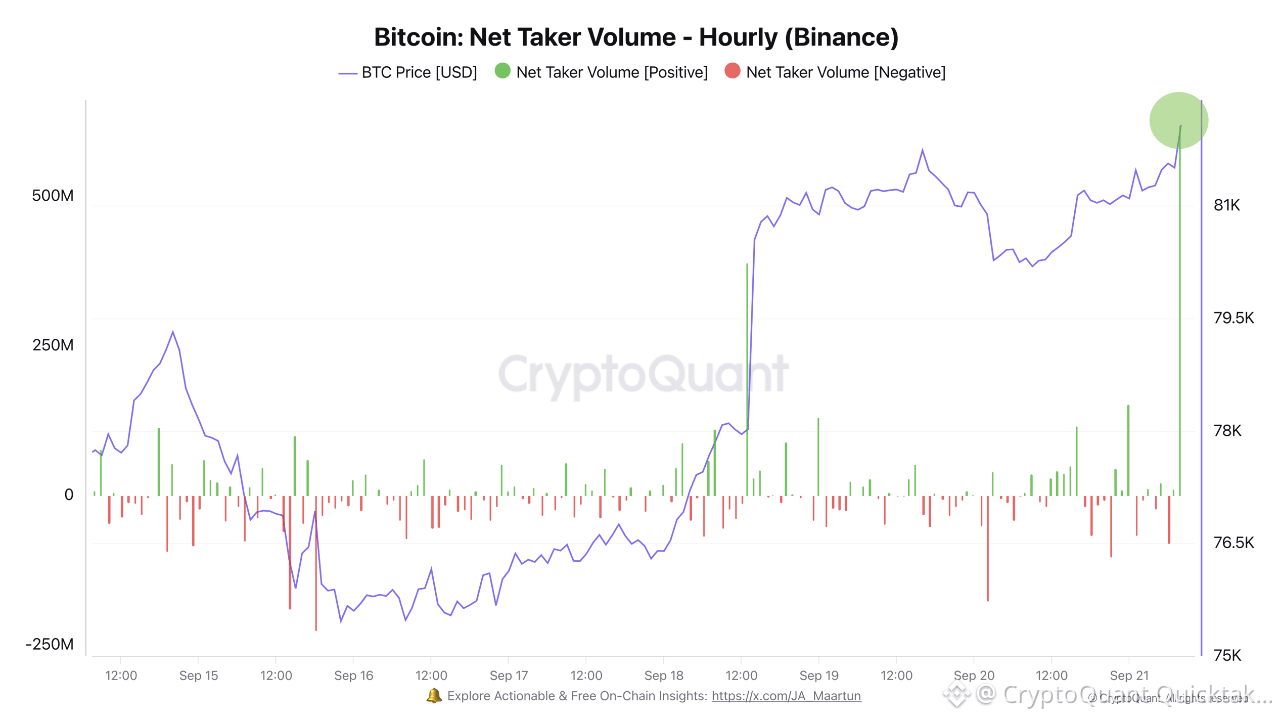
Geopolitical De-escalation Sparks $618M in Net Taker Volume, Wiping Out Bitcoin ShortsThis weekend, which looked set to be complicated on the geopolitical front, ended with the abandonment of a massive military operation that the United States had been preparing.
This positive news, relayed last night, allowed markets to wake up in the green.
That was all speculators needed to shake up the Bitcoin derivatives market hard this morning. Within an hour, net taker volume jumped from +$11 million to +$618 million on Binance at the opening of European markets.
It is fairly rare to see this much buying power flow into derivatives in such a short time.
This burst of positivity liquidated more than $400 million in short positions across the entire crypto market, helping Bitcoin break above $85 000. This marks a trend change, as it is a break of structure relative to the May high.
Despite a context that remains tense, Bitcoin appears to be continuing its momentum, notably fueled by investors who still don't believe in it and are positioning against the crowd.
Written by Darkfost
Geopolitical De-escalation Sparks $618M in Net Taker Volume, Wiping Out Bitcoin Shorts
This weekend, which looked set to be complicated on the geopolitical front, ended with the abandonment of a massive military operation that the United States had been preparing.
This positive news, relayed last night, allowed markets to wake up in the green.
That was all speculators needed to shake up the Bitcoin derivatives market hard this morning. Within an hour, net taker volume jumped from +$11 million to +$618 million on Binance at the opening of European markets.
It is fairly rare to see this much buying power flow into derivatives in such a short time.
This burst of positivity liquidated more than $400 million in short positions across the entire crypto market, helping Bitcoin break above $85 000. This marks a trend change, as it is a break of structure relative to the May high.
Despite a context that remains tense, Bitcoin appears to be continuing its momentum, notably fueled by investors who still don't believe in it and are positioning against the crowd.
Written by Darkfost
This positive news, relayed last night, allowed markets to wake up in the green.
That was all speculators needed to shake up the Bitcoin derivatives market hard this morning. Within an hour, net taker volume jumped from +$11 million to +$618 million on Binance at the opening of European markets.
It is fairly rare to see this much buying power flow into derivatives in such a short time.
This burst of positivity liquidated more than $400 million in short positions across the entire crypto market, helping Bitcoin break above $85 000. This marks a trend change, as it is a break of structure relative to the May high.
Despite a context that remains tense, Bitcoin appears to be continuing its momentum, notably fueled by investors who still don't believe in it and are positioning against the crowd.
Written by Darkfost
163
Məqalə
Tərcüməyə bax
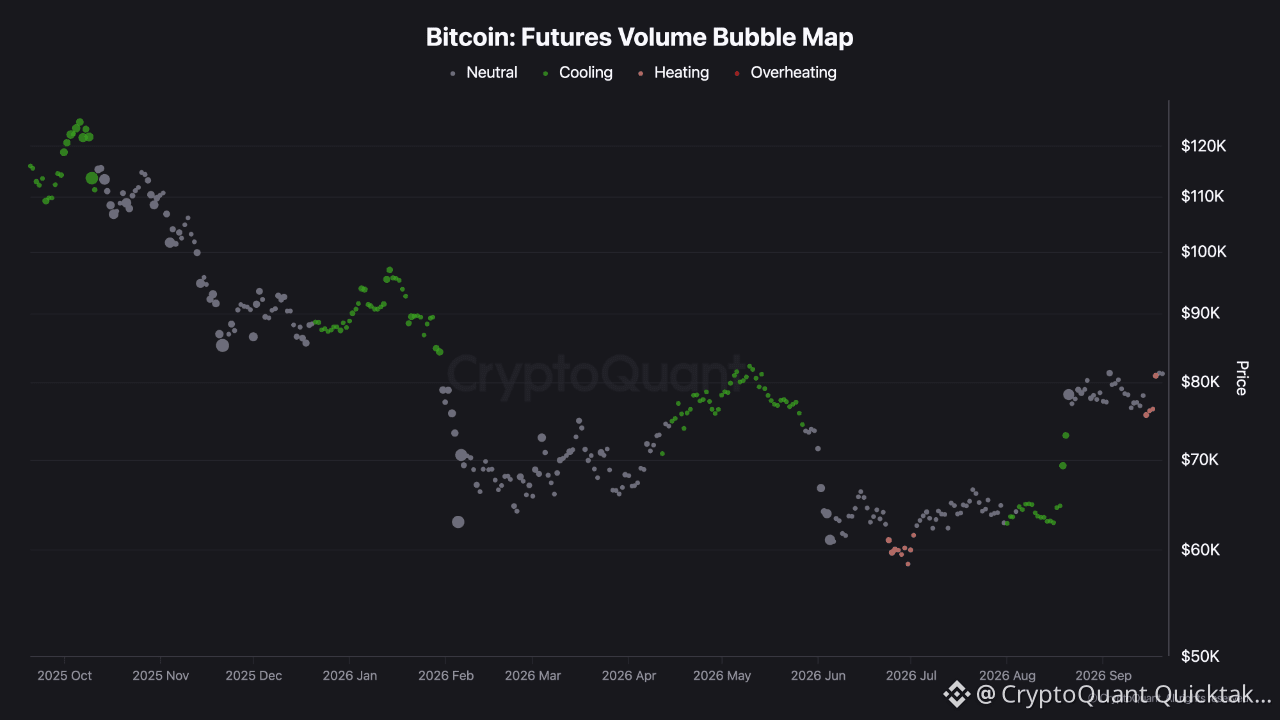
Bitcoin Heats Up: Crossing $80K and Eyeing the 2-Year MA for a Strong Bull TrendBitcoin has recently hit the $80,000 mark, signaling that the market is beginning to heat up, as indicated by the Futures Volume Bubble Map. The price is currently advancing toward $85,000, having successfully surpassed the 1-year moving average (MA) of $80,061. If this upward momentum continues and Bitcoin breaks through the critical 2-year MA resistance level at $88,761, it could trigger a highly robust and sustained bullish trend.
Written by nino
Bitcoin Heats Up: Crossing $80K and Eyeing the 2-Year MA for a Strong Bull Trend
Bitcoin has recently hit the $80,000 mark, signaling that the market is beginning to heat up, as indicated by the Futures Volume Bubble Map. The price is currently advancing toward $85,000, having successfully surpassed the 1-year moving average (MA) of $80,061. If this upward momentum continues and Bitcoin breaks through the critical 2-year MA resistance level at $88,761, it could trigger a highly robust and sustained bullish trend.
Written by nino
Written by nino
100
Məqalə
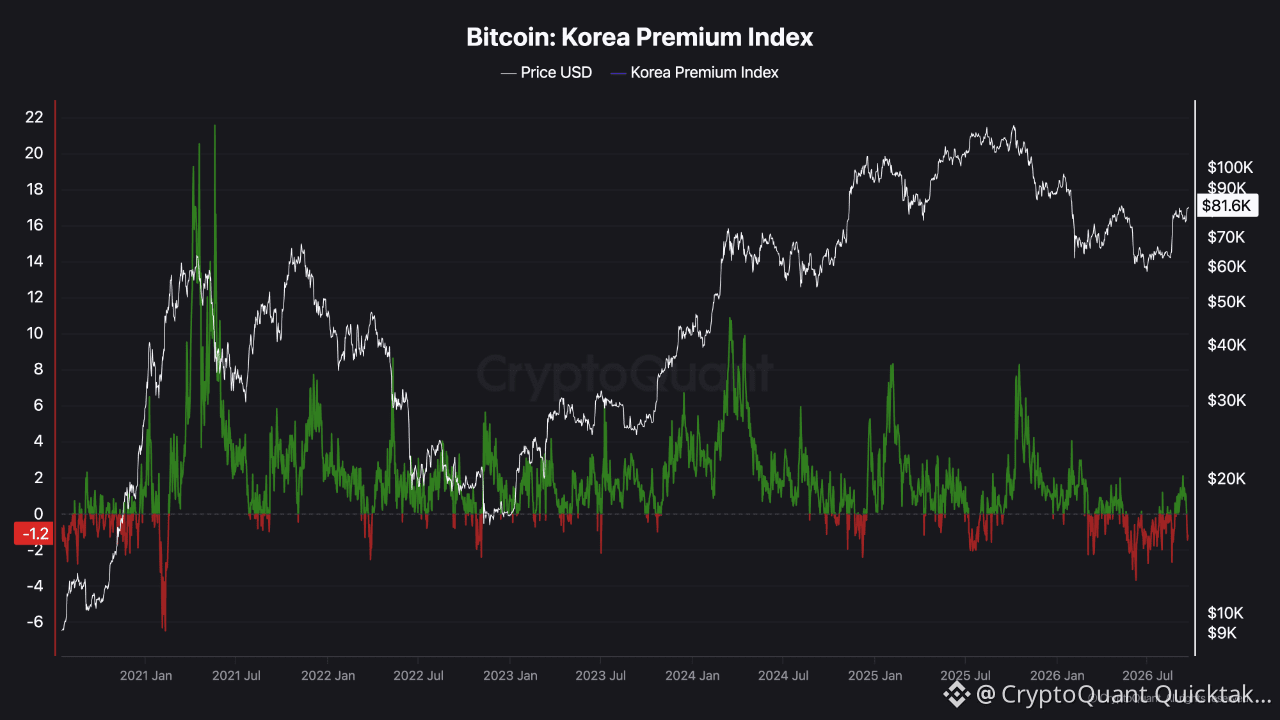
Koreya Premiumu Mənfi Dönür: Pərakəndə Həddən Artıq İstilik Yoxdur, Amma Təkbaşına Boğa Siqnalı Da DeyilKoreya Premium İndeksi Cənubi Koreyadakı birjalarda kriptoaktivlərin qiyməti ilə qlobal bazarlar arasındakı fərqi ölçür.
İndeks güclü müsbət olduqda, Koreya birjaları BTC-ni qlobal platformalardan yuxarı qiymətləndirir.
Bu, çox vaxt güclü yerli alış tələbi, spekulyativ iştirak və adətən “Kimchi Premium” kimi tanınan vəziyyətlə əlaqələndirilir.
Cənubi Koreya tarixi olaraq daha aktiv kripto bazarlarından biri olduğuna görə, yüksəlmiş Koreya Premium göstəriciləri pərakəndə (retail) həvəsin həddən artıq istiləşib-istiləşmədiyini qiymətləndirərkən faydalı ola bilər.
Koreya Premiumu Mənfi Dönür: Pərakəndə Həddən Artıq İstilik Yoxdur, Amma Təkbaşına Boğa Siqnalı Da Deyil
Koreya Premium İndeksi Cənubi Koreyadakı birjalarda kriptoaktivlərin qiyməti ilə qlobal bazarlar arasındakı fərqi ölçür.
İndeks güclü müsbət olduqda, Koreya birjaları BTC-ni qlobal platformalardan yuxarı qiymətləndirir.
Bu, çox vaxt güclü yerli alış tələbi, spekulyativ iştirak və adətən “Kimchi Premium” kimi tanınan vəziyyətlə əlaqələndirilir.
Cənubi Koreya tarixi olaraq daha aktiv kripto bazarlarından biri olduğuna görə, yüksəlmiş Koreya Premium göstəriciləri pərakəndə (retail) həvəsin həddən artıq istiləşib-istiləşmədiyini qiymətləndirərkən faydalı ola bilər.
İndeks güclü müsbət olduqda, Koreya birjaları BTC-ni qlobal platformalardan yuxarı qiymətləndirir.
Bu, çox vaxt güclü yerli alış tələbi, spekulyativ iştirak və adətən “Kimchi Premium” kimi tanınan vəziyyətlə əlaqələndirilir.
Cənubi Koreya tarixi olaraq daha aktiv kripto bazarlarından biri olduğuna görə, yüksəlmiş Koreya Premium göstəriciləri pərakəndə (retail) həvəsin həddən artıq istiləşib-istiləşmədiyini qiymətləndirərkən faydalı ola bilər.
1
116
Məqalə
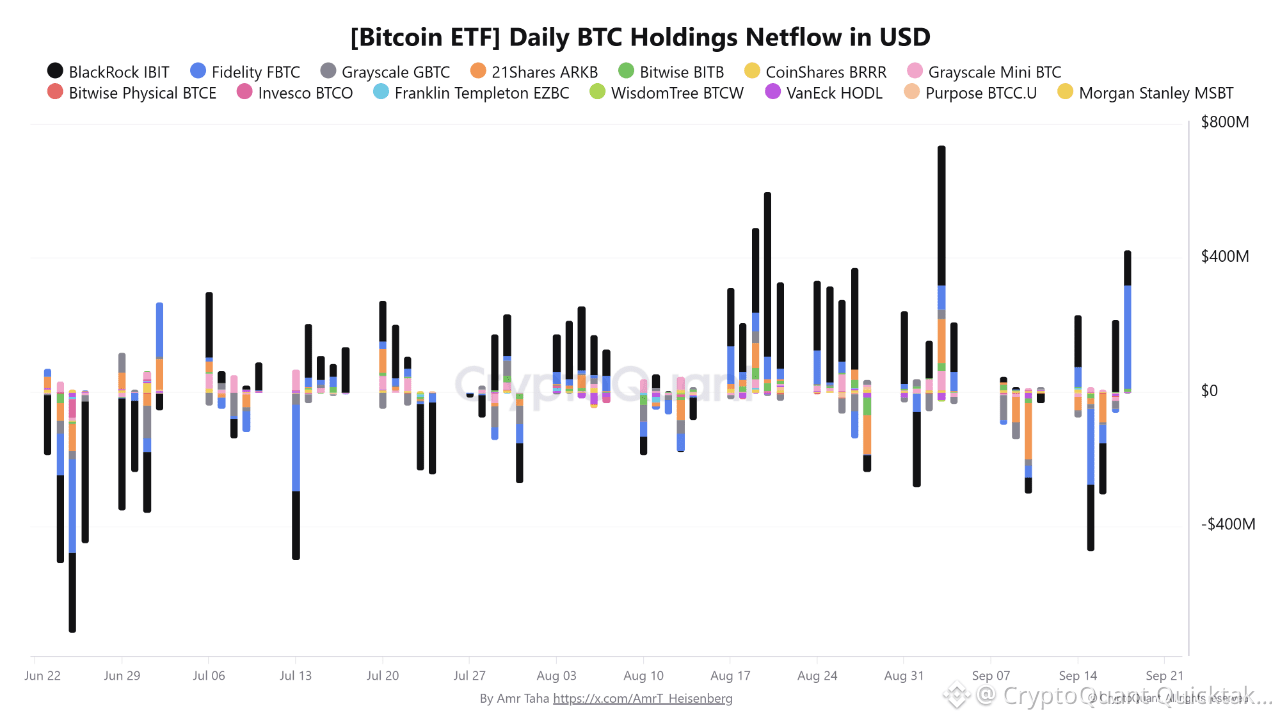
Fidelity FBTC Holdings Netflow 4,2 dəfə artır; Bitcoin ETF liderliyi BlackRock-dan flip edirBitcoin ETF-lərində axın liderliyi cəmi iki həftədən az müddətdə kəskin şəkildə tərsinə döndü: Fidelity-nin FBTC-si, iki fondun sentyabrın 3-dəki göstəricilərindən fərqli olaraq əks istiqamətlərə hərəkət etməsindən sonra BlackRock-un IBIT-ni qabaqladı.
18 sentyabrda FBTC təxminən 306 milyon ABŞ dolları həcmində müsbət BTC holdingləri üzrə xalis axın qeydə aldı; bu, IBIT-in 105 milyon ABŞ dollarına nisbətən təxminən 2,9 dəfədir.
Bu, sentyabrın 3-dən başlayan kəskin geri dönüşdür: həmin gün IBIT təxminən 422,75 milyon ABŞ dolları, FBTC-nin isə 73,5 milyon ABŞ dolları qeydə almışdı; yəni təxminən 5,75 dəfə.
Bu dəyişiklik həm də ABŞ-ın spot Bitcoin ETF nağd axın məlumatlarında daha geniş miqyasda özünü göstərdi.
Fidelity FBTC Holdings Netflow 4,2 dəfə artır; Bitcoin ETF liderliyi BlackRock-dan flip edir
Bitcoin ETF-lərində axın liderliyi cəmi iki həftədən az müddətdə kəskin şəkildə tərsinə döndü: Fidelity-nin FBTC-si, iki fondun sentyabrın 3-dəki göstəricilərindən fərqli olaraq əks istiqamətlərə hərəkət etməsindən sonra BlackRock-un IBIT-ni qabaqladı.
18 sentyabrda FBTC təxminən 306 milyon ABŞ dolları həcmində müsbət BTC holdingləri üzrə xalis axın qeydə aldı; bu, IBIT-in 105 milyon ABŞ dollarına nisbətən təxminən 2,9 dəfədir.
Bu, sentyabrın 3-dən başlayan kəskin geri dönüşdür: həmin gün IBIT təxminən 422,75 milyon ABŞ dolları, FBTC-nin isə 73,5 milyon ABŞ dolları qeydə almışdı; yəni təxminən 5,75 dəfə.
Bu dəyişiklik həm də ABŞ-ın spot Bitcoin ETF nağd axın məlumatlarında daha geniş miqyasda özünü göstərdi.
18 sentyabrda FBTC təxminən 306 milyon ABŞ dolları həcmində müsbət BTC holdingləri üzrə xalis axın qeydə aldı; bu, IBIT-in 105 milyon ABŞ dollarına nisbətən təxminən 2,9 dəfədir.
Bu, sentyabrın 3-dən başlayan kəskin geri dönüşdür: həmin gün IBIT təxminən 422,75 milyon ABŞ dolları, FBTC-nin isə 73,5 milyon ABŞ dolları qeydə almışdı; yəni təxminən 5,75 dəfə.
Bu dəyişiklik həm də ABŞ-ın spot Bitcoin ETF nağd axın məlumatlarında daha geniş miqyasda özünü göstərdi.
2
214
Məqalə
Tərcüməyə bax
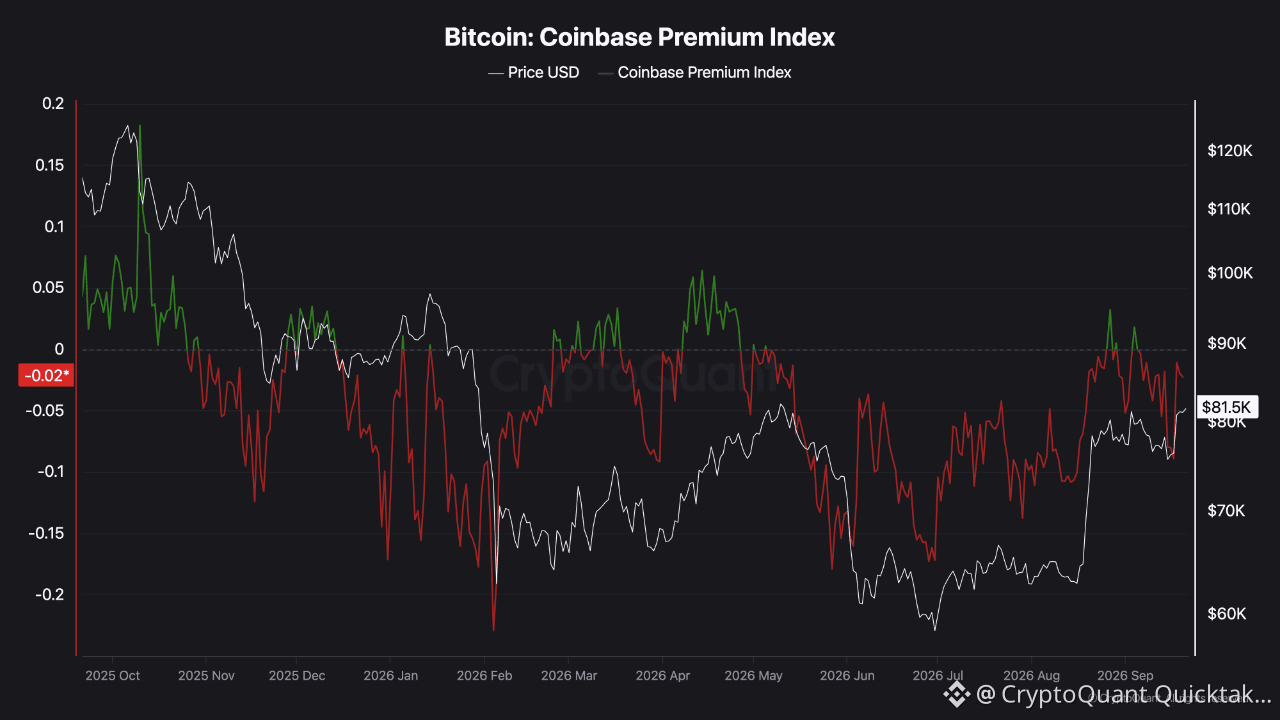
Coinbase Premium Turns Negative Again: U.S. Spot Demand Still Lacks ConfirmationThe Coinbase Premium Index measures the price difference between BTC on Coinbase’s USD market and Binance’s USDT market.
In simple terms:
• Positive premium → BTC trades higher on Coinbase, suggesting relatively stronger buying demand from the U.S. market.
• Negative premium → BTC trades cheaper on Coinbase, suggesting weaker U.S. demand or relatively stronger selling pressure.
The current Coinbase Premium Index is around -0.02, while BTC is trading near $81.5K.
The key point is that the premium has slipped back below zero after briefly turning positive.
This means the recent BTC recovery is not yet being accompanied by consistently stronger demand from Coinbase compared with Binance.
Historically, sustained positive Coinbase premiums have often appeared alongside stronger price appreciation because U.S. spot demand was actively leading the move.
For the current rally, I would therefore watch whether the premium can:
• Reclaim 0
• Stay positive
• Expand together with BTC price
That would provide stronger confirmation that U.S.-based spot demand is participating in the move.
On the other hand, if BTC continues rising while the Coinbase Premium remains negative, it may suggest that the rally is being driven more by other venues rather than strong U.S. spot demand.
This is not a direct bearish signal.
The current reading is only slightly negative, not at an extreme level.
But from a market-structure perspective, a sustained return to positive territory would make the current BTC recovery more convincing.
For now, the price is recovering, but Coinbase Premium has not yet confirmed the move.
Tags:
BTC / Market Analysis / Short-term
Written by Trdaer_Gemini
Coinbase Premium Turns Negative Again: U.S. Spot Demand Still Lacks Confirmation
The Coinbase Premium Index measures the price difference between BTC on Coinbase’s USD market and Binance’s USDT market.
In simple terms:
• Positive premium → BTC trades higher on Coinbase, suggesting relatively stronger buying demand from the U.S. market.
• Negative premium → BTC trades cheaper on Coinbase, suggesting weaker U.S. demand or relatively stronger selling pressure.
The current Coinbase Premium Index is around -0.02, while BTC is trading near $81.5K.
The key point is that the premium has slipped back below zero after briefly turning positive.
This means the recent BTC recovery is not yet being accompanied by consistently stronger demand from Coinbase compared with Binance.
Historically, sustained positive Coinbase premiums have often appeared alongside stronger price appreciation because U.S. spot demand was actively leading the move.
For the current rally, I would therefore watch whether the premium can:
• Reclaim 0
• Stay positive
• Expand together with BTC price
That would provide stronger confirmation that U.S.-based spot demand is participating in the move.
On the other hand, if BTC continues rising while the Coinbase Premium remains negative, it may suggest that the rally is being driven more by other venues rather than strong U.S. spot demand.
This is not a direct bearish signal.
The current reading is only slightly negative, not at an extreme level.
But from a market-structure perspective, a sustained return to positive territory would make the current BTC recovery more convincing.
For now, the price is recovering, but Coinbase Premium has not yet confirmed the move.
Tags:
BTC / Market Analysis / Short-term
Written by Trdaer_Gemini
In simple terms:
• Positive premium → BTC trades higher on Coinbase, suggesting relatively stronger buying demand from the U.S. market.
• Negative premium → BTC trades cheaper on Coinbase, suggesting weaker U.S. demand or relatively stronger selling pressure.
The current Coinbase Premium Index is around -0.02, while BTC is trading near $81.5K.
The key point is that the premium has slipped back below zero after briefly turning positive.
This means the recent BTC recovery is not yet being accompanied by consistently stronger demand from Coinbase compared with Binance.
Historically, sustained positive Coinbase premiums have often appeared alongside stronger price appreciation because U.S. spot demand was actively leading the move.
For the current rally, I would therefore watch whether the premium can:
• Reclaim 0
• Stay positive
• Expand together with BTC price
That would provide stronger confirmation that U.S.-based spot demand is participating in the move.
On the other hand, if BTC continues rising while the Coinbase Premium remains negative, it may suggest that the rally is being driven more by other venues rather than strong U.S. spot demand.
This is not a direct bearish signal.
The current reading is only slightly negative, not at an extreme level.
But from a market-structure perspective, a sustained return to positive territory would make the current BTC recovery more convincing.
For now, the price is recovering, but Coinbase Premium has not yet confirmed the move.
Tags:
BTC / Market Analysis / Short-term
Written by Trdaer_Gemini
1
77
Məqalə
Tərcüməyə bax
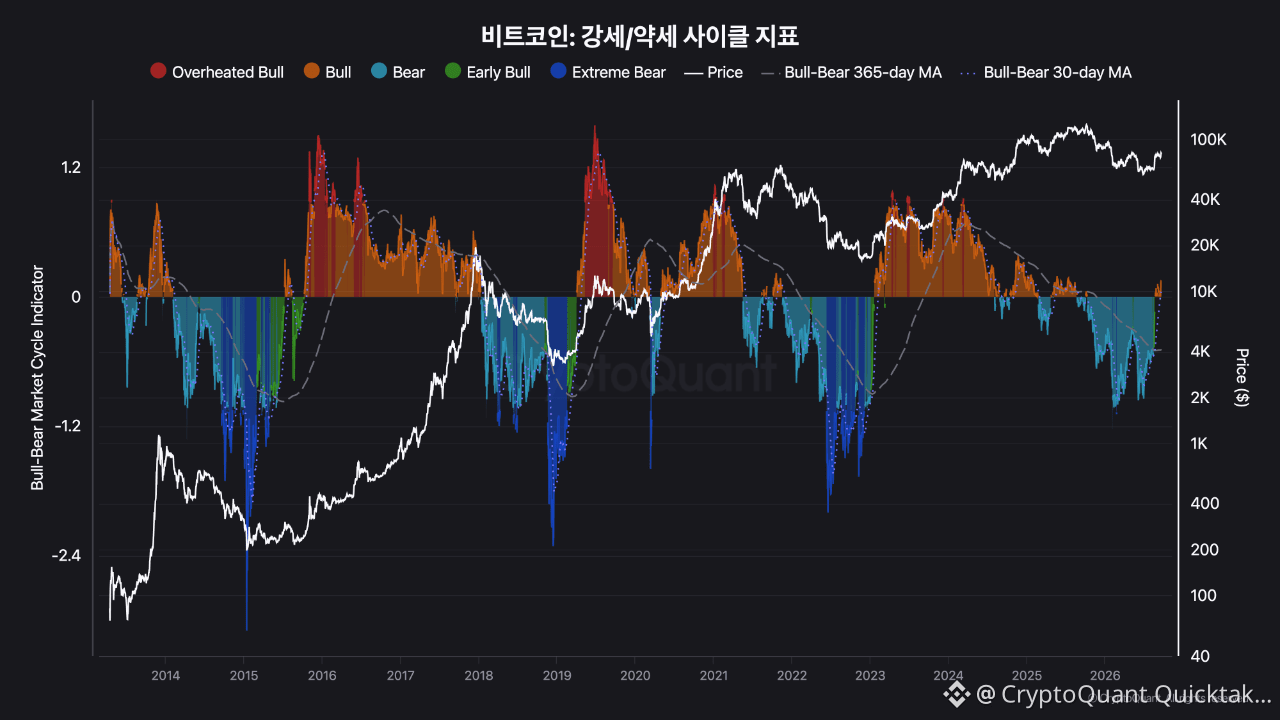
Bitcoin Bull–Bear Cycle Indicator Remains in a Bullish RegimeThe Bull–Bear Market Cycle Indicator is a momentum indicator derived from the difference between the Profit & Loss Index and its 365-day moving average.
In simple terms:
- Above 0 → bullish cycle regime
- Below 0 and below its own 365-day MA → bearish cycle regime
The important point is that this indicator measures the distance from its moving average, rather than the absolute level of the index itself. Because of this, changes in momentum can appear before price fully confirms a cycle transition.
The current reading remains above 0, indicating that Bitcoin is still in a bullish cycle regime.
Historically, once the indicator entered a positive regime, Bitcoin often maintained a directional trend for an extended period rather than immediately reversing. From a spot-holder perspective, this suggests that there may still be room to maintain exposure while the indicator remains above 0.
However, the level should not be interpreted in a binary way.
Even while the indicator remains positive, a gradual decline toward 0 can be important. In previous cycles, shrinking positive momentum sometimes appeared during the later stages of an uptrend before price clearly confirmed the transition.
So the key is not only whether the indicator is positive today, but also whether its positive momentum is expanding or beginning to contract.
For now, the broader cycle signal remains bullish.
A sustained move back below 0 would be a much more meaningful warning that the current bullish regime is weakening.
Written by Trdaer_Gemini
Bitcoin Bull–Bear Cycle Indicator Remains in a Bullish Regime
The Bull–Bear Market Cycle Indicator is a momentum indicator derived from the difference between the Profit & Loss Index and its 365-day moving average.
In simple terms:
- Above 0 → bullish cycle regime
- Below 0 and below its own 365-day MA → bearish cycle regime
The important point is that this indicator measures the distance from its moving average, rather than the absolute level of the index itself. Because of this, changes in momentum can appear before price fully confirms a cycle transition.
The current reading remains above 0, indicating that Bitcoin is still in a bullish cycle regime.
Historically, once the indicator entered a positive regime, Bitcoin often maintained a directional trend for an extended period rather than immediately reversing. From a spot-holder perspective, this suggests that there may still be room to maintain exposure while the indicator remains above 0.
However, the level should not be interpreted in a binary way.
Even while the indicator remains positive, a gradual decline toward 0 can be important. In previous cycles, shrinking positive momentum sometimes appeared during the later stages of an uptrend before price clearly confirmed the transition.
So the key is not only whether the indicator is positive today, but also whether its positive momentum is expanding or beginning to contract.
For now, the broader cycle signal remains bullish.
A sustained move back below 0 would be a much more meaningful warning that the current bullish regime is weakening.
Written by Trdaer_Gemini
In simple terms:
- Above 0 → bullish cycle regime
- Below 0 and below its own 365-day MA → bearish cycle regime
The important point is that this indicator measures the distance from its moving average, rather than the absolute level of the index itself. Because of this, changes in momentum can appear before price fully confirms a cycle transition.
The current reading remains above 0, indicating that Bitcoin is still in a bullish cycle regime.
Historically, once the indicator entered a positive regime, Bitcoin often maintained a directional trend for an extended period rather than immediately reversing. From a spot-holder perspective, this suggests that there may still be room to maintain exposure while the indicator remains above 0.
However, the level should not be interpreted in a binary way.
Even while the indicator remains positive, a gradual decline toward 0 can be important. In previous cycles, shrinking positive momentum sometimes appeared during the later stages of an uptrend before price clearly confirmed the transition.
So the key is not only whether the indicator is positive today, but also whether its positive momentum is expanding or beginning to contract.
For now, the broader cycle signal remains bullish.
A sustained move back below 0 would be a much more meaningful warning that the current bullish regime is weakening.
Written by Trdaer_Gemini
1
124
Məqalə
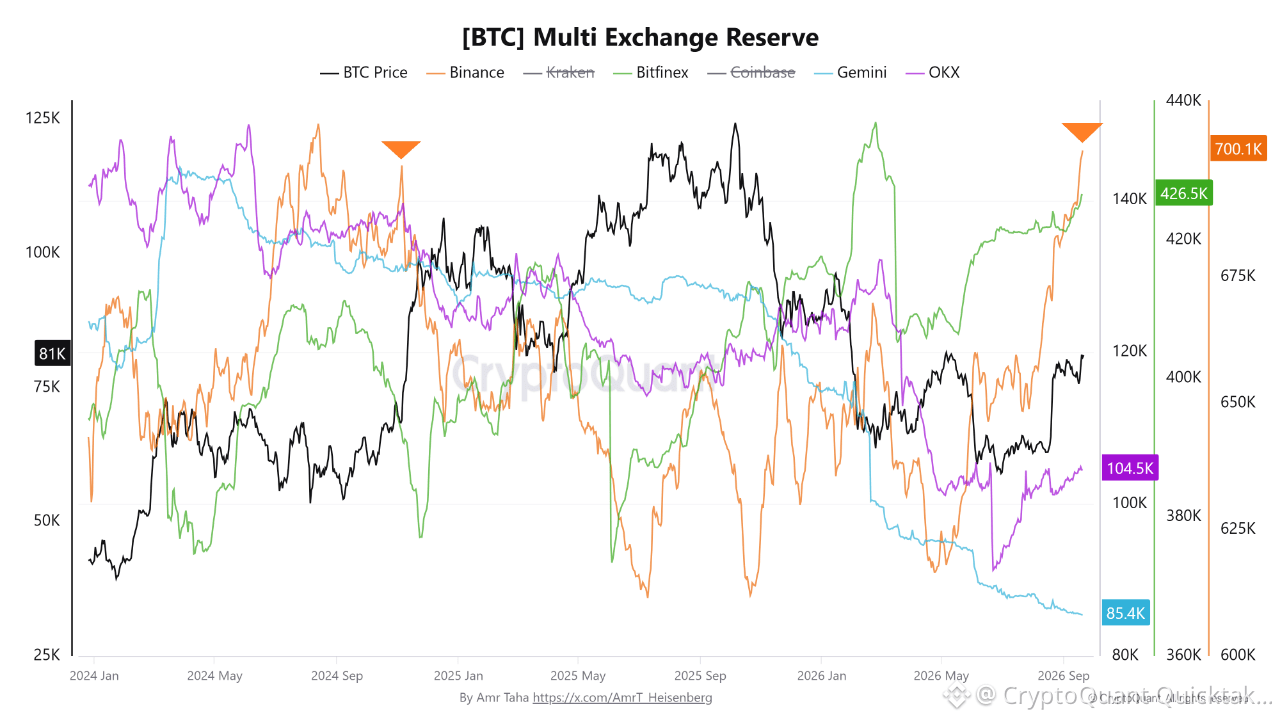
Binance 700K BTC-ni keçərkən və Gemini 2023-cü ilin dekabrından bəri ən aşağı səviyyəyə düşərkən Bitcoin Birja Ehtiyatları Fərqlənir ...İri birjalarda Bitcoin ehtiyatları kəskin şəkildə fərqlənir: Binance 700.000 BTC səddini keçərkən, Gemini isə 2023-cü ilin dekabrından bəri ən aşağı səviyyəyə düşüb.
2024-cü il noyabrın 5-dəki təxminən 697.000 BTC-lik əvvəlki lokal pikindən bir qədər yuxarı olaraq, sentyabrın 20-dək Binance təxminən 700.100 BTC saxlayırdı.
Bitfinex də təxminən 426.500 BTC-yə qədər yüksələrək, 2026-cı ilin fevralından bəri ən yüksək səviyyəsinə çatdı; OKX isə təxminən 104.000 BTC-yə çatdı və bu, iyunun 23-dəki təxminən 91.000 BTC səviyyəsindən, təxminən, 14% yuxarı idi.
Gemini əks istiqamətdə hərəkət edərək, təxminən 85.400 BTC-yə düşdü; bu, 2023-cü ilin dekabrından bəri ən aşağı ehtiyat balansıdır.
Binance 700K BTC-ni keçərkən və Gemini 2023-cü ilin dekabrından bəri ən aşağı səviyyəyə düşərkən Bitcoin Birja Ehtiyatları Fərqlənir ...
İri birjalarda Bitcoin ehtiyatları kəskin şəkildə fərqlənir: Binance 700.000 BTC səddini keçərkən, Gemini isə 2023-cü ilin dekabrından bəri ən aşağı səviyyəyə düşüb.
2024-cü il noyabrın 5-dəki təxminən 697.000 BTC-lik əvvəlki lokal pikindən bir qədər yuxarı olaraq, sentyabrın 20-dək Binance təxminən 700.100 BTC saxlayırdı.
Bitfinex də təxminən 426.500 BTC-yə qədər yüksələrək, 2026-cı ilin fevralından bəri ən yüksək səviyyəsinə çatdı; OKX isə təxminən 104.000 BTC-yə çatdı və bu, iyunun 23-dəki təxminən 91.000 BTC səviyyəsindən, təxminən, 14% yuxarı idi.
Gemini əks istiqamətdə hərəkət edərək, təxminən 85.400 BTC-yə düşdü; bu, 2023-cü ilin dekabrından bəri ən aşağı ehtiyat balansıdır.
2024-cü il noyabrın 5-dəki təxminən 697.000 BTC-lik əvvəlki lokal pikindən bir qədər yuxarı olaraq, sentyabrın 20-dək Binance təxminən 700.100 BTC saxlayırdı.
Bitfinex də təxminən 426.500 BTC-yə qədər yüksələrək, 2026-cı ilin fevralından bəri ən yüksək səviyyəsinə çatdı; OKX isə təxminən 104.000 BTC-yə çatdı və bu, iyunun 23-dəki təxminən 91.000 BTC səviyyəsindən, təxminən, 14% yuxarı idi.
Gemini əks istiqamətdə hərəkət edərək, təxminən 85.400 BTC-yə düşdü; bu, 2023-cü ilin dekabrından bəri ən aşağı ehtiyat balansıdır.
1
230
ABŞ-da Kripto Tənzimlənməsi Konqresdən Qurumlara Keçir: CLARITY’nin Nəticəsinin Bitkoin üçün Nə Anlama GəldiyiABŞ Senatı 15 sentyabrda CLARITY Aktının irəliləməsinə nail ola bilmədi. Prosedur səsverməsi tələb olunan 60 səsdən az oldu; bu, layihənin yekun rədd edilməsi deyildi. Düzəlişlər və daha bir səsvermə hələ də mümkündür, amma bu il qəbul olunması getdikcə çətinləşir.
Siyasi maraqların toqquşması, stablecoin mükafatları və investorların müdafiəsi ilə bağlı mübahisələr SEC və CFTC nəzarətinin dəqiqləşdirilməsi istiqamətində səyləri dayandırıb. İndi diqqət mövcud səlahiyyətlər çərçivəsində qurumların qayda qəbul etməsinə yönəlib, baxmayaraq ki, belə qaydalar məhkəmə etirazlarına və siyasət dəyişikliklərinə qarşı həssas olaraq qalır.
ABŞ-da Kripto Tənzimlənməsi Konqresdən Qurumlara Keçir: CLARITY’nin Nəticəsinin Bitkoin üçün Nə Anlama Gəldiyi
ABŞ Senatı 15 sentyabrda CLARITY Aktının irəliləməsinə nail ola bilmədi. Prosedur səsverməsi tələb olunan 60 səsdən az oldu; bu, layihənin yekun rədd edilməsi deyildi. Düzəlişlər və daha bir səsvermə hələ də mümkündür, amma bu il qəbul olunması getdikcə çətinləşir.
Siyasi maraqların toqquşması, stablecoin mükafatları və investorların müdafiəsi ilə bağlı mübahisələr SEC və CFTC nəzarətinin dəqiqləşdirilməsi istiqamətində səyləri dayandırıb. İndi diqqət mövcud səlahiyyətlər çərçivəsində qurumların qayda qəbul etməsinə yönəlib, baxmayaraq ki, belə qaydalar məhkəmə etirazlarına və siyasət dəyişikliklərinə qarşı həssas olaraq qalır.
Siyasi maraqların toqquşması, stablecoin mükafatları və investorların müdafiəsi ilə bağlı mübahisələr SEC və CFTC nəzarətinin dəqiqləşdirilməsi istiqamətində səyləri dayandırıb. İndi diqqət mövcud səlahiyyətlər çərçivəsində qurumların qayda qəbul etməsinə yönəlib, baxmayaraq ki, belə qaydalar məhkəmə etirazlarına və siyasət dəyişikliklərinə qarşı həssas olaraq qalır.
1
190
Məqalə
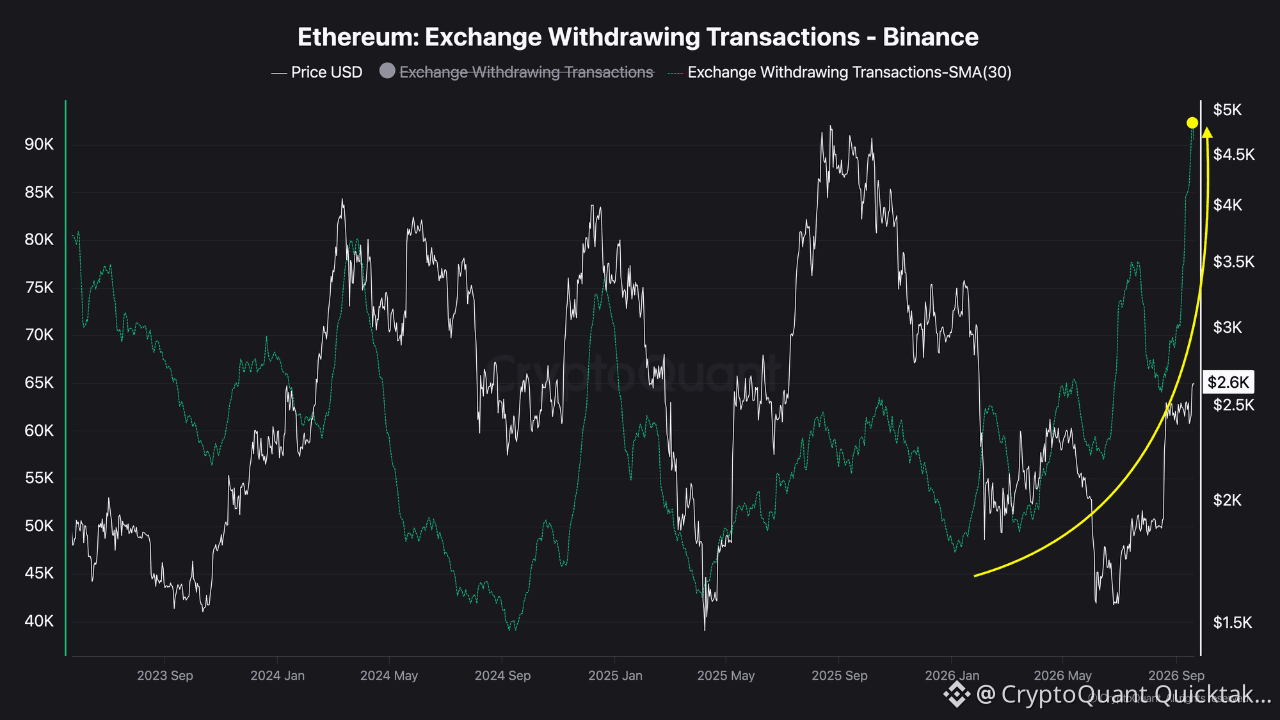
Ethereumun Səssiz Yığımı 3 İllik Rekorda ÇatdıCəmi 3 ayda ETH 1 510 ABŞ dollarından 2 650 ABŞ dollarına yüksəlib, bu isə 75%-dən çox artımdır.
Bu addım aprelin rekordunu üstələməklə mövcud tendensiyanı struktur olaraq pozur.
Buna baxmayaraq ki, hələlik May ayının rekord səviyyəsindən davamlı şəkildə yuxarıda özünü bərqərar etməyən Bitcoin ilə müqayisədə, ETH bir az önə keçib.
Bu, Binance-də ETH-in yığılması sayəsində mümkün olub və ETH-in səviyyəsi 3 ilin ən yüksək həddinə çatıb. Binance-dən ETH çıxarılma əməliyyatlarının aylıq orta göstəricisi indi 90 000-i keçib; bu, 2023-cü ildən bəri görünməyən bir göstəricidir və ilin əvvəlində qeydə alınan səviyyənin iki qatıdır.
Ethereumun Səssiz Yığımı 3 İllik Rekorda Çatdı
Cəmi 3 ayda ETH 1 510 ABŞ dollarından 2 650 ABŞ dollarına yüksəlib, bu isə 75%-dən çox artımdır.
Bu addım aprelin rekordunu üstələməklə mövcud tendensiyanı struktur olaraq pozur.
Buna baxmayaraq ki, hələlik May ayının rekord səviyyəsindən davamlı şəkildə yuxarıda özünü bərqərar etməyən Bitcoin ilə müqayisədə, ETH bir az önə keçib.
Bu, Binance-də ETH-in yığılması sayəsində mümkün olub və ETH-in səviyyəsi 3 ilin ən yüksək həddinə çatıb. Binance-dən ETH çıxarılma əməliyyatlarının aylıq orta göstəricisi indi 90 000-i keçib; bu, 2023-cü ildən bəri görünməyən bir göstəricidir və ilin əvvəlində qeydə alınan səviyyənin iki qatıdır.
Bu addım aprelin rekordunu üstələməklə mövcud tendensiyanı struktur olaraq pozur.
Buna baxmayaraq ki, hələlik May ayının rekord səviyyəsindən davamlı şəkildə yuxarıda özünü bərqərar etməyən Bitcoin ilə müqayisədə, ETH bir az önə keçib.
Bu, Binance-də ETH-in yığılması sayəsində mümkün olub və ETH-in səviyyəsi 3 ilin ən yüksək həddinə çatıb. Binance-dən ETH çıxarılma əməliyyatlarının aylıq orta göstəricisi indi 90 000-i keçib; bu, 2023-cü ildən bəri görünməyən bir göstəricidir və ilin əvvəlində qeydə alınan səviyyənin iki qatıdır.
192
Məqalə
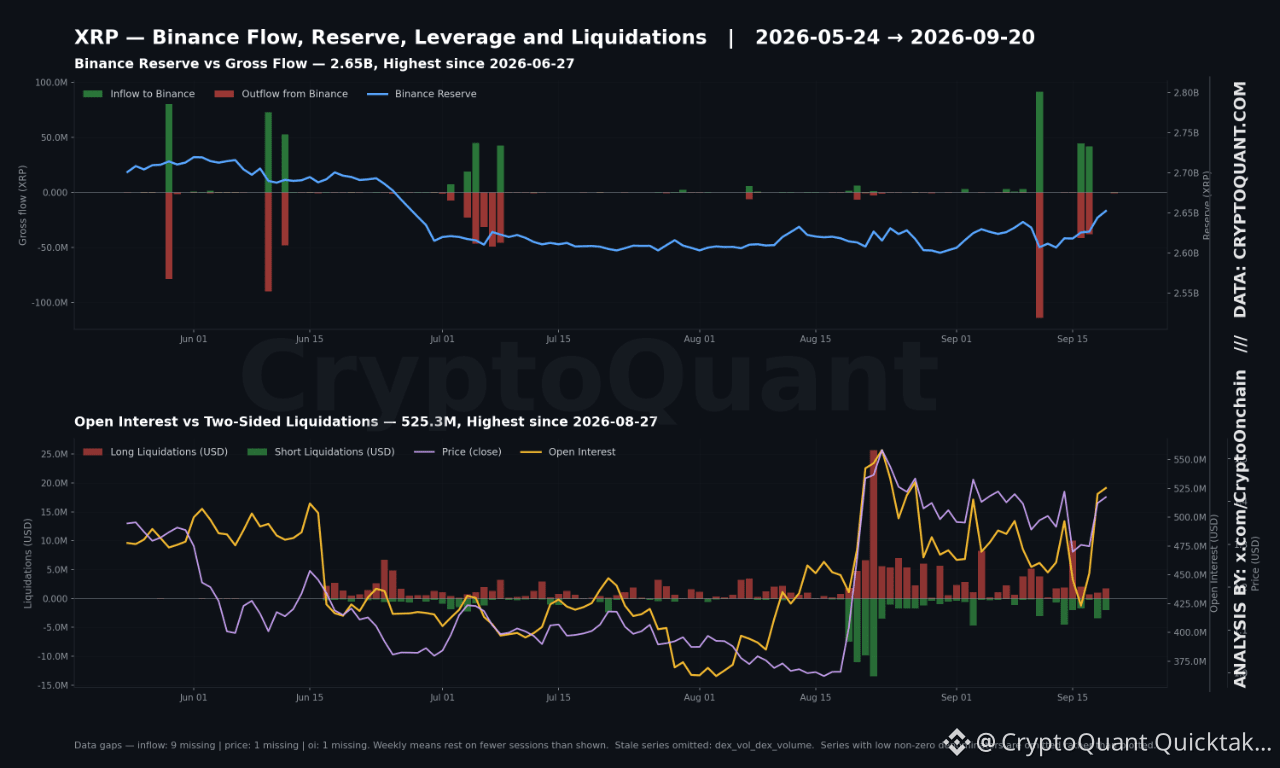
Binance XRP Inflow Orta Gündə 21,7M, Rüblük Bazadan 663% YuxarıBinance XRP-inflow orta hesabla 20 sentyabrda bitən həftədə gündə 21,718,631 təşkil edib. Eyni pəncərədə Binance outflow orta hesabla gündə 11,565,238 olub. Binance-də depozit-ünvan sayı orta hesabla gündə 788 olub və rüblük baza göstəricisindən 129% yuxarıdır.
İnflow seriyası 12, 15, 18 və 19 sentyabr tarixlərində heç bir göstərici vermir və 20 sentyabrda qiymət, açıq maraq, funding və ya transaksya göstəricisi yoxdur. Buna görə də həftəlik inflow orta qiyməti material ölçüdə olan üç sessiyaya əsaslanır — 11 sentyabr (91.2M), 16 (44.5M) və 17 (41.7M). 663% rüblük artım həmin sessiyalarda cəmlənib, həftə boyu paylanmayıb.
Binance XRP Inflow Orta Gündə 21,7M, Rüblük Bazadan 663% Yuxarı
Binance XRP-inflow orta hesabla 20 sentyabrda bitən həftədə gündə 21,718,631 təşkil edib. Eyni pəncərədə Binance outflow orta hesabla gündə 11,565,238 olub. Binance-də depozit-ünvan sayı orta hesabla gündə 788 olub və rüblük baza göstəricisindən 129% yuxarıdır.
İnflow seriyası 12, 15, 18 və 19 sentyabr tarixlərində heç bir göstərici vermir və 20 sentyabrda qiymət, açıq maraq, funding və ya transaksya göstəricisi yoxdur. Buna görə də həftəlik inflow orta qiyməti material ölçüdə olan üç sessiyaya əsaslanır — 11 sentyabr (91.2M), 16 (44.5M) və 17 (41.7M). 663% rüblük artım həmin sessiyalarda cəmlənib, həftə boyu paylanmayıb.
İnflow seriyası 12, 15, 18 və 19 sentyabr tarixlərində heç bir göstərici vermir və 20 sentyabrda qiymət, açıq maraq, funding və ya transaksya göstəricisi yoxdur. Buna görə də həftəlik inflow orta qiyməti material ölçüdə olan üç sessiyaya əsaslanır — 11 sentyabr (91.2M), 16 (44.5M) və 17 (41.7M). 663% rüblük artım həmin sessiyalarda cəmlənib, həftə boyu paylanmayıb.
1
119
Daha çox kontent araşdırmaq üçün daxil olun
Binance Square-də qlobal kriptovalyuta istifadəçilərinə qoşulun
⚡️ Kriptovalyuta haqqında ən son və faydalı məlumatları əldə edin.
💬 Dünyanın ən böyük kriptovalyuta birjası tərəfindən etibar edilir.
👍 Doğrulanmış yaradıcılardan gələn real məlumatları kəşf edin.
E-poçt/Telefon nömrəsi
Trenddə olan mövzular
NEARRisesNearly80%InAWeek
40,669 baxış
Müzakirə edir: 911
#nearrisesnearly80%inaweek $NEAR 7 gün ərzində +80% etdi və niyə heç kim danışmır 🚀
$2.20 → $4.29, halbuki bütün bazar yalnız 6% yüksəlib.
Əsl hərəkətverici səbəblər:
→ near $30B Intents Həcmi
→ Hyperliquid ilə Confidential Perps-in işə salınması
→ TVL yenidən $190M-a + 52K aktiv cüzdan
Mən bunu $2.30 olarkən izlədim və heç nə etmədim. Dərs alındı.
Siz sahibsiniz, yoxsa hələ də kənardan izləyirsiniz? 👀
$NEAR #NEARProtocol #CryptoNews
True News
·2 bəyənmə
·779 baxış
MultiversXPlansHardForkRecovery
34,409 baxış
Müzakirə edir: 694
CircleLaunchesInstitutionalBTCBackedBorrowing
32,835 baxış
Müzakirə edir: 780