

CryptoKing_Alpha
19 Paylaşımlar

CryptoKing_Alpha
Şikayət et
İstifadəçini blokla
CryptoKing_Alpha | BTC ETH Altcoins | Crypto Market Analysis | Trading Trends | Learn Analyze Trade Smart | DYOR
2 İzlənilir
48 İzləyicilər
54 Bəyəndi
Postlar
Tərcüməyə bax
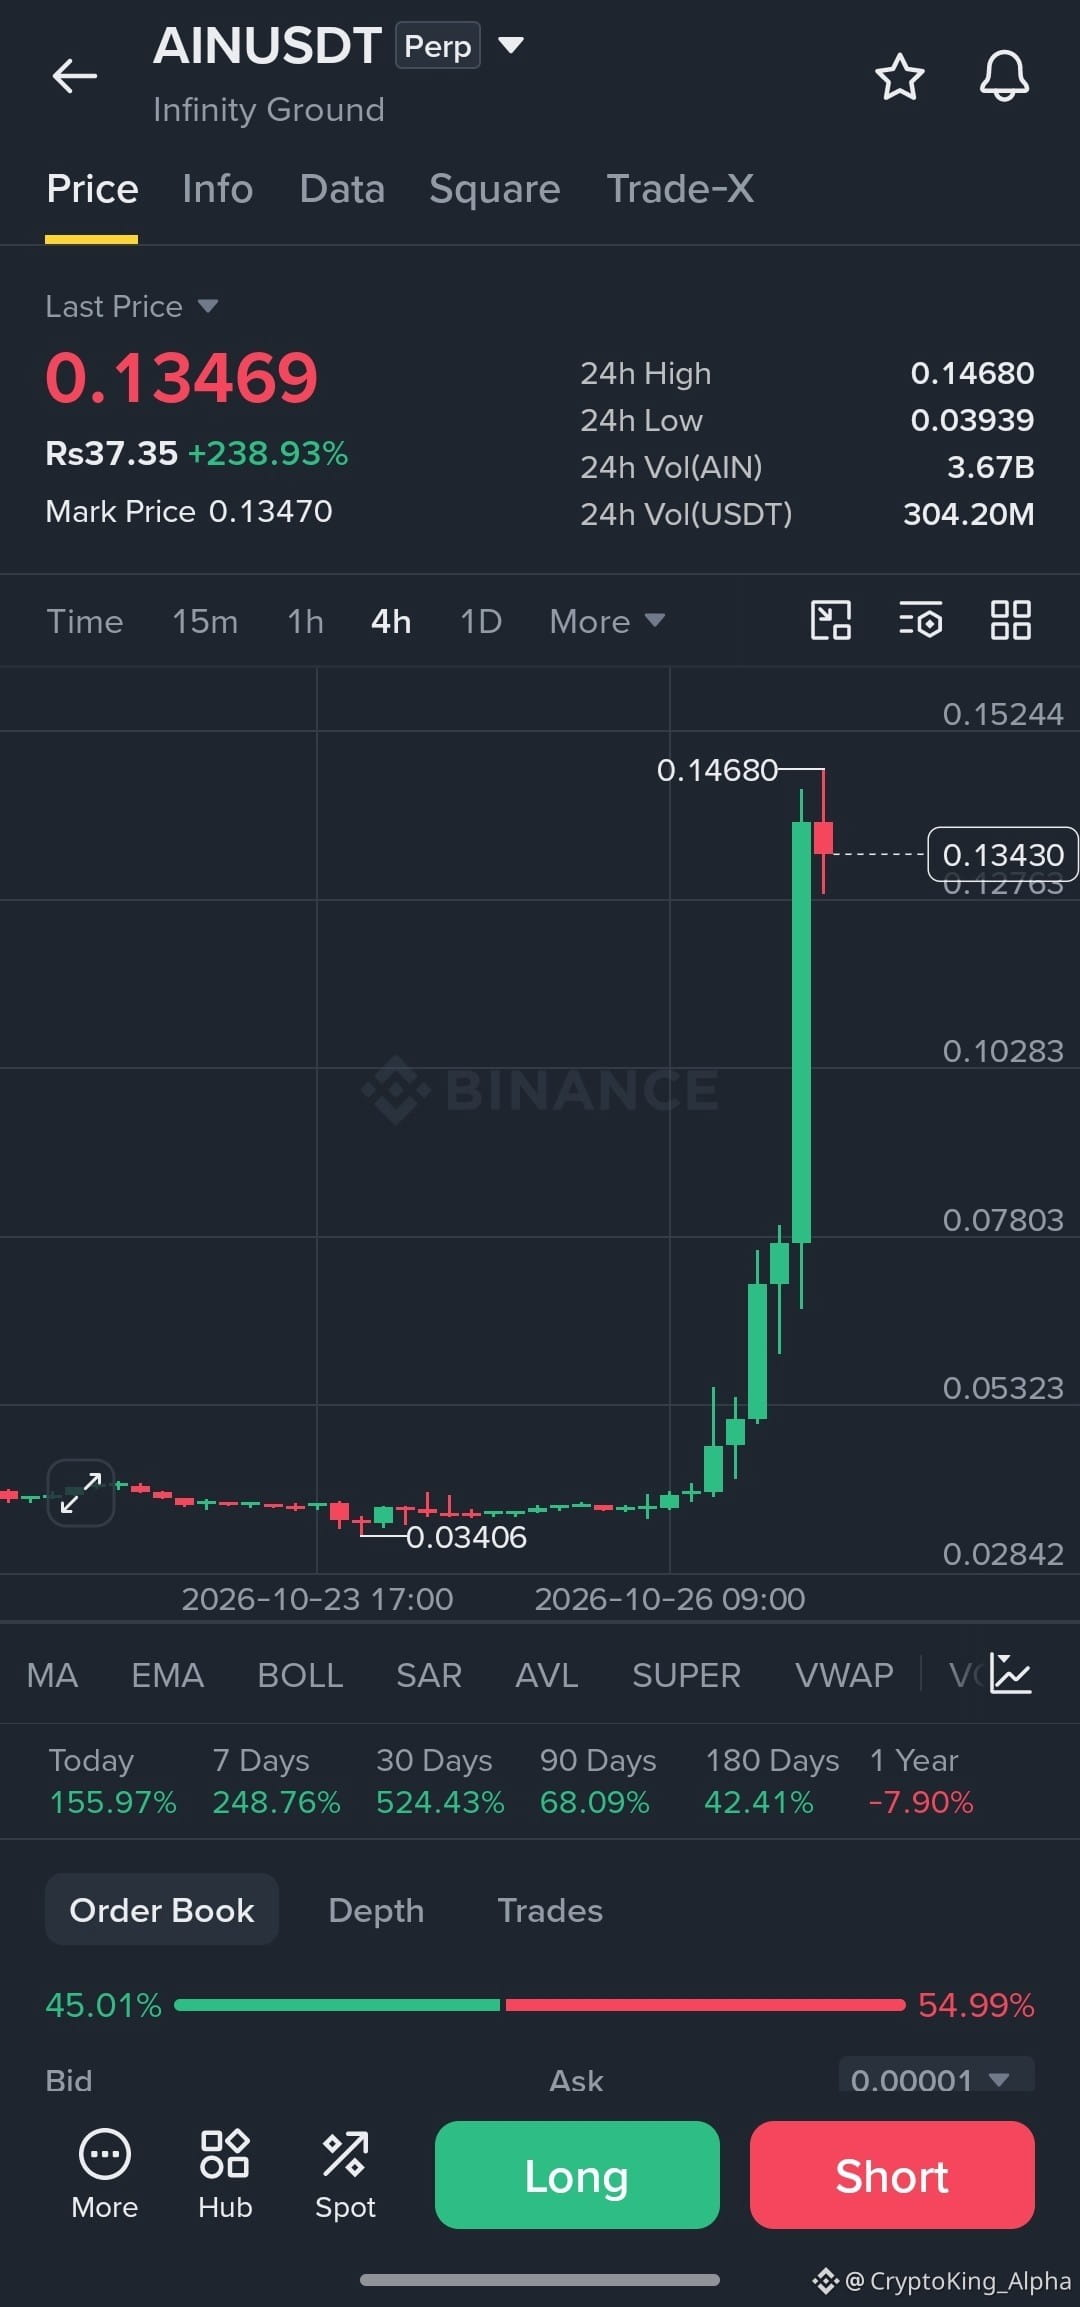
$AIN
Key levels to watch
🔴 Resistance: $0.0559
🟢 Support: $0.0365
📈 Bullish setup: resistance ke upar confirmed breakout aur strong volume.
📉 Bearish setup: support ke neeche breakdown aur increased selling
#volume.AIN/USDT — Technical Analysis
27 October 2026 · Available market data
Current price: approximately $0.0523
24-hour change: +37.24%
24-hour high: $0.0559
24-hour low: $0.0365
24-hour volume: approximately $55.71 million
#AIN #AINUSDT #CryptoAnalysis #PriceAction #dyor $AIN
87
$BTW
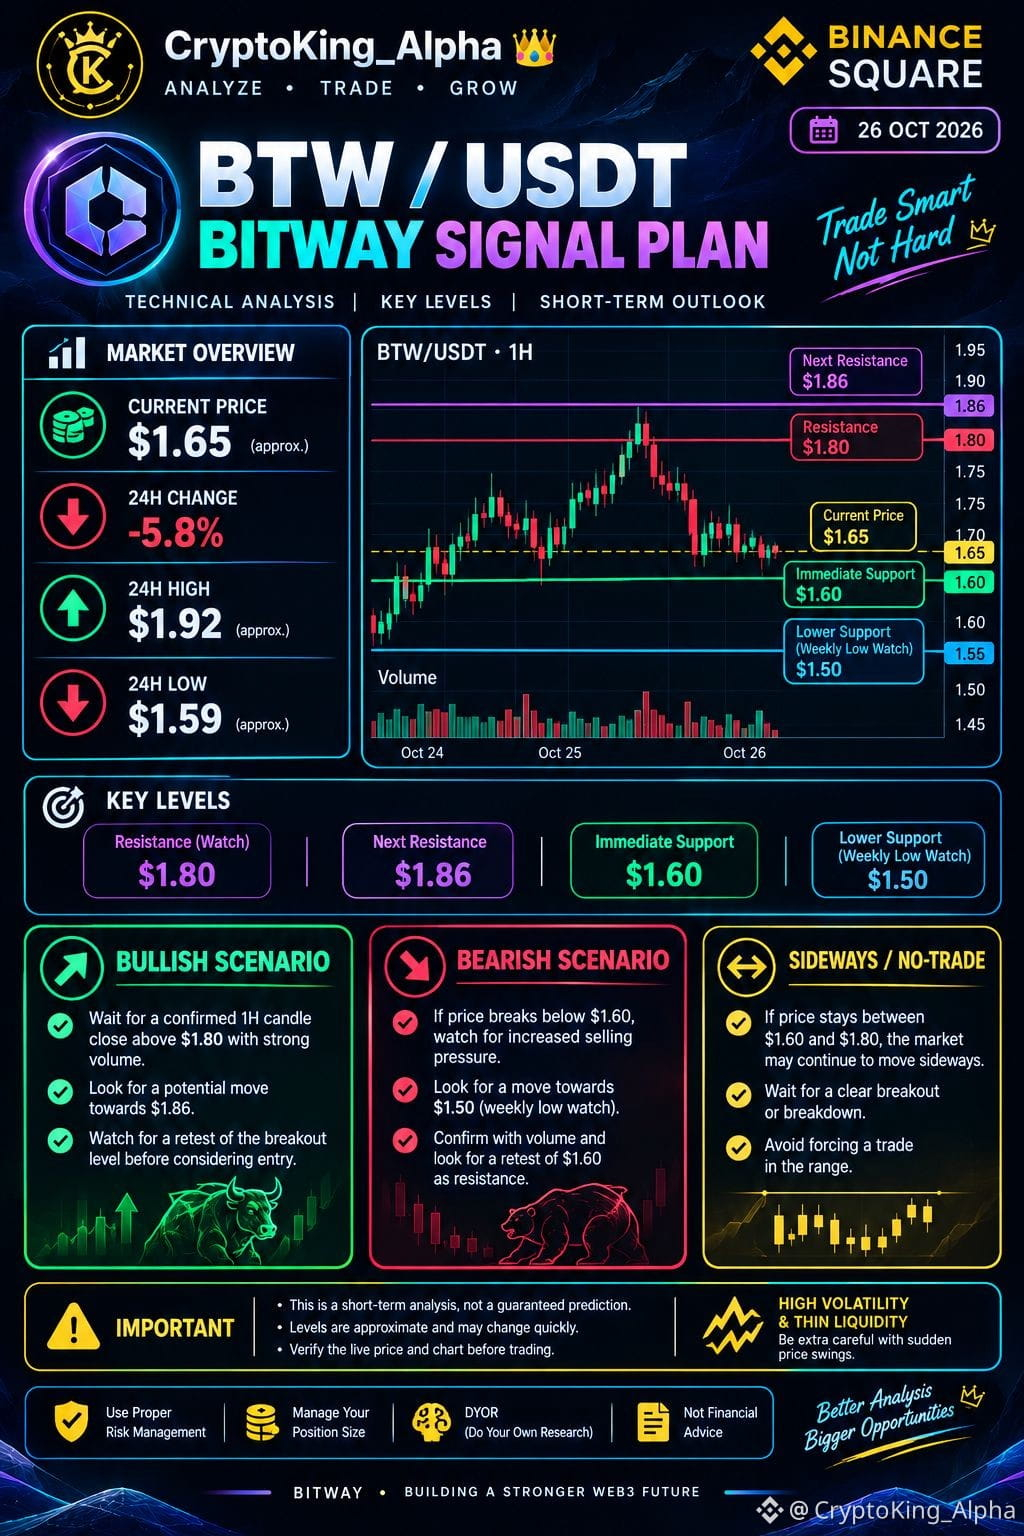
📊 BTW/USDT — BITWAY SİQNAL PLANI
BTW son volatillikli bazar hərəkətindən sonra qısamüddətli satış təzyiqi ilə üzləşir.
🔴 Müqavimət Nəzarəti: $1.80
🚀 Növbəti Müqavimət: $1.86
🟢 Dərhal Dəstək: $1.60
📉 Aşağı Dəstək Nəzarəti: $1.50
📈 Bullish Ssenari: Güclü həcmdə $1.80-dən yuxarı təsdiqlənmiş 1H şam bağlanışı $1.86-nı diqqət mərkəzinə gətirə bilər.
📉 Bearish Ssenari: Güclü satış təzyiqi ilə $1.60-dan aşağı qırılma aşağı istiqamətli riski $1.50 sahəsinə doğru artıra bilər.
⏳ Ticarətsiz Zona: $1.60 və $1.80 arasında, aydın bir breakout və ya breakdown üçün gözləyin.
⚠️ BTW volatillikli ola bilər və likvidlik qiymət dalğalanmalarını gücləndirə bilər. Bunlar istinad səviyyələridir, zəmanətli proqnozlar deyil. Canlı qrafiki yoxlayın və riski diqqətlə idarə edin.
💬 BTW bərpa olunacaq, yoxsa daha da düşəcək? Təhlilinizi paylaşın!
#BTW #Bitway #BTWUSDT #CryptoAnalysis #BinanceSquare $BTW
384
Tərcüməyə bax
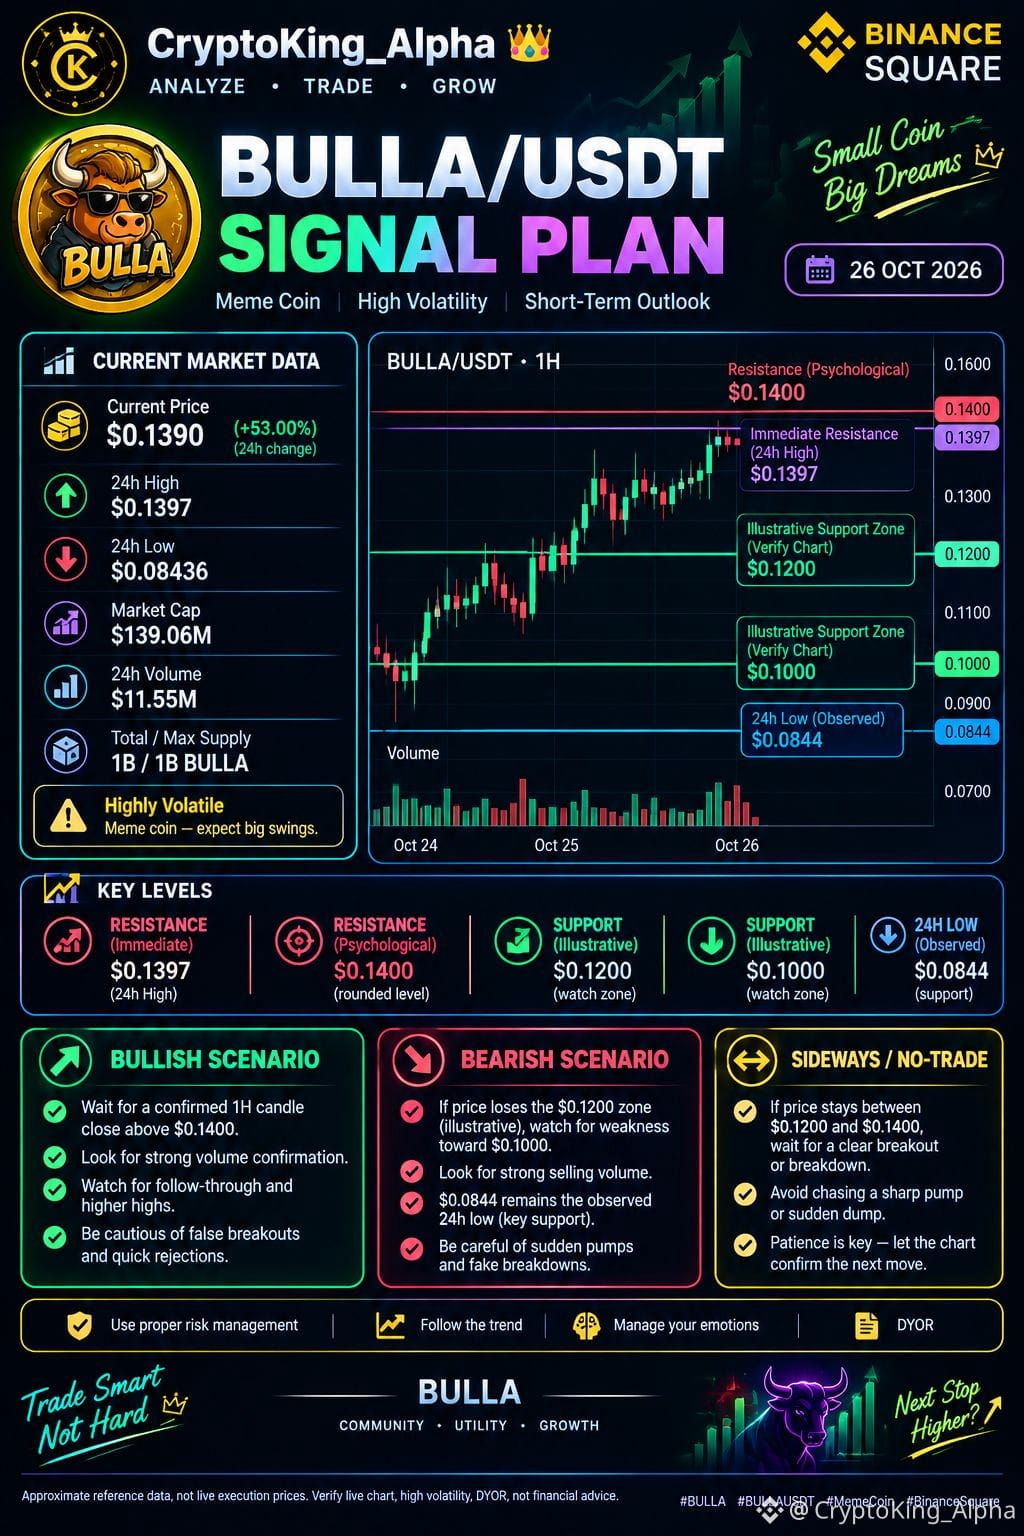
$BULLA /USDT SIGNAL PLAN
🚀 BULLA is showing strong momentum, but after a sharp rally, volatility and sudden pullbacks are possible.
🔴 Immediate Resistance: $0.1397
🎯 Psychological Level: $0.1400
🟢 Support Watch Zone: $0.1200
🟢 Lower Watch Zone: $0.1000
⚠️ Observed 24H Low: $0.0844
📈 Bullish Scenario: Wait for a confirmed 1H candle close above $0.1400 with strong volume before considering further upside.
📉 Bearish Scenario: If price loses the $0.1200 watch zone, downside risk may increase. Watch volume and confirm the breakdown.
⏳ Strategy: Avoid chasing pumps. Wait for confirmation and use proper risk management.
⚠️ Support watch zones are illustrative, not confirmed technical levels. Verify the live chart before trading. This is not financial advice.
💬 Can BULLA break above $0.14? Share your analysis!
#BULLA #BULLAUSDT #MemeCoin #CryptoAnalysis #BinanceSquare $BULLA
1
400
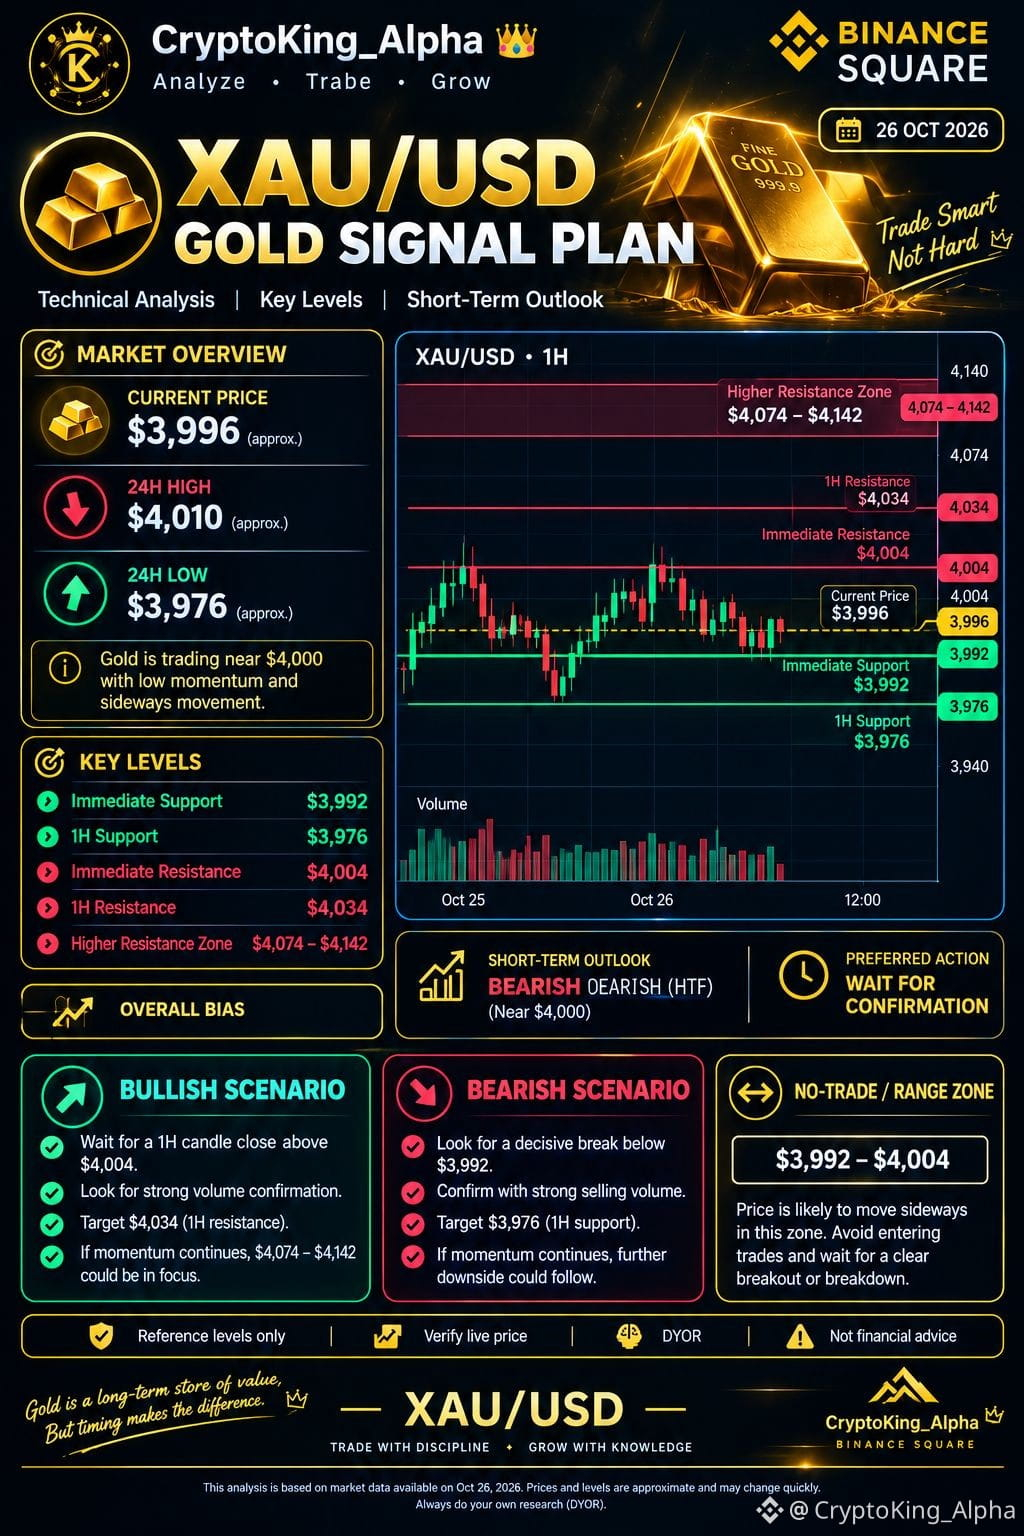
$XAU /USD QIZIL ÜZRƏ SİQNAL PLANI
Qızıl psixoloji $4,000 səviyyəsinə yaxın hərəkət edir. Qısamüddətli qiymət dinamikası konsolidasiyanı və eniş təzyiqini göstərir.
🔴 Yaxın müqavimət: $4,004
🔴 Əsas müqavimət: $4,034
🚀 Daha yüksək müqavimət zonası: $4,074–$4,142
🟢 Yaxın dəstək: $3,992
🟢 Əsas dəstək: $3,976
📈 Öküz ssenarisi: Güclü həcm fonunda 1 saatlıq şamın $4,004-dən yuxarı bağlanması təsdiqlənərsə, qiymətin $4,034-ə doğru hərəkət etməsi üçün yol açıla bilər.
📉 Ayı ssenarisi: Güclü satış həcmi ilə $3,992 səviyyəsi qəti şəkildə qırılarsa, diqqət $3,976 səviyyəsinə yönələ bilər.
⏳ Ticarətsiz zona: $3,992 ilə $4,004 arasında ticarətə tələsməkdənsə, təsdiqlənmiş yuxarı və ya aşağı qırılmanı gözləyin.
⚠️ Bu səviyyələr təxminidir və sürətlə dəyişə bilər. Ticarət etməzdən əvvəl brokerinizdə XAU/USD-nin cari qiymətini yoxlayın. Həmişə risklərin idarə olunması qaydalarına əməl edin — bu, maliyyə məsləhəti deyil.
💬 Qızılın növbəti hədəfi: $4,034, yoxsa $3,976? Fikrinizi aşağıda paylaşın!
#XAUUSD #Gold #GoldAnalysis #ForexTrading #BinanceSquare $XAU
102
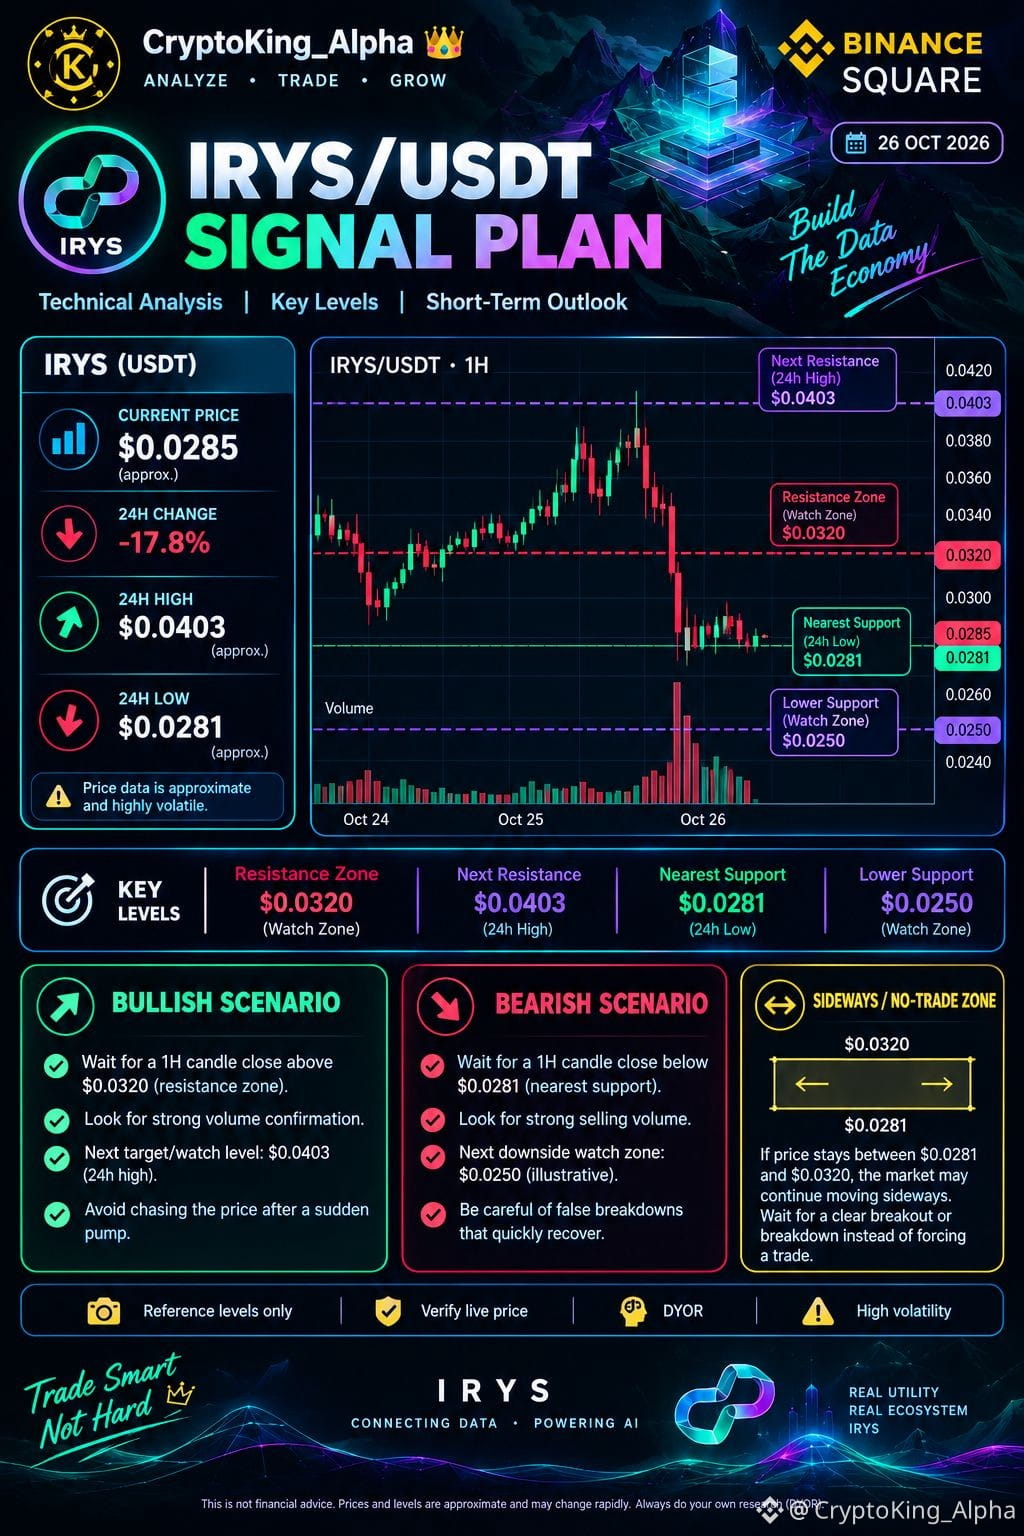
$IRYS /USDT SİQNAL PLANI
⚠️ Kəskin qiymət dönüşündən sonra IRYS-də həddindən artıq volatillik müşahidə olunur.
🔴 Müqavimət zonası: $0.0320
🚀 24 saatlıq maksimum: $0.0403
🟢 Ən yaxın dəstək: $0.0281
📉 Aşağı izləmə zonası: $0.0250 (nümunəvi səviyyədir; canlı qrafikdə yoxlayın)
📈 Yüksəliş ssenarisi: Güclü həcm fonunda 1 saatlıq şamın $0.0320 səviyyəsindən yuxarı bağlanması $0.0403 zonasını diqqət mərkəzinə gətirə bilər.
📉 Eniş ssenarisi: Güclü satış həcmi fonunda 1 saatlıq şamın $0.0281 səviyyəsindən aşağı bağlanması eniş riskini artıra bilər.
⏳ Strategiya: Kəskin sıçrayışların ardınca tələsməyin. Təsdiqi gözləyin və yanlış qırılmalara diqqət yetirin.
⚠️ Səviyyələr təxminidir və zəmanətli proqnoz deyil. IRYS/USDT canlı qrafikini yoxlayın və riskləri diqqətlə idarə edin.
💬 IRYS barədə fikriniz nədir — bərpa, yoxsa daha dərin korreksiya?
#IRYS #IRYSUSDT #CryptoAnalysis #Altcoins #BinanceSquare $IRYS
314
Tərcüməyə bax
$SOL
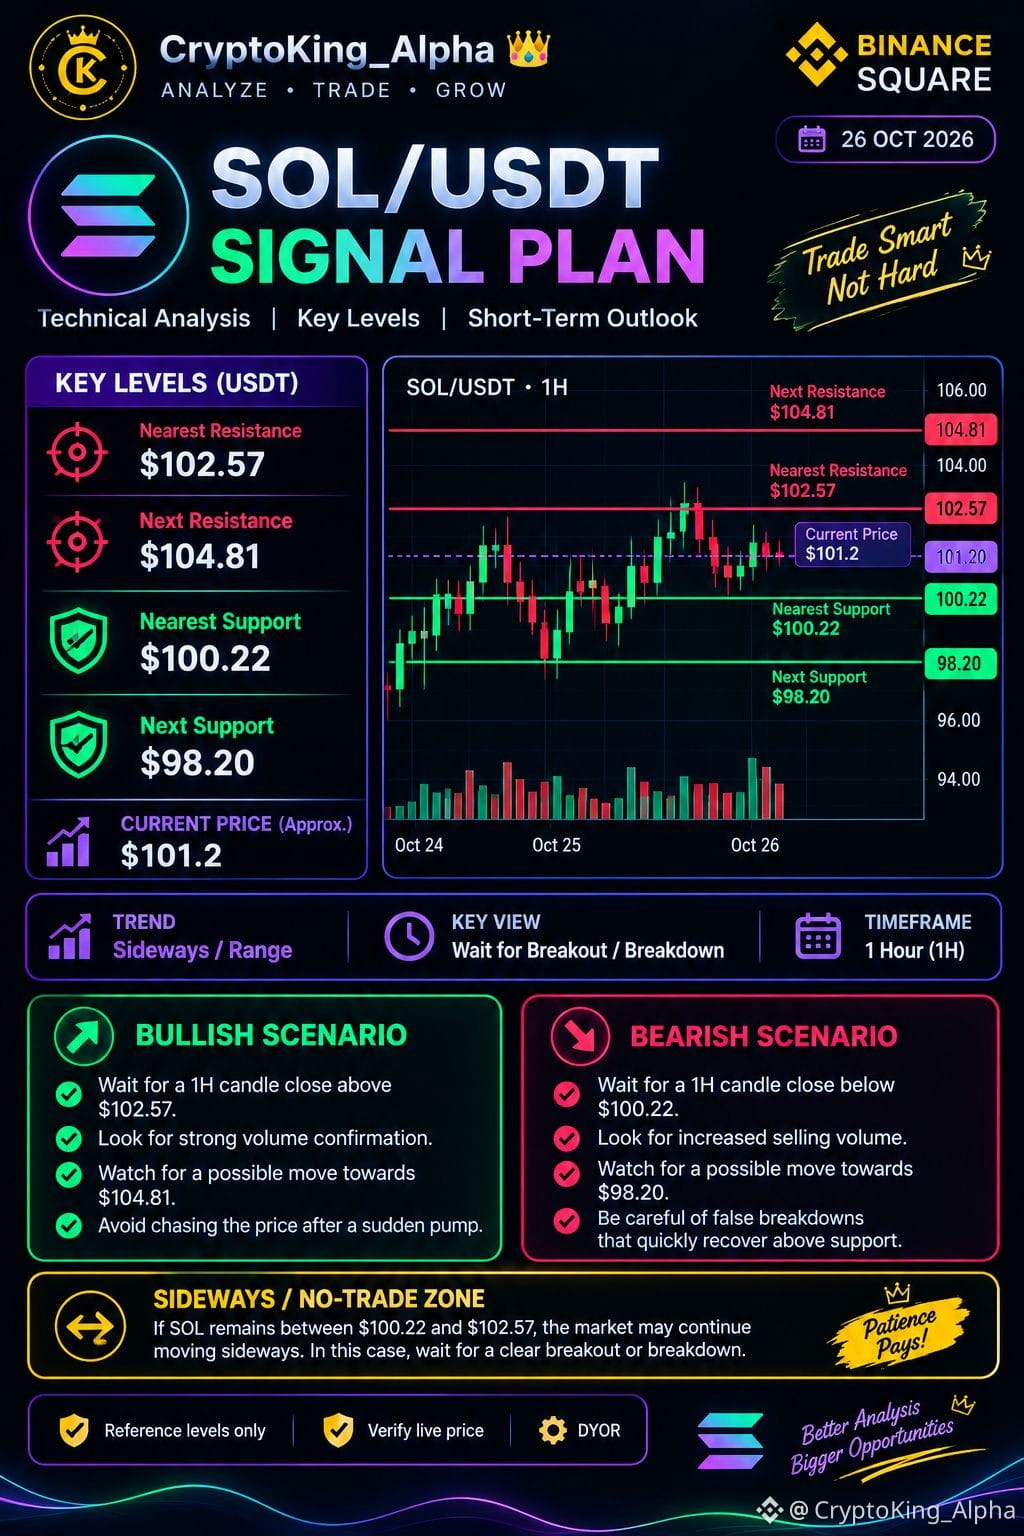
📊 SOL/USDT SIGNAL PLAN |
Solana is trading near $101.20, with price action moving in a short-term range.
🔴 Resistance: $102.57
🚀 Next Resistance: $104.81
🟢 Support: $100.22
📉 Next Support: $98.20
📈 Bullish Scenario: A confirmed 1H candle close above $102.57 with strong volume could open the way toward $104.81.
📉 Bearish Scenario: A confirmed 1H candle close below $100.22 with strong selling volume could put $98.20 in focus.
⏳ No-Trade Zone: Between $100.22 and $102.57, wait for a clear breakout or breakdown instead of rushing into a trade.
⚠️ These are reference levels, not guaranteed predictions. Verify the live SOL/USDT price before trading and always manage your risk.
💬 SOL — Bullish or bearish? Share your view below!
#SOL #Solana #SOLUSDT #CryptoAnalysis #BinanceSquare $SOL
75
Tərcüməyə bax
$ETH
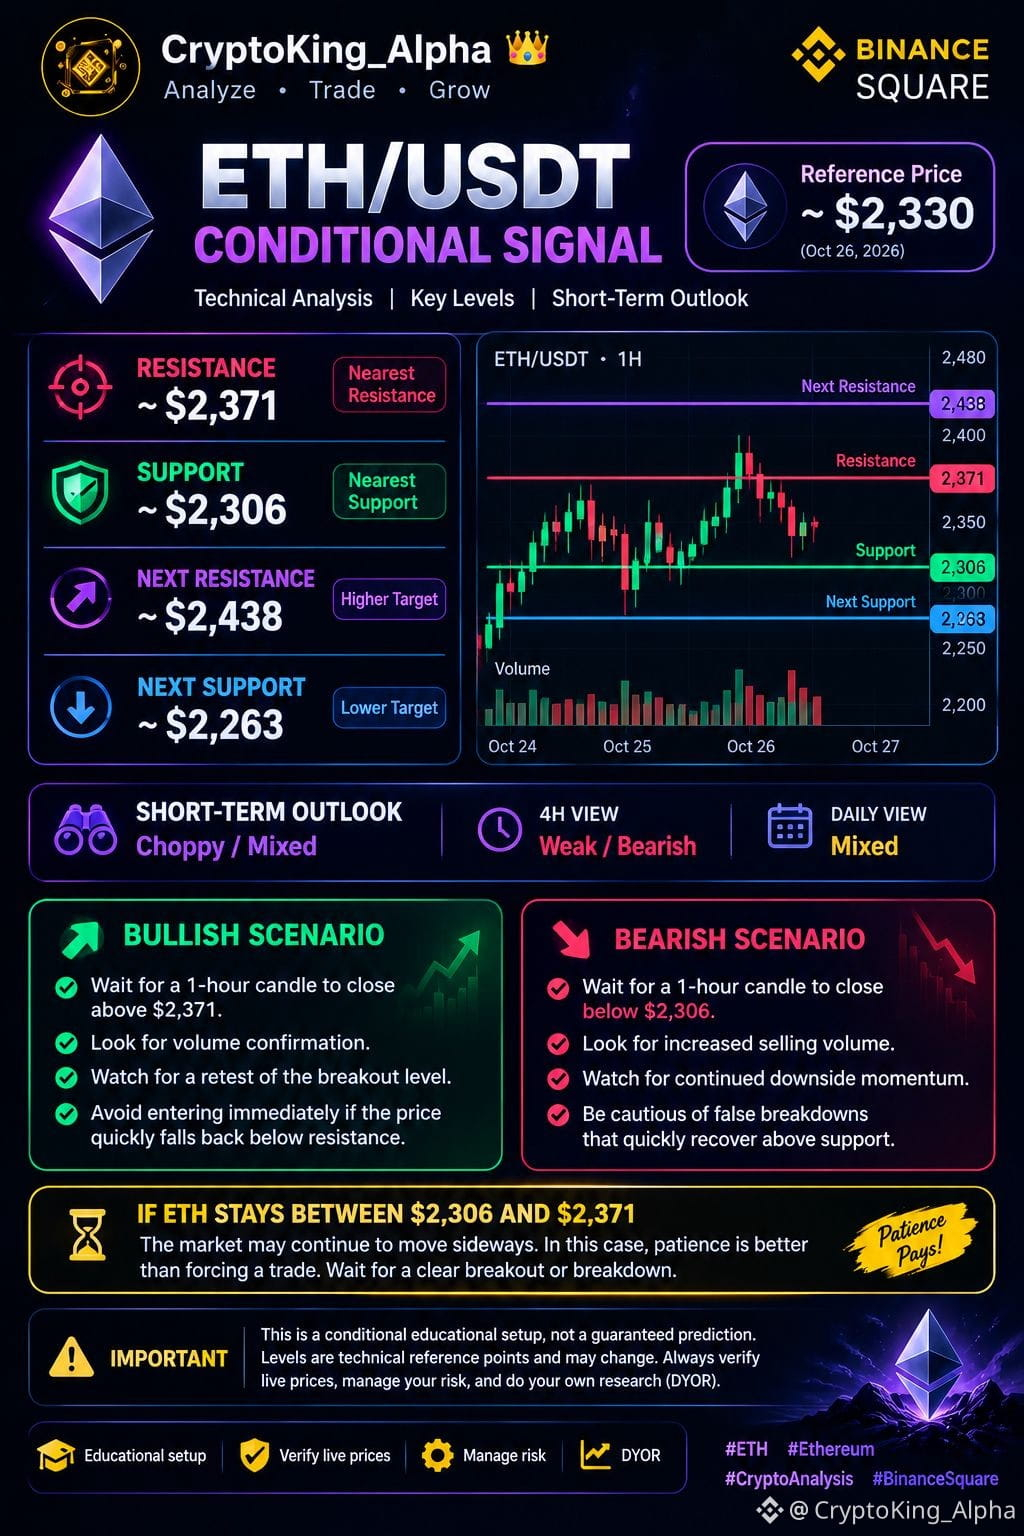
📊 ETH/USDT SIGNAL PLAN |
Ethereum is trading near the $2,330 area, with price action showing mixed short-term momentum. Traders should monitor the key support and resistance levels and wait for confirmation before making a decision.
🔴 Key Resistance: $2,371
The $2,371 level is the nearest resistance to watch. If ETH fails to break above this zone, sellers may push the price lower. However, a strong 1-hour candle close above $2,371, supported by increasing trading volume, could signal a potential bullish breakout. Traders should also watch for a successful retest before considering an entry.
🟢 Key Support: $2,306
The $2,306 level is the nearest support area. If buyers defend this zone, ETH may attempt another move toward resistance. However, if a 1-hour candle closes below $2,306 with strong selling volume, it could indicate further downside pressure.
📈 BULLISH SCENARIO
- Wait for a 1H candle close above $2,371.
- Look for strong volume confirmation.
- Watch for a successful retest of the breakout zone.
- Avoid chasing price after a sudden pump.
📉 BEARISH SCENARIO
- Wait for a 1H candle close below $2,306.
- Look for increased selling pressure.
- Watch for a retest of broken support as resistance.
- Be careful of false breakdowns.
⏳ NO-TRADE ZONE
If ETH remains between $2,306 and $2,371, the market may continue moving sideways. Patience is important—wait for a clearer setup rather than forcing a trade.
⚠️ These are technical reference levels, not guaranteed predictions. Verify the live ETH/USDT price before trading, manage position size carefully, and always do your own research (DYOR).
💬 What’s your view on ETH? Bullish breakout or bearish breakdown? Share your analysis below!
#ETH #Ethereum #ETHUSD #CryptoAnalysis #BinanceSquare
51
Tərcüməyə bax
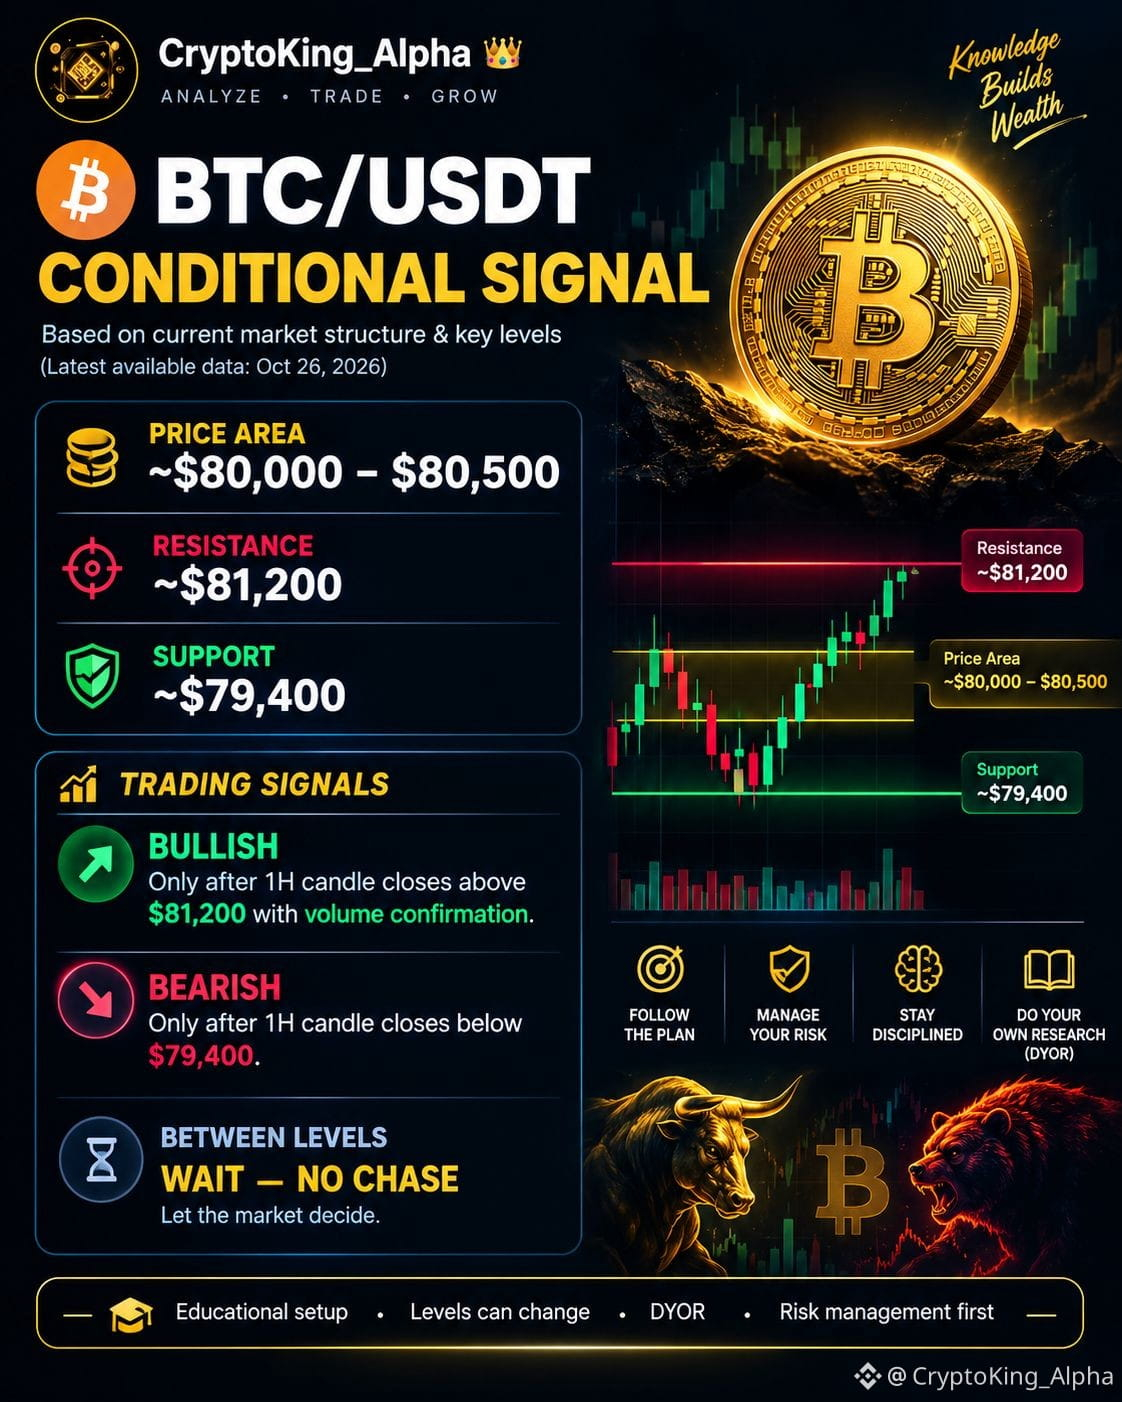
$BTC 📊 BTC/USDT Market Signal Plan | CryptoKing_Alpha 👑
Bitcoin is approaching an important technical zone where the next move could help traders identify a potential short-term direction. Rather than entering a trade based on price movement alone, it's important to wait for confirmation from the 1-hour chart and trading volume.
🔴 Key Resistance: Around $81,200
The $81,200 level is an important resistance area to watch. If Bitcoin approaches this zone but struggles to break above it, sellers may step in and push the price lower. However, if BTC breaks above this level and a 1-hour candle closes firmly above it, supported by strong trading volume, it could indicate increasing buying pressure and a possible bullish continuation. Traders should watch for a successful retest of the breakout level before considering an entry, as false breakouts can occur.
🟢 Key Support: Around $79,400
The $79,400 level is an important support area where buyers may attempt to defend the price. If BTC holds above this zone and buying pressure increases, the market could attempt another move toward resistance. On the other hand, if Bitcoin breaks below $79,400 and a 1-hour candle closes beneath it with strong selling volume, it could signal weakening momentum and the possibility of further downside. A retest of the broken support as resistance may provide additional confirmation.
📈 Bullish Scenario
- Wait for a 1-hour candle to close above $81,200.
- Look for strong volume to confirm the breakout.
- Watch whether BTC successfully retests the breakout area.
- Avoid entering immediately if the price quickly falls back below resistance.
📉 Bearish Scenario
- Wait for a 1-hour candle to close below $79,400.
- Look for increased selling volume and continued downward momentum.
- Watch for a retest of $79,400 from below.
- Be cautious of false breakdowns that quickly recover above support.
⏳ If BTC Remains Between $79,400 and $81,200
#BTC #bitcoin #BinanceSquare #BTCUSDT #CryptoAnalysis $BTC
65
Tərcüməyə bax
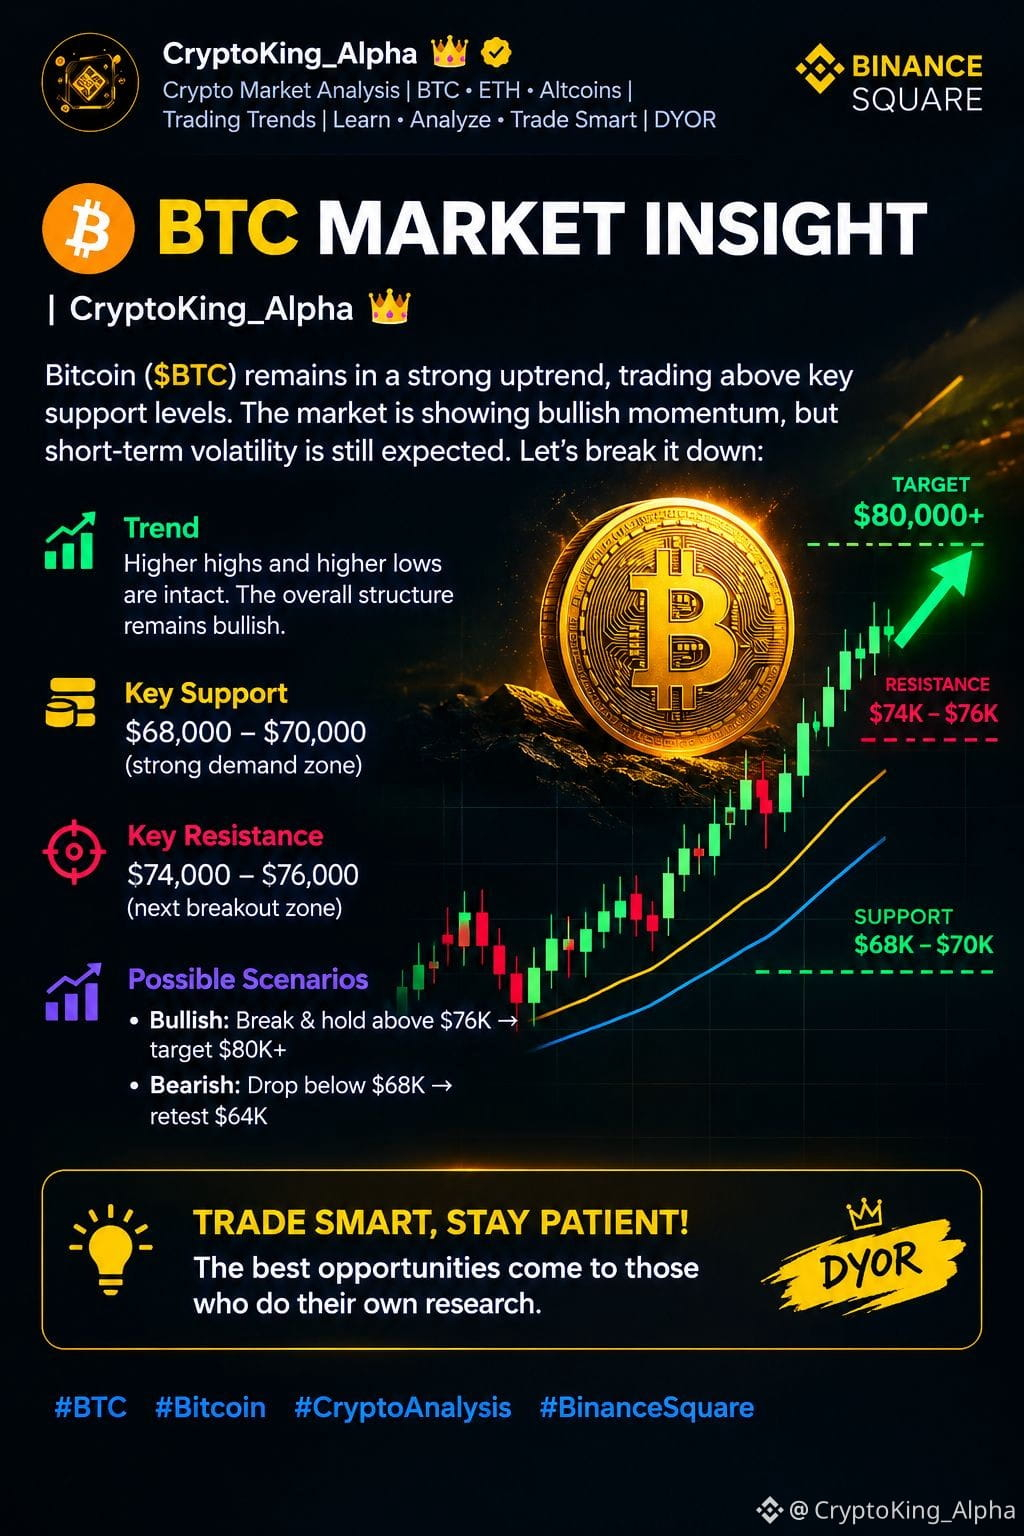
📊 BTC Market Insight | CryptoKing_Alpha 👑
Bitcoin ($BTC ) traders should watch market structure, volume, and key support and resistance levels before making a decision.
📈 Bullish scenario: A confirmed breakout with strong volume may indicate further upside.
📉 Bearish scenario: Losing key support may lead to a deeper pullback.
✅ Avoid emotional trading
✅ Use proper risk management
✅ Wait for confirmation
✅ Always do your own research (DYOR)
💬 What’s your view on BTC right now — bullish or bearish? Share your analysis below!
$BTC #BTC #bitcoin #CryptoAnalysis" #BinanceSquare
72
Tərcüməyə bax
📊 BTC MARKET INSIGHT | CryptoKing_Alpha
Before trading $BTC always check the trend, volume, and important support and resistance levels.
✅ Wait for confirmation
✅ Manage your risk
✅ Avoid emotional trading
Crypto is volatile. Always do your own research.
💬 Are you bullish or bearish on BTC? Share your analysis below
#BTC #bitcoin #CryptoAnalysis
87
Tərcüməyə bax
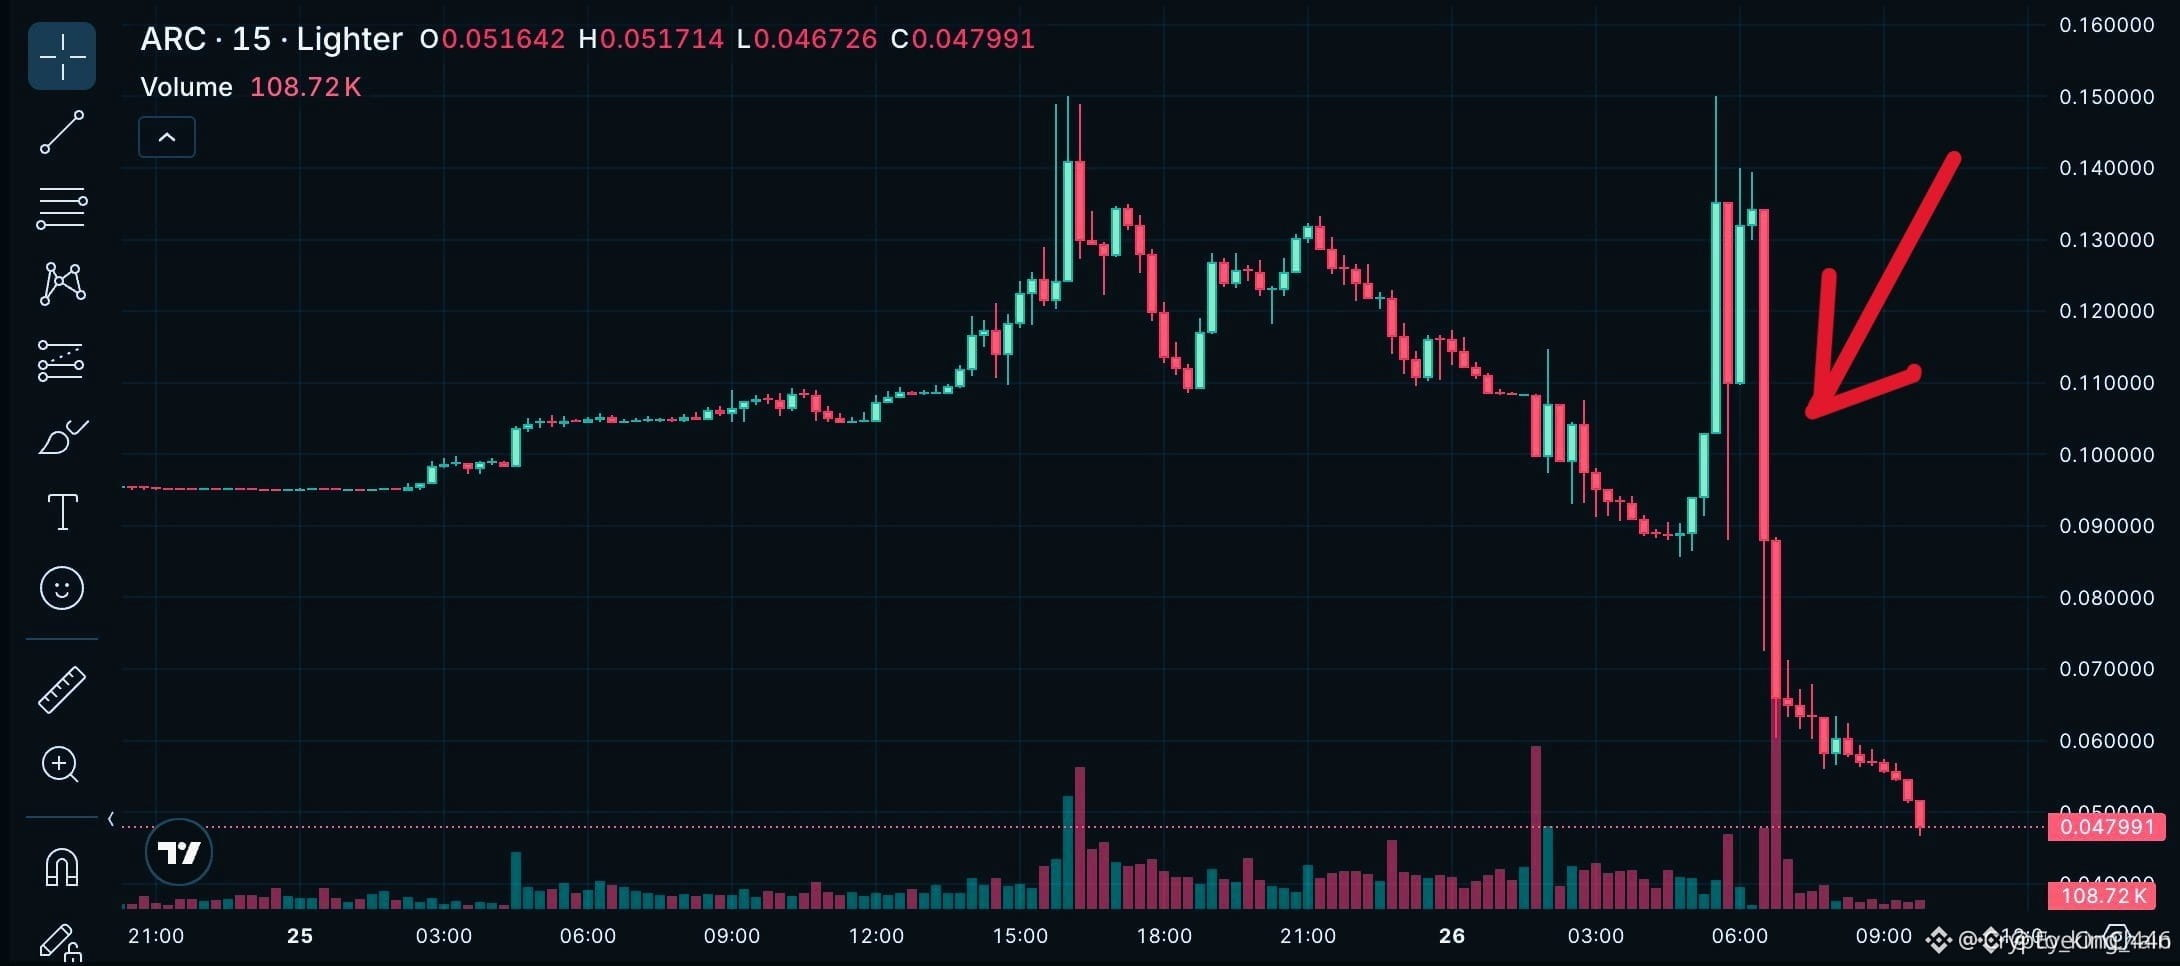
$ARC #BTC Low Liquidity
ACR’s trading volume is extremely small, meaning major price swings can happen with little reason due to thin order books.
❗ Out-of-Market Noise
Online comments and social posts sometimes circulate rumors or unrelated sentiments — social chatter is not a reliable price signal.
📉 Market Correlation
Microcap altcoins like ACR tend to follow broader crypto market direction. If Bitcoin/ETH weakens, these small tokens often underperform further
#MarketRebound #BitcoinGoogleSearchesSurge
72
·
--
Artım
Tərcüməyə bax
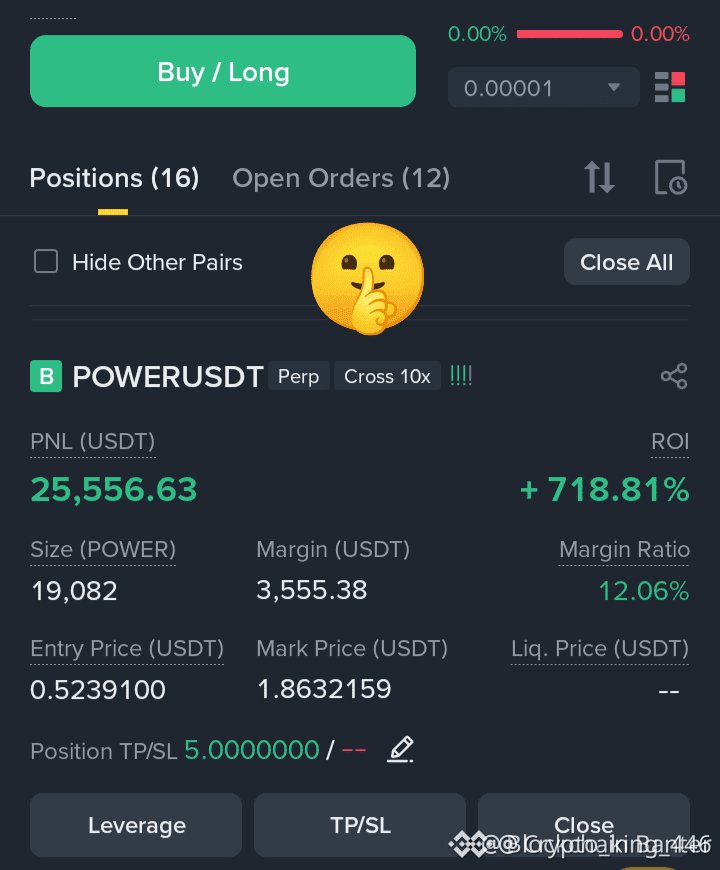
$POWR POWER is a utility token used within the Power Protocol ecosystem for things like governance, staking rewards, protocol fees, and coordinating applications on the network.
It’s a relatively young and smaller-market crypto, so price history and established trends are still forming
Current Market Overview
Price and market cap move daily — for example at one point it traded around ~$0.28 USD with significant 24-hour volume (tens of millions).
The token has experienced both volatile swings and activity spikes, typical for low-cap crypto assets.
All-time price history shows a high near ~$2.30 and a low near ~$0.08, indicating very wide volatility ranges.
You said:
Power coin analysis
Recent sessions showed volume surges and price increases, sometimes outperforming the broader crypto market.
When trading volume rises strongly, it often suggests genuine interest rather than random noise, though this isn’t guaranteed.
Price actions have seen dynamic support around key levels — for instance, if POWER stays above support zones (e.g., ~$0.20–$0.40), traders view this as a potential base for further gains.
Bearish/Caution Factors
Some rises appear driven more by social buzz and trading signals rather than fundamental news or major ecosystem growth.
Technical ranges suggest strong resistance levels at higher thresholds (e.g., ~$0.40–$0.45), which can limit short-term upside until broken with volume.
Tokens with lower liquidity and market cap typically have larger price swings and higher risk, including sharp downturns or quick reversals.
📌 Support & Resistance (Technical)
Typical trader points to watch:
Support levels: around key psychological floors (approx. $0.20) — hold here may mean fewer sharp sell-offs.
Resistance ranges: near recent high consolidation zones (~$0.40 and above) before stronger continuation.
These levels aren’t guarantees — crypto technicals are probabilistic, not fixed #MarketRebound #power
1
·
--
Artım
Tərcüməyə bax
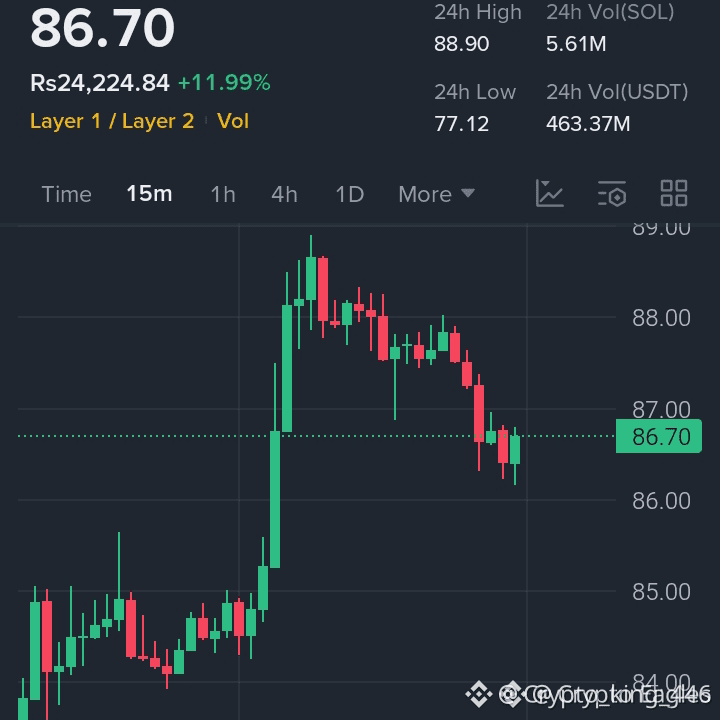
$SOL $POWER $SOL Pullback Before Expansion 🚀
Entry: 84 – 86
Bullish Above: 89
TP1: 95
TP2: 102
TP3: 115
SL: 80
#IranConfirmsKhameneiIsDead #MarketRebound #USIsraelStrikeIran #AnthropicUSGovClash #sol
$SOL $POWER $SOL Pullback Before Expansion 🚀
Entry: 84 – 86
Bullish Above: 89
TP1: 95
TP2: 102
TP3: 115
SL: 80
#IranConfirmsKhameneiIsDead #MarketRebound #USIsraelStrikeIran #AnthropicUSGovClash #sol
Entry: 84 – 86
Bullish Above: 89
TP1: 95
TP2: 102
TP3: 115
SL: 80
#IranConfirmsKhameneiIsDead #MarketRebound #USIsraelStrikeIran #AnthropicUSGovClash #sol
10
·
--
Azalma
Tərcüməyə bax
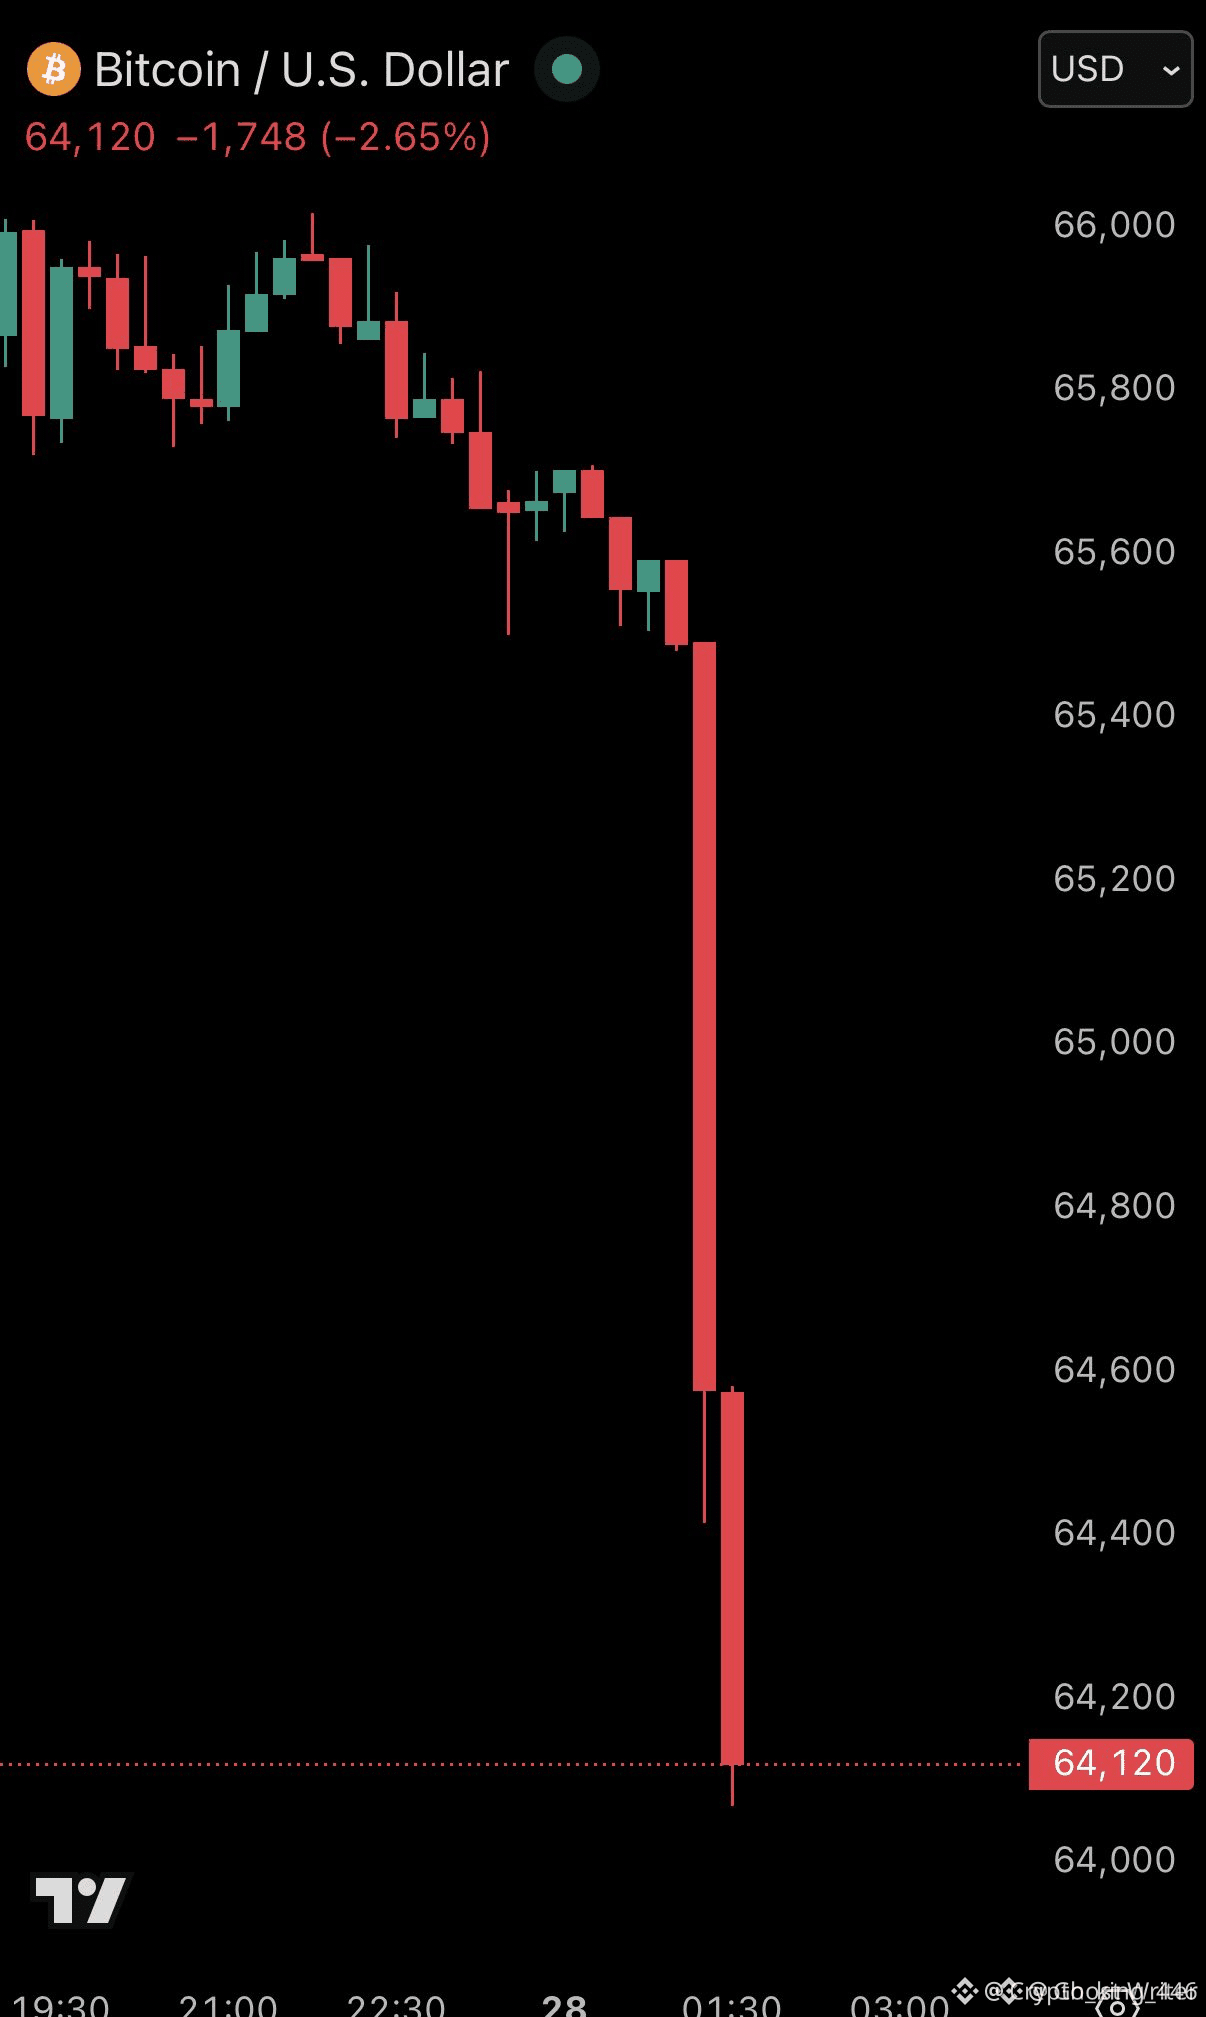
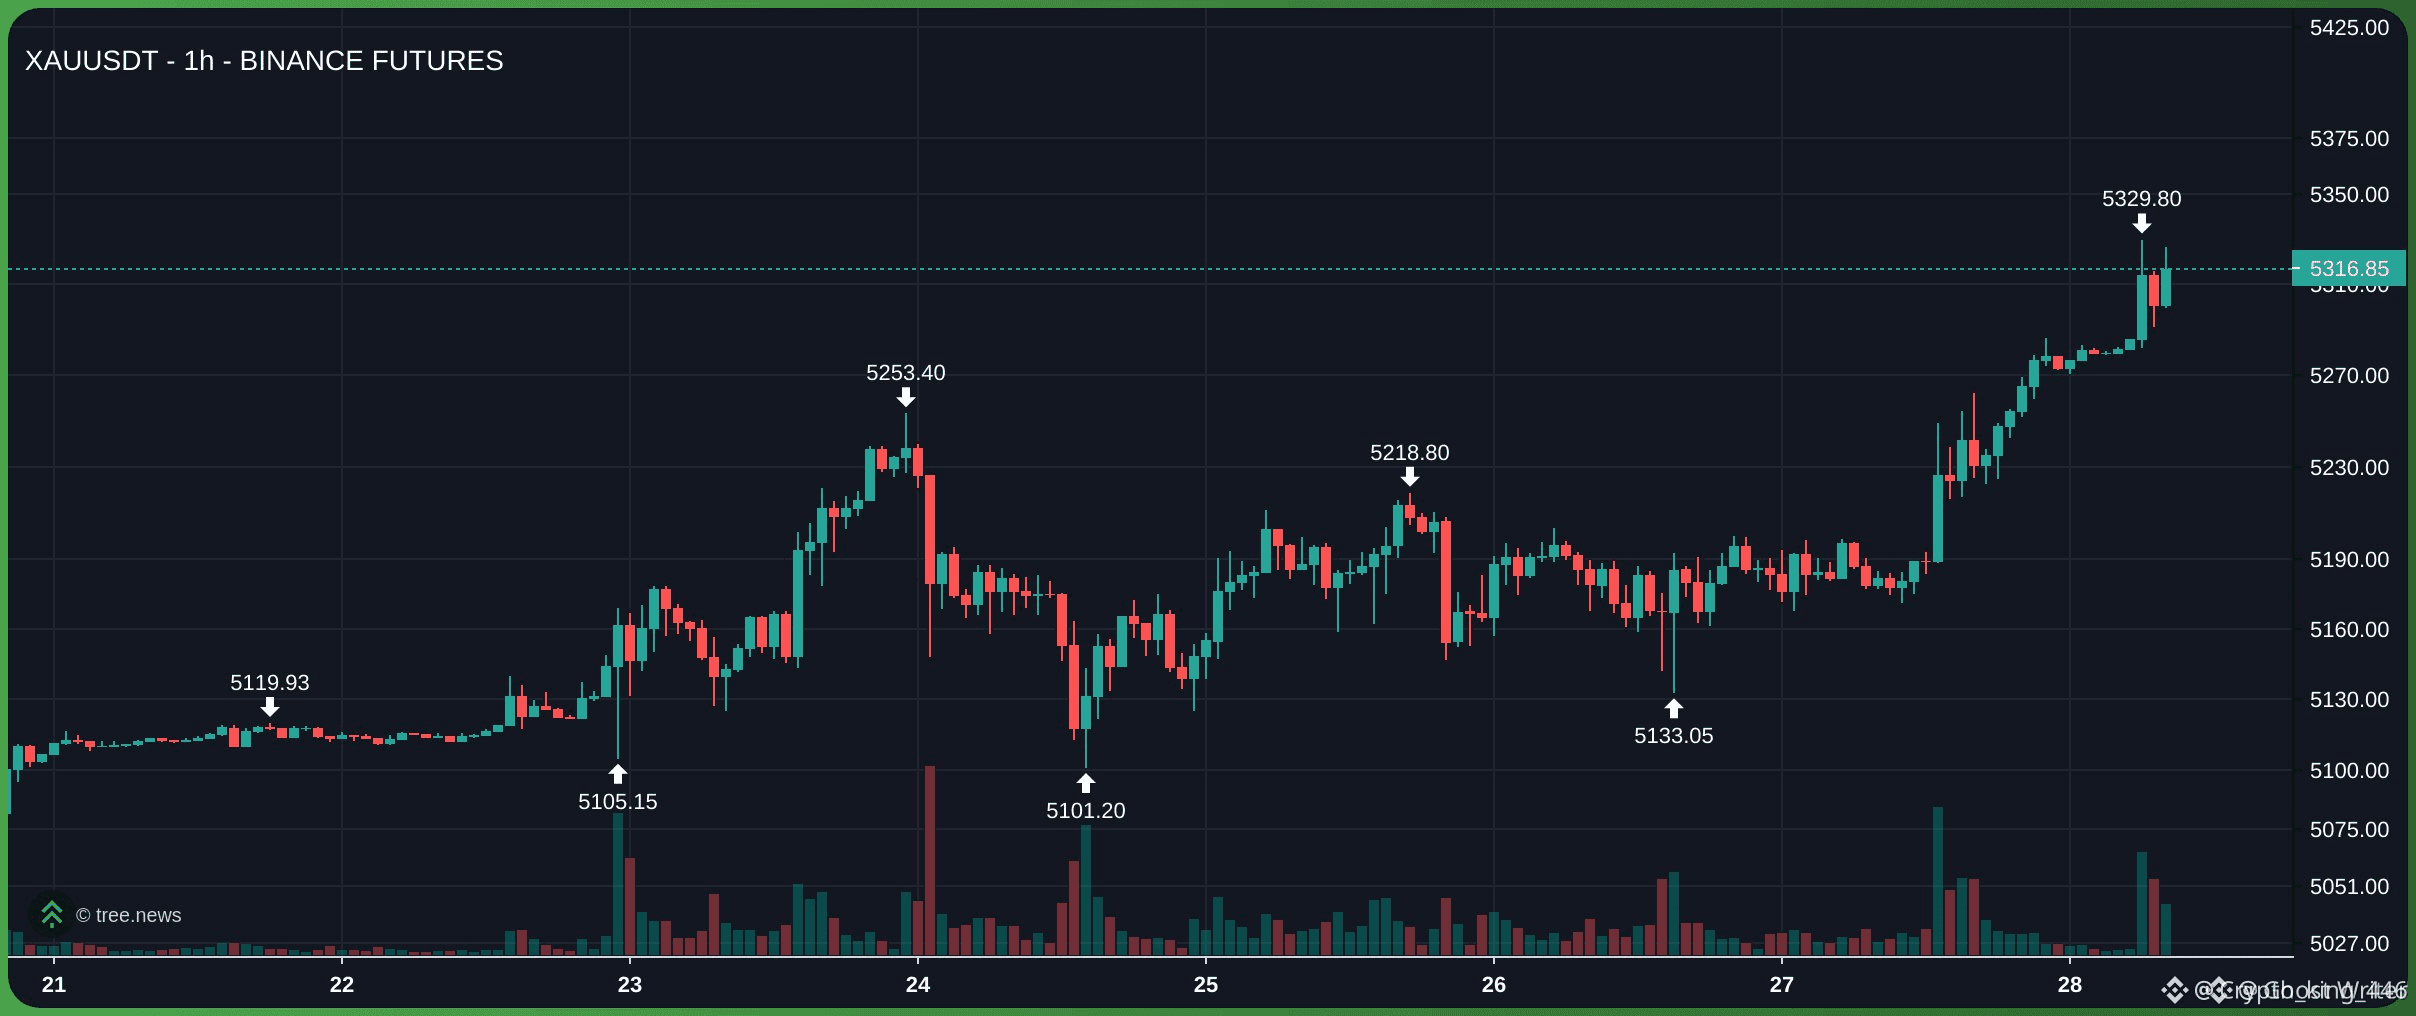
$BTC BREAKING: Bitcoin falls below $64,000 as Israel launches strikes on Iran.
Over $100 million worth of levered longs have been liquidated in 15 minutes.
Only GOLD $XAU can protect our asset
#MarketRebound #BTC
$BTC BREAKING: Bitcoin falls below $64,000 as Israel launches strikes on Iran.
Over $100 million worth of levered longs have been liquidated in 15 minutes.
Only GOLD $XAU can protect our asset
#MarketRebound #BTC
Over $100 million worth of levered longs have been liquidated in 15 minutes.
Only GOLD $XAU can protect our asset
#MarketRebound #BTC
9
Tərcüməyə bax
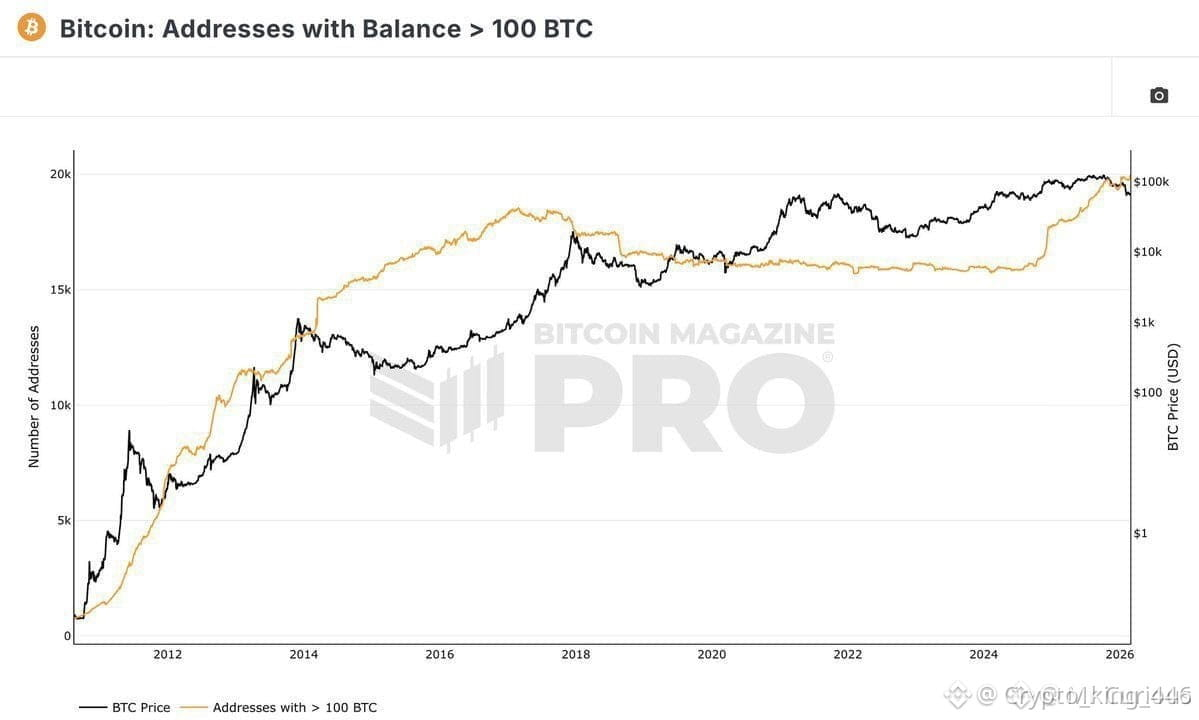
$BTC 🟢 The number of addresses holding more than 100 bitcoins has reached an all-time high.
🔔 Whales are once again accumulating Bitcoin #MarketRebound #BTC
$BTC 🟢 The number of addresses holding more than 100 bitcoins has reached an all-time high.
🔔 Whales are once again accumulating Bitcoin #MarketRebound #BTC
🔔 Whales are once again accumulating Bitcoin #MarketRebound #BTC
4
·
--
Artım
Tərcüməyə bax
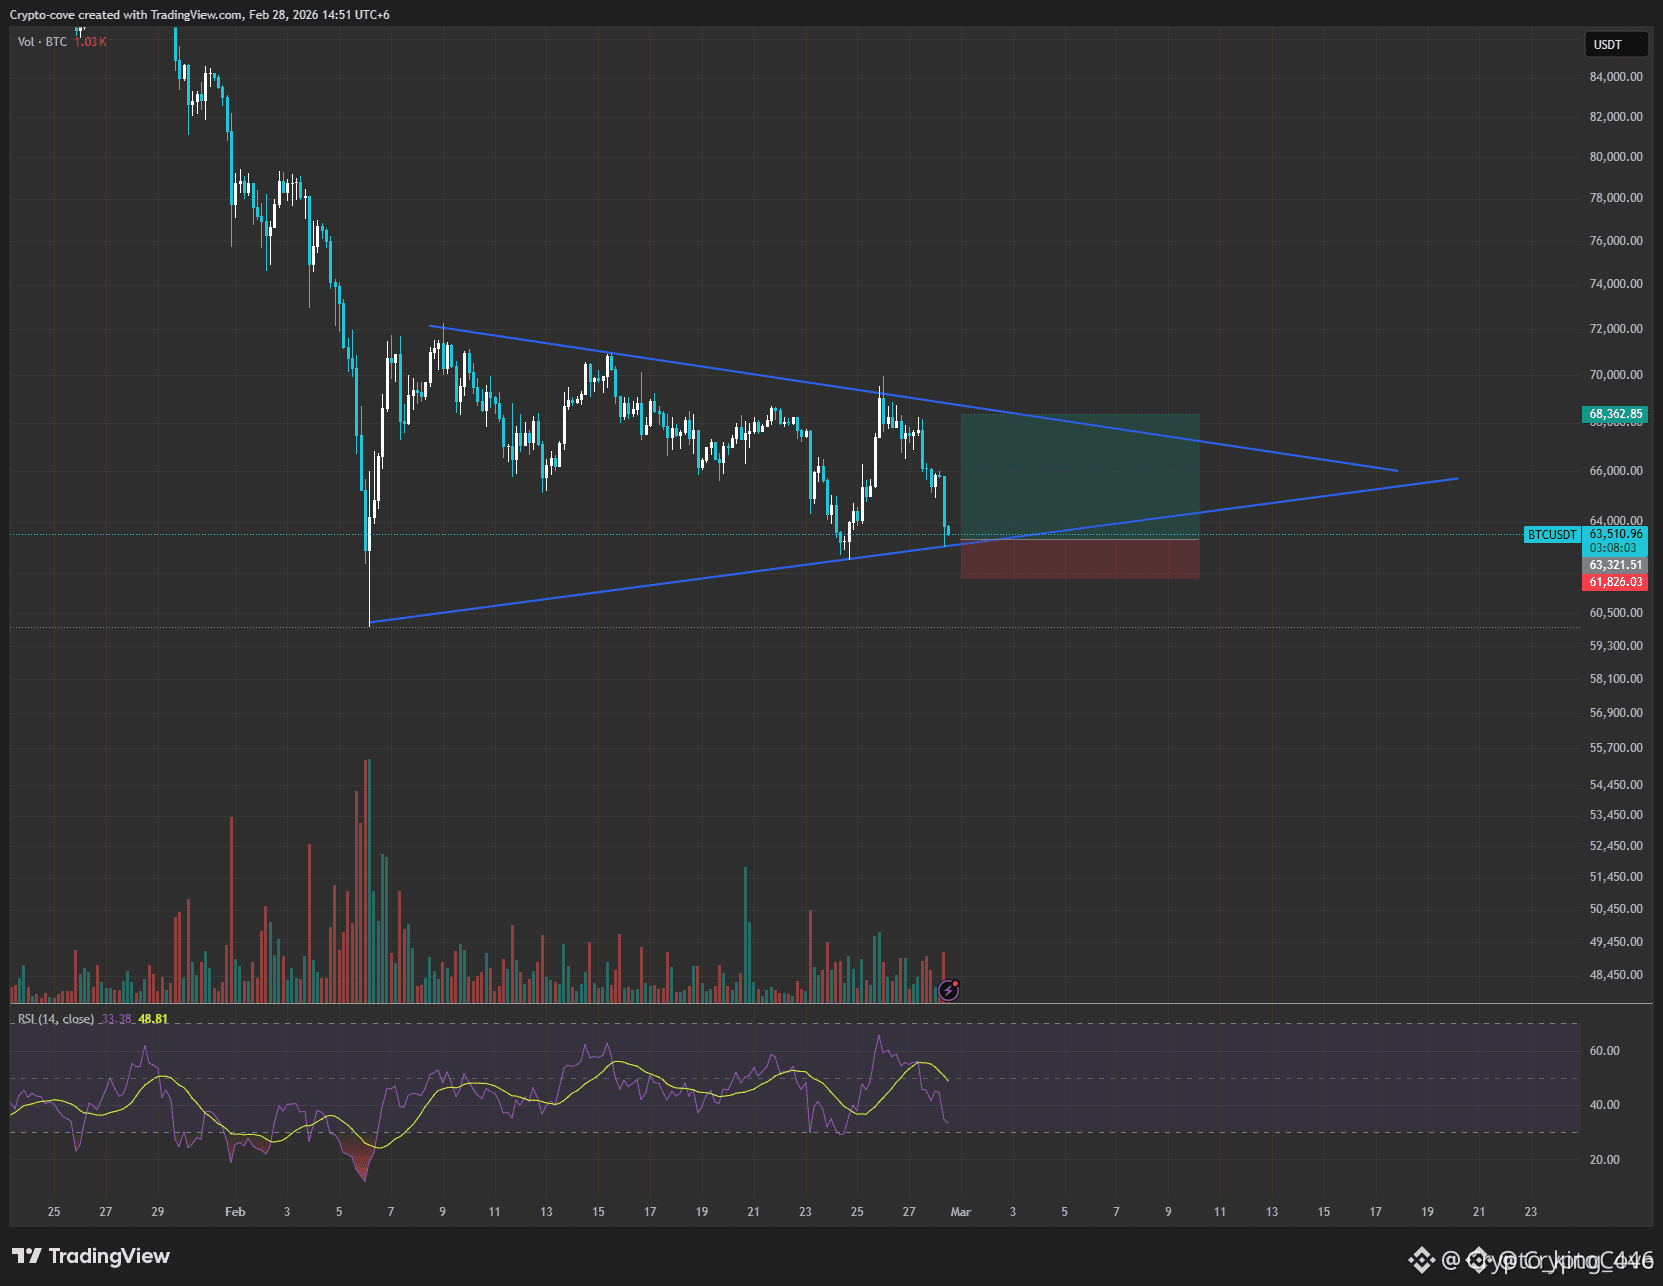
$BTC is holding trendline support ( huge bullish sign)
Signal type- Long
leverage - 20x
entry price - 63300-6450
1st tp- 66300 Sl at entry close 40%
2nd tp- 70000 close 100%
SL- 61800 #MarketRebound #BTC
$BTC is holding trendline support ( huge bullish sign)
Signal type- Long
leverage - 20x
entry price - 63300-6450
1st tp- 66300 Sl at entry close 40%
2nd tp- 70000 close 100%
SL- 61800 #MarketRebound #BTC
Signal type- Long
leverage - 20x
entry price - 63300-6450
1st tp- 66300 Sl at entry close 40%
2nd tp- 70000 close 100%
SL- 61800 #MarketRebound #BTC
9
·
--
Artım
Tərcüməyə bax
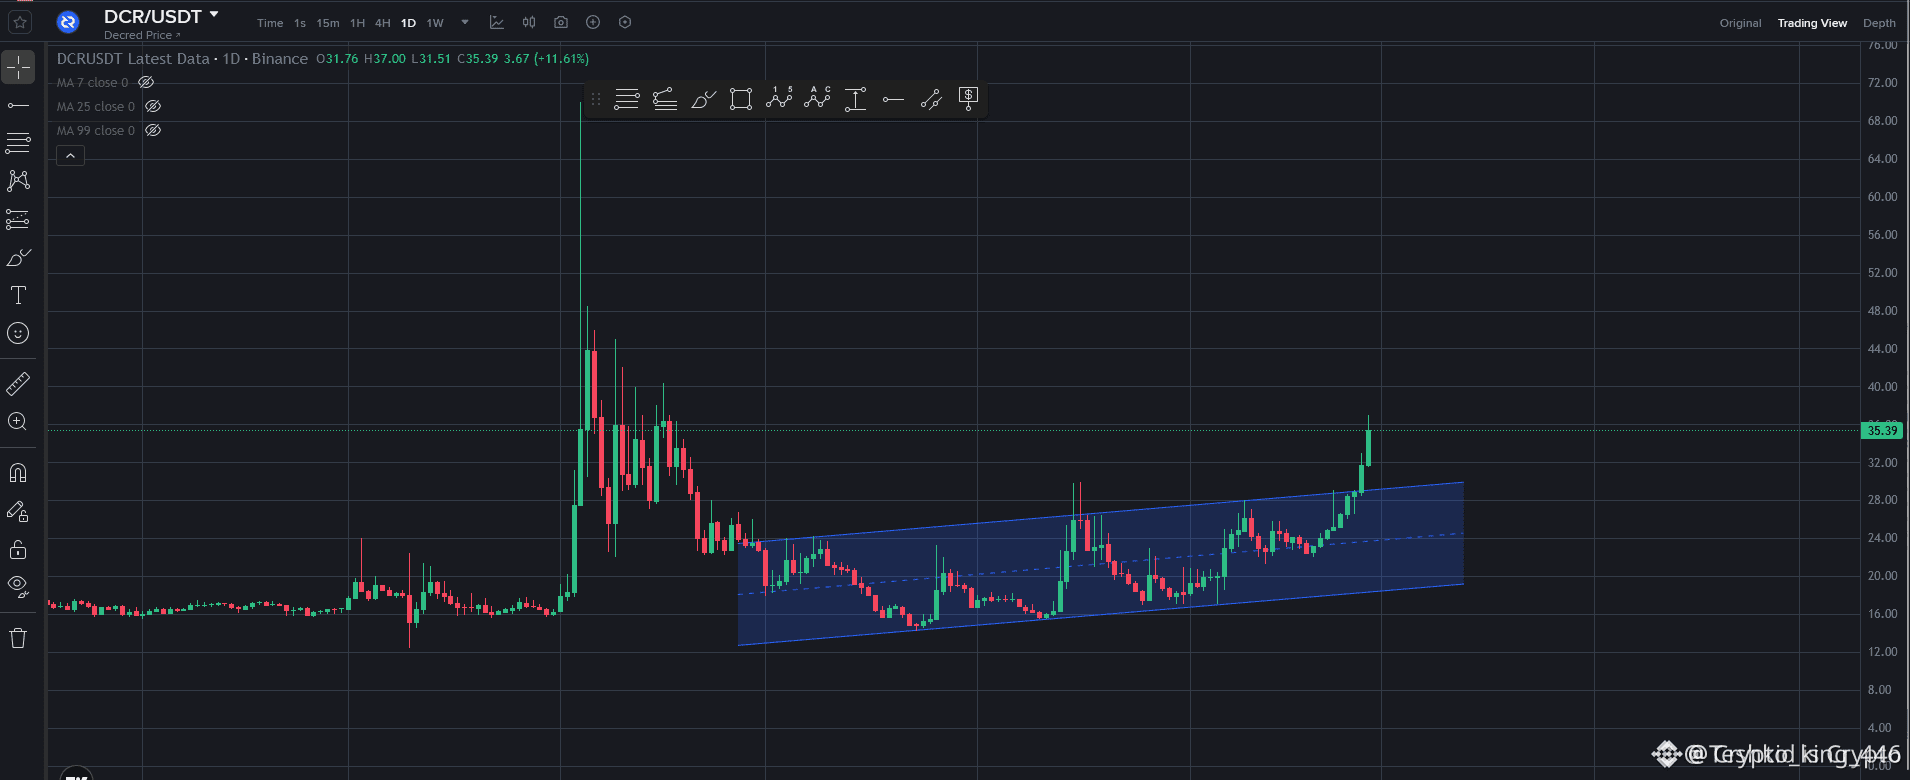
$DCR
Here’s a current analysis of the crypto DCR (Decred) — covering fundamentals, price action, technicals, and medium-/long-term outlook (based on the latest market data and expert summaries):
📌 1. What is Decred (DCR)?
Decred is a decentralized cryptocurrency with a unique hybrid Proof-of-Work (PoW) + Proof-of-Stake (PoS) consensus mechanism that emphasizes community governance, on-chain voting, and sustainability.
Stakeholders can vote on treasury spend, upgrades, and policies.
A fixed max supply of 21 million coins supports scarcity.
This governance model is a key part of Decred’s investment thesis — distinguishing it from many other altcoins.
📖 2. Recent Price & Market Performance (Feb 2026)
📊 Live Market Snapshot
Current price recently surged ~22 % in 24 h (volatile moves).
Market cap around $600M + with growing trading volume.
📈 Short-Term Technicals
DCR has bounced off key support levels and is approaching a critical resistance near ~$26–$27.
Trading above major EMAs (50 & 200), indicating bullish bias, but momentum indicators like MACD & RSI are mixed.
Low liquidity and high staking rates reduce sell pressure — bulls view this as constructive.
Key levels traders watch:
Support: ~$20–$22
Resistance: ~$26–$30
A daily close above resistance could open room for larger moves; failure to clear it might result in consolidation.
💹 3. Technical Analysis Snapshot
Bullish indicators:
✔ Price above long-term moving averages.
✔ Staking locks up supply — limiting sell pressure.
Bearish/Neutral aspects:
✖ MACD flattening could warn of loss of momentum.
✖ Bitcoin/altcoin market sentiment still influences DCR price.
Short-term swings are common, so caution is prudent.
🧠 4. Fundamental & Long-Term Drivers
🔹 Governance & Treasury Strength
Decred’s treasury and governance upgrades (e.g., increased treasury spend flexibility passed with ~99.98 % approval) are seen as fundamentally bullish. This can help fund ecosystem growth #MarketRebound #DCR
13
13
·
--
Artım
Tərcüməyə bax
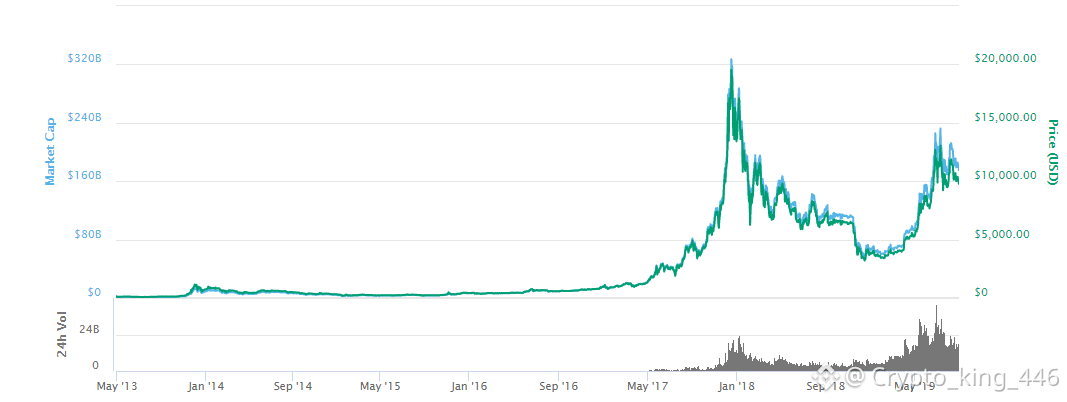
$BTC BTC has been oscillating in a consolidation range ~$60K–$70K, with traders cautious and volatility still present. This reflects mixed sentiment — neither full bull nor bear dominance yet.
Fear & Greed Index remains low, indicating high fear and risk-off behavior currently.
📈 Technical Analysis – Short to Medium Term
🔹 Bullish Signals
BTC price holding above the 20‑day moving average suggests buyers stepping in on dips — often a bullish short‑term signal.
A rebound toward upper Bollinger Band around ~$71,000+ could confirm continuation if sustained.
Some models predict a near‑term rise toward $72,000–$73,600 within the next few days if momentum increases.
🔻 Bearish / Caution Signals
Longer‑term indicators lean bearish overall, with many technicals signaling selling pressure outweighing buys.
Major resistance sits around $70,000–$72,000; failure to break this convincingly often leads to sideways or downward moves.
ETF outflows and institutional retreat remain a drag on strong upside momentum.
📌 Key Technical Levels (Markers to Watch)
Support Levels:
~$66,000–$67,000 — short‑term support range.
~$61,000 — deeper support if weakness continues.
Resistance Levels:
~$70,000 — first major hurdle.
~$72,000–$75,000 — next zone if bulls regain control
#MarketRebound #BTC
11
11
·
--
Artım
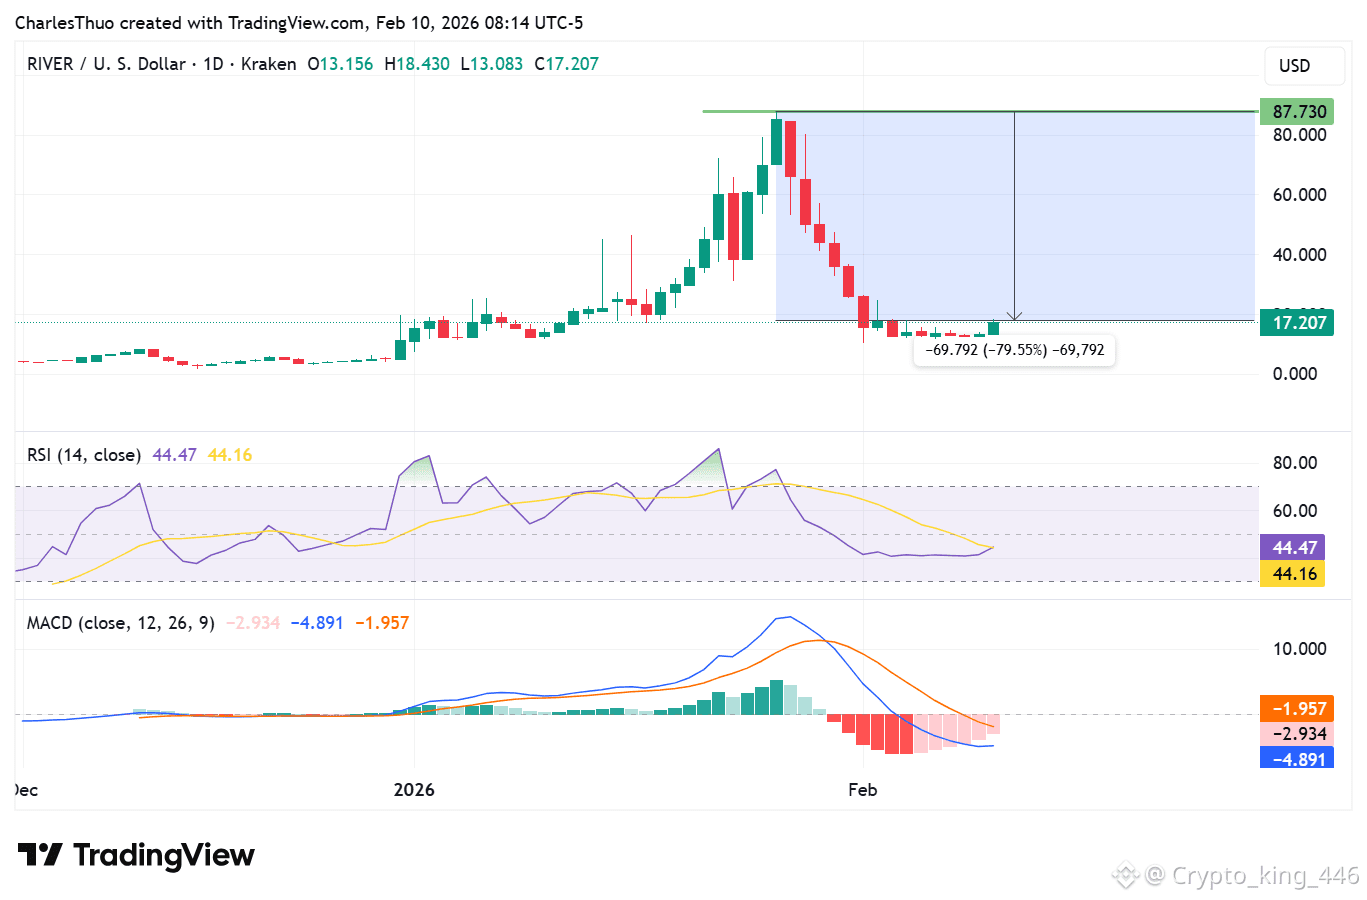
$RIVER
Siz dediniz:
River coin analizi və mənə qrafik foto verin
ChatGPT dedi:
Burada River (RIVER) kriptovalyutası üçün cari qiymət analizi və qrafik, eləcə də əsas bazar məlumatları var 👇
📊 RIVER Qiymət Ümumi Görünüşü (Canlı)
Son kripto bazar məlumatlarına əsasən:
Qiymət (USD): Təxminən $10–$14 aralığında (mübadilə və mənbəyə görə dəyişir) 🟢📉
Bazar Dəyəri: $200–$270M USD-dən yuxarı
Dolaşım Təklifi: 100M maksimumdan ~19.6M
Bütün Zamanların Yüksək Qiyməti: 2026-cı il yanvarın 26-da ~$87.7
Bütün Zamanların Aşağı Qiyməti: 2025-ci ilin sonlarında ~$1.5–$1.63
Bu, qiymətin zirvəsindən kəskin şəkildə düşdüyünü və dəyişkən qaldığını göstərir — yeni və ya aşağı likvidlikli altcoinlər üçün tipikdir.
📉 Cari Bazar Ruhu və Texniki Sinyallar
Analitiklər qeyd edir:
✔ RIVER qiyməti kəskin dalğalanmalar və geniş kripto bazarlarına nisbətdə zəif performans göstərmişdir, qısa müddətdə bearish təzyiqlərlə.
✔ Diqqət edilməli olan əsas dəstək/qarşı durma səviyyələri:
⚠ Dəstək ~$11–$13 ətrafında
📈 Qarşı Durma ~$18–$20+
Dəstəyi aşağıya keçməsi daha da aşağı risklə nəticələnir; qarşı durmanı bərpa etmək satış təzyiqini azaltmağa kömək edə bilər.
Bundan əlavə, son müsbət katalizatorlar, məsələn, bir cross-chain körpü başlatma və mübadilə siyahısına daxil olma qısa müddətli qazanc əldə etdi, lakin analitiklər daha güclü əsaslarla davamlılıq barədə ehtiyatlıdır
#MarketRebound #RİVER
1
17
578
Daha çox kontent araşdırmaq üçün daxil olun
Binance Square-də qlobal kriptovalyuta istifadəçilərinə qoşulun
⚡️ Kriptovalyuta haqqında ən son və faydalı məlumatları əldə edin.
💬 Dünyanın ən böyük kriptovalyuta birjası tərəfindən etibar edilir.
👍 Doğrulanmış yaradıcılardan gələn real məlumatları kəşf edin.
E-poçt/Telefon nömrəsi
Trenddə olan mövzular
BitcoinSlipsBelow$80KAgain
111 baxış
Müzakirə edir: 14
Balinalar bazardan çıxarkən BTC qan itirir — korporativ alıcıya qarşı satış təzyiqi
Yeddi gündür qiymət enir və bunu pərakəndə investorlar yaratmayıb.
BTC oktyabrın 27-də təxminən 79,796 səviyyəsində bağlandı; 7 gündə təxminən 2.6%, 30 gündə isə təxminən 5.2% gerilədi. Gündəlik RSI(12) 39.8 səviyyəsindədir. Həftənin diapazonu: ən yüksək təxminən 84,377 (22 oktyabr), ən aşağı təxminən 79,220 (24 oktyabr). Kapitulyasiya şamı yoxdur. 84K səviyyəsinin geri alınması yoxdur. Sadəcə tədricən eniş.
Təklif tərəfi hər şeyi deyir. Hərəkətsiz pul kisələri 2,571 BTC-ni (təxminən $206.5M) institusional birjalara yönəldib. Bu, təklifin platformaya daxil olmasıdır, oradan çıxması yox. Xəzinə marağı da azalıb — Strategy BTC almaq əvəzinə $204.9M-ni səhmlərin geri alınmasına yönəldib.
Dəstəkdəki alıcı spekulyativ deyil, korporativdir. Strive 6,182 BTC (təxminən $511.4M) alıb; açıq şirkətlər birlikdə 6,200-dən çox BTC alıblar. Bu, $79.7K ətrafında real dəstək arqumentidir — amma bu, dəstək səviyyəsidir, yüksəlişə təkan verən katalizator deyil.
Momentum öküzlərin tərəfində deyil. MACD histoqramı −23.99-dur, qiymət isə 99 EMA-nın altındadır. Bu struktur dəyişənədək yüksəliş potensialı təxminən $80.5K-dan aşağı məhdudlaşır.
Mövqelənmə bir qədər yüksəliş yönümlüdür, amma eyforik deyil. Square icmasının sorğusunda 3,830 səsdən 2,116-sı yüksəliş, 1,714-ü isə eniş gözləyir. Nümunə məhduddur — məlumatlı olmaq üçün dəyərlidir, amma təkbaşına buna əsasən ticarət etmək üçün yox.
Mənim qənaətim: bu, korporativ alıcıya qarşı payların satışıdır. Dəstək realdır, amma momentum yoxdur. Bu həftənin əsas məsələsi birjalara daxil olan vəsaitin 79.2K–79.7K zonasını udub-uda bilməyəcəyini izləməkdir.
#BitcoinSlipsBelow$80KAgain
_Mr_Singh_
·0 bəyənmə
·199 baxış
ThailandLaunchesWORPTStablecoinToQRPaymentApp
0 baxış
Müzakirə edir: 10
StrategySkipsBitcoinPurchasesSpends$205MOnSTRCBuybacks
2,749 baxış
Müzakirə edir: 64