
Shamekh Ahmed
84 Paylaşımlar

Shamekh Ahmed
Şikayət et
İstifadəçini blokla
All future and present updates will be delivered stay tuned
19 İzlənilir
43 İzləyicilər
99 Bəyəndi
Postlar
Hamısı
Sitatlar
Tərcüməyə bax
🚀 Binance Pick Prediction Challenge! 📊
Ready to test your market knowledge and prediction skills? 🔥
Make your picks, analyze the trends, and trust your strategy. Every prediction counts, and every point matters!
🎯 Play smart. Predict wisely. Win big!
#BinancePick
🚀 Binance Pick Prediction Challenge! 📊
Ready to test your market knowledge and prediction skills? 🔥
Make your picks, analyze the trends, and trust your strategy. Every prediction counts, and every point matters!
🎯 Play smart. Predict wisely. Win big!
#BinancePick
Ready to test your market knowledge and prediction skills? 🔥
Make your picks, analyze the trends, and trust your strategy. Every prediction counts, and every point matters!
🎯 Play smart. Predict wisely. Win big!
#BinancePick
74
Tərcüməyə bax
Day 1 | Binance Pick Is Live! 🚀
Binance Pick is here! Make predictions, complete tasks, earn Scores, and climb the leaderboard for a chance to share up to 1,000,000 USDC in rewards.
Are you joining the challenge?
#BinancePick
Day 1 | Binance Pick Is Live! 🚀
Binance Pick is here! Make predictions, complete tasks, earn Scores, and climb the leaderboard for a chance to share up to 1,000,000 USDC in rewards.
Are you joining the challenge?
#BinancePick
Binance Pick is here! Make predictions, complete tasks, earn Scores, and climb the leaderboard for a chance to share up to 1,000,000 USDC in rewards.
Are you joining the challenge?
#BinancePick
95
Tərcüməyə bax
I saw dream that btc drops down to 45$ .
God knows better .
I saw dream that btc drops down to 45$ .
God knows better .
God knows better .
75
Tərcüməyə bax
I think today all time consume in consolidation in BTC 🥲
$BTC
{future}(BTCUSDT)
I think today all time consume in consolidation in BTC 🥲
$BTC
$BTC
89
Məqalə
Tərcüməyə bax
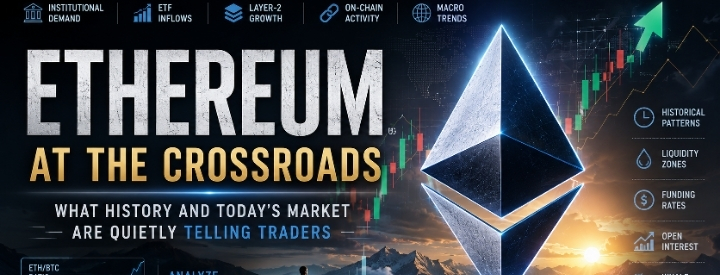
Ethereum at the Crossroads: What History and Today's Market Are Quietly Telling TradersIntroduction :
Ethereum (ETH) remains the heartbeat of the crypto ecosystem, but its price is no longer driven solely by retail speculation. Institutional investors, ETF flows, macroeconomic policy, on-chain activity, derivatives positioning, and liquidity dynamics now play a major role. To understand where Ethereum may move next, traders must compare the current market with previous cycles rather than relying on price charts alone.
Deep Analysis :
The first thing history teaches us is that Ethereum rarely moves independently. In previous bull markets, Bitcoin established the trend before capital rotated into Ethereum, which often outperformed during the middle stage of the cycle. Today, however, the market structure is more mature. Spot Ethereum ETFs have introduced a new source of institutional demand, while Layer-2 adoption continues to increase network usage. If ETF inflows remain healthy, exchange reserves continue declining, and Bitcoin maintains its higher-timeframe trend, these conditions resemble the early stages of previous expansion phases rather than market tops. At the same time, traders should monitor the ETH/BTC ratio because sustained strength there often signals that capital is rotating toward Ethereum instead of remaining concentrated in Bitcoin.
Another overlooked factor is liquidity. Retail traders usually react to large green candles, whereas professional traders watch where liquidity is accumulating. Ethereum has historically been known for sweeping previous highs or lows to trigger stop-losses before reversing in the dominant trend. This behavior becomes even more pronounced when Open Interest rises sharply alongside overly positive or negative funding rates, indicating excessive leverage. If price rises while supported by increasing spot volume, steady ETF inflows, and moderate funding, the move is generally healthier than one driven purely by leveraged futures. The distinction between genuine demand and speculative leverage often determines whether a rally has room to continue or is vulnerable to a sharp correction.
The broader macroeconomic environment now carries more influence over Ethereum than in earlier cycles. Interest-rate expectations, inflation data, central bank policy, and global liquidity conditions increasingly affect institutional risk appetite. Positive macroeconomic developments combined with strong on-chain activity, rising stablecoin liquidity, and continued developer growth create a favorable backdrop for Ethereum. Conversely, weakening macro conditions or declining institutional participation can limit upside even when technical indicators appear bullish. The strongest trading decisions therefore come from aligning historical market behavior with current liquidity, derivatives data, macro trends, and on-chain fundamentals instead of relying on any single indicator.
Conclusion :
Ethereum's next major move is unlikely to be determined by a single news headline or chart pattern. History suggests that the highest-probability opportunities emerge when multiple factors—market structure, institutional flows, liquidity, on-chain activity, and macroeconomic conditions—point in the same direction. Rather than trying to predict every price swing, traders who patiently wait for these signals to align are generally better positioned to capture high-quality opportunities while managing risk effectively.
$ETH
{future}(ETHUSDT)
Ethereum at the Crossroads: What History and Today's Market Are Quietly Telling Traders
Introduction :
Ethereum (ETH) remains the heartbeat of the crypto ecosystem, but its price is no longer driven solely by retail speculation. Institutional investors, ETF flows, macroeconomic policy, on-chain activity, derivatives positioning, and liquidity dynamics now play a major role. To understand where Ethereum may move next, traders must compare the current market with previous cycles rather than relying on price charts alone.
Deep Analysis :
The first thing history teaches us is that Ethereum rarely moves independently. In previous bull markets, Bitcoin established the trend before capital rotated into Ethereum, which often outperformed during the middle stage of the cycle. Today, however, the market structure is more mature. Spot Ethereum ETFs have introduced a new source of institutional demand, while Layer-2 adoption continues to increase network usage. If ETF inflows remain healthy, exchange reserves continue declining, and Bitcoin maintains its higher-timeframe trend, these conditions resemble the early stages of previous expansion phases rather than market tops. At the same time, traders should monitor the ETH/BTC ratio because sustained strength there often signals that capital is rotating toward Ethereum instead of remaining concentrated in Bitcoin.
Another overlooked factor is liquidity. Retail traders usually react to large green candles, whereas professional traders watch where liquidity is accumulating. Ethereum has historically been known for sweeping previous highs or lows to trigger stop-losses before reversing in the dominant trend. This behavior becomes even more pronounced when Open Interest rises sharply alongside overly positive or negative funding rates, indicating excessive leverage. If price rises while supported by increasing spot volume, steady ETF inflows, and moderate funding, the move is generally healthier than one driven purely by leveraged futures. The distinction between genuine demand and speculative leverage often determines whether a rally has room to continue or is vulnerable to a sharp correction.
The broader macroeconomic environment now carries more influence over Ethereum than in earlier cycles. Interest-rate expectations, inflation data, central bank policy, and global liquidity conditions increasingly affect institutional risk appetite. Positive macroeconomic developments combined with strong on-chain activity, rising stablecoin liquidity, and continued developer growth create a favorable backdrop for Ethereum. Conversely, weakening macro conditions or declining institutional participation can limit upside even when technical indicators appear bullish. The strongest trading decisions therefore come from aligning historical market behavior with current liquidity, derivatives data, macro trends, and on-chain fundamentals instead of relying on any single indicator.
Conclusion :
Ethereum's next major move is unlikely to be determined by a single news headline or chart pattern. History suggests that the highest-probability opportunities emerge when multiple factors—market structure, institutional flows, liquidity, on-chain activity, and macroeconomic conditions—point in the same direction. Rather than trying to predict every price swing, traders who patiently wait for these signals to align are generally better positioned to capture high-quality opportunities while managing risk effectively.
$ETH
Ethereum (ETH) remains the heartbeat of the crypto ecosystem, but its price is no longer driven solely by retail speculation. Institutional investors, ETF flows, macroeconomic policy, on-chain activity, derivatives positioning, and liquidity dynamics now play a major role. To understand where Ethereum may move next, traders must compare the current market with previous cycles rather than relying on price charts alone.
Deep Analysis :
The first thing history teaches us is that Ethereum rarely moves independently. In previous bull markets, Bitcoin established the trend before capital rotated into Ethereum, which often outperformed during the middle stage of the cycle. Today, however, the market structure is more mature. Spot Ethereum ETFs have introduced a new source of institutional demand, while Layer-2 adoption continues to increase network usage. If ETF inflows remain healthy, exchange reserves continue declining, and Bitcoin maintains its higher-timeframe trend, these conditions resemble the early stages of previous expansion phases rather than market tops. At the same time, traders should monitor the ETH/BTC ratio because sustained strength there often signals that capital is rotating toward Ethereum instead of remaining concentrated in Bitcoin.
Another overlooked factor is liquidity. Retail traders usually react to large green candles, whereas professional traders watch where liquidity is accumulating. Ethereum has historically been known for sweeping previous highs or lows to trigger stop-losses before reversing in the dominant trend. This behavior becomes even more pronounced when Open Interest rises sharply alongside overly positive or negative funding rates, indicating excessive leverage. If price rises while supported by increasing spot volume, steady ETF inflows, and moderate funding, the move is generally healthier than one driven purely by leveraged futures. The distinction between genuine demand and speculative leverage often determines whether a rally has room to continue or is vulnerable to a sharp correction.
The broader macroeconomic environment now carries more influence over Ethereum than in earlier cycles. Interest-rate expectations, inflation data, central bank policy, and global liquidity conditions increasingly affect institutional risk appetite. Positive macroeconomic developments combined with strong on-chain activity, rising stablecoin liquidity, and continued developer growth create a favorable backdrop for Ethereum. Conversely, weakening macro conditions or declining institutional participation can limit upside even when technical indicators appear bullish. The strongest trading decisions therefore come from aligning historical market behavior with current liquidity, derivatives data, macro trends, and on-chain fundamentals instead of relying on any single indicator.
Conclusion :
Ethereum's next major move is unlikely to be determined by a single news headline or chart pattern. History suggests that the highest-probability opportunities emerge when multiple factors—market structure, institutional flows, liquidity, on-chain activity, and macroeconomic conditions—point in the same direction. Rather than trying to predict every price swing, traders who patiently wait for these signals to align are generally better positioned to capture high-quality opportunities while managing risk effectively.
$ETH
62

Məqalə
Tərcüməyə bax
FUTURE ANALYSISFrom this chart, this coin is still in a very early and highly speculative phase. The biggest thing I notice is:
Huge launch spike → then heavy dump
Now price is trying to stabilize around $0.55–$0.65
Volume recently increased strongly, which means traders are watching it again
RSI near 41 = not overbought, but momentum still weak
The project behind it — Pharos (PROS) — is focused on the growing RWA / RealFi narrative (real-world assets on blockchain). That sector is becoming popular because institutions are entering crypto infrastructure.
What looks bullish
Strong narrative: RWA + institutional finance
Team reportedly connected to former Ant Group/Alibaba blockchain engineers
Early-stage Layer 1 projects can move aggressively in bull markets
Current consolidation after dump can become accumulation if buyers continue
What looks risky
FDV is still very high compared to circulating market cap
(This screenshot shows ~$643M FDV vs ~$87M market cap)
Low liquidity compared to valuation
New coins often pump hard then bleed for months
Token unlocks can create heavy selling pressure later
Important levels from your chart
Support zone
$0.55–0.58
If this breaks strongly, price may revisit lower panic zones
Resistance zone
$0.72–0.75
Then major resistance near $0.90–1.00
If price closes above that resistance with strong volume, bullish momentum could return.
My realistic expectation
Short term
Likely range:
$0.55 → $0.85
Unless the whole crypto market becomes strongly bullish.
Mid-term (if RWA narrative explodes)
Possible:
$1.5–3+
But only if:
exchange listings improve,
ecosystem grows,
and real adoption appears.
Worst case
Like many new L1 coins:
could slowly fade below launch valuation if hype disappears.
Overall view
This is not a “safe” coin. It is a high-risk, high-reward early-stage project.
I’d classify it like:
Potential: High
Stability: Low
Risk: Very High
Suitable for: small speculative positions only.
$PHAROS
{alpha}(84530x8b7dde054be9d180c1be7fae0874697374a49832)
FUTURE ANALYSIS
From this chart, this coin is still in a very early and highly speculative phase. The biggest thing I notice is:
Huge launch spike → then heavy dump
Now price is trying to stabilize around $0.55–$0.65
Volume recently increased strongly, which means traders are watching it again
RSI near 41 = not overbought, but momentum still weak
The project behind it — Pharos (PROS) — is focused on the growing RWA / RealFi narrative (real-world assets on blockchain). That sector is becoming popular because institutions are entering crypto infrastructure.
What looks bullish
Strong narrative: RWA + institutional finance
Team reportedly connected to former Ant Group/Alibaba blockchain engineers
Early-stage Layer 1 projects can move aggressively in bull markets
Current consolidation after dump can become accumulation if buyers continue
What looks risky
FDV is still very high compared to circulating market cap
(This screenshot shows ~$643M FDV vs ~$87M market cap)
Low liquidity compared to valuation
New coins often pump hard then bleed for months
Token unlocks can create heavy selling pressure later
Important levels from your chart
Support zone
$0.55–0.58
If this breaks strongly, price may revisit lower panic zones
Resistance zone
$0.72–0.75
Then major resistance near $0.90–1.00
If price closes above that resistance with strong volume, bullish momentum could return.
My realistic expectation
Short term
Likely range:
$0.55 → $0.85
Unless the whole crypto market becomes strongly bullish.
Mid-term (if RWA narrative explodes)
Possible:
$1.5–3+
But only if:
exchange listings improve,
ecosystem grows,
and real adoption appears.
Worst case
Like many new L1 coins:
could slowly fade below launch valuation if hype disappears.
Overall view
This is not a “safe” coin. It is a high-risk, high-reward early-stage project.
I’d classify it like:
Potential: High
Stability: Low
Risk: Very High
Suitable for: small speculative positions only.
$PHAROS
Huge launch spike → then heavy dump
Now price is trying to stabilize around $0.55–$0.65
Volume recently increased strongly, which means traders are watching it again
RSI near 41 = not overbought, but momentum still weak
The project behind it — Pharos (PROS) — is focused on the growing RWA / RealFi narrative (real-world assets on blockchain). That sector is becoming popular because institutions are entering crypto infrastructure.
What looks bullish
Strong narrative: RWA + institutional finance
Team reportedly connected to former Ant Group/Alibaba blockchain engineers
Early-stage Layer 1 projects can move aggressively in bull markets
Current consolidation after dump can become accumulation if buyers continue
What looks risky
FDV is still very high compared to circulating market cap
(This screenshot shows ~$643M FDV vs ~$87M market cap)
Low liquidity compared to valuation
New coins often pump hard then bleed for months
Token unlocks can create heavy selling pressure later
Important levels from your chart
Support zone
$0.55–0.58
If this breaks strongly, price may revisit lower panic zones
Resistance zone
$0.72–0.75
Then major resistance near $0.90–1.00
If price closes above that resistance with strong volume, bullish momentum could return.
My realistic expectation
Short term
Likely range:
$0.55 → $0.85
Unless the whole crypto market becomes strongly bullish.
Mid-term (if RWA narrative explodes)
Possible:
$1.5–3+
But only if:
exchange listings improve,
ecosystem grows,
and real adoption appears.
Worst case
Like many new L1 coins:
could slowly fade below launch valuation if hype disappears.
Overall view
This is not a “safe” coin. It is a high-risk, high-reward early-stage project.
I’d classify it like:
Potential: High
Stability: Low
Risk: Very High
Suitable for: small speculative positions only.
$PHAROS
4

Məqalə
Tərcüməyə bax
Current Situation AnalysisPrice: ~$0.134
Daily move: +20%
Market Cap: ~$19.6M
FDV: ~$134M
Liquidity: ~$2.44M
Holders: ~2,005 only
Massive move from $0.02 → $0.20 in a very short time.
This usually means:
Very new token
Strong hype/FOMO phase
Extremely volatile
Smart money + traders already active
Important Signals
Bullish Signs
Strong first impulse candle
Price still holding above launch area
Volume initially very high
Not fully dumped after first pump
Liquidity decent for a new token
If momentum continues, next psychological zones can be:
0.15
0.18
Retest of 0.20
Risk Signals (Very Important)
This chart also shows dangerous characteristics:
1. FDV Too High Compared to Market Cap
MC: ~$19M
FDV: ~$134M
That means a huge amount of tokens may still unlock later.
This can create:
Heavy sell pressure
Sudden crashes
Whale manipulation
2. Very Low Holder Count
Only ~2,000 holders.
That means:
A few whales can move price heavily
Price can dump 30–60% quickly
3. Vertical Pump
This kind of candle:
Usually retraces hard
Needs consolidation before safer entry
Many traders buy the top because of excitement.
High Probability Scenarios
Scenario 1 — Bullish Continuation
If price:
Holds above 0.11–0.12
Volume returns strong
Breaks 0.15 cleanly
Then another push toward:
0.18–0.20 possible.
Scenario 2 — Healthy Pullback
Most realistic.
Price may revisit:
0.10
0.08
even 0.06
before deciding next move.
That would actually be healthier for long-term continuation.
Scenario 3 — Trap / Distribution
If whales start selling:
Price can crash back toward launch zone fast.
Especially because:
holder count small
liquidity not huge
early buyers already massively in profit
Safer Strategy Right Now
With small capital like your $5:
Avoid:
FOMO buying big green candles
High leverage futures here
Chasing after 500% moves
Better:
Wait for:
consolidation
support confirmation
volume recovery
Then enter small.
My Overall View
Short term: Bullish but dangerous
Mid term: Depends on token utility/team
Risk level: Very high
Reward potential: Also high
This is the kind of coin that can:
either do another 2–5x
or lose 70% very quickly.
$ZEST
{alpha}(560x5506599c722389a60580b5213ea1da60d64754a1)
Current Situation Analysis
Price: ~$0.134
Daily move: +20%
Market Cap: ~$19.6M
FDV: ~$134M
Liquidity: ~$2.44M
Holders: ~2,005 only
Massive move from $0.02 → $0.20 in a very short time.
This usually means:
Very new token
Strong hype/FOMO phase
Extremely volatile
Smart money + traders already active
Important Signals
Bullish Signs
Strong first impulse candle
Price still holding above launch area
Volume initially very high
Not fully dumped after first pump
Liquidity decent for a new token
If momentum continues, next psychological zones can be:
0.15
0.18
Retest of 0.20
Risk Signals (Very Important)
This chart also shows dangerous characteristics:
1. FDV Too High Compared to Market Cap
MC: ~$19M
FDV: ~$134M
That means a huge amount of tokens may still unlock later.
This can create:
Heavy sell pressure
Sudden crashes
Whale manipulation
2. Very Low Holder Count
Only ~2,000 holders.
That means:
A few whales can move price heavily
Price can dump 30–60% quickly
3. Vertical Pump
This kind of candle:
Usually retraces hard
Needs consolidation before safer entry
Many traders buy the top because of excitement.
High Probability Scenarios
Scenario 1 — Bullish Continuation
If price:
Holds above 0.11–0.12
Volume returns strong
Breaks 0.15 cleanly
Then another push toward:
0.18–0.20 possible.
Scenario 2 — Healthy Pullback
Most realistic.
Price may revisit:
0.10
0.08
even 0.06
before deciding next move.
That would actually be healthier for long-term continuation.
Scenario 3 — Trap / Distribution
If whales start selling:
Price can crash back toward launch zone fast.
Especially because:
holder count small
liquidity not huge
early buyers already massively in profit
Safer Strategy Right Now
With small capital like your $5:
Avoid:
FOMO buying big green candles
High leverage futures here
Chasing after 500% moves
Better:
Wait for:
consolidation
support confirmation
volume recovery
Then enter small.
My Overall View
Short term: Bullish but dangerous
Mid term: Depends on token utility/team
Risk level: Very high
Reward potential: Also high
This is the kind of coin that can:
either do another 2–5x
or lose 70% very quickly.
$ZEST
Daily move: +20%
Market Cap: ~$19.6M
FDV: ~$134M
Liquidity: ~$2.44M
Holders: ~2,005 only
Massive move from $0.02 → $0.20 in a very short time.
This usually means:
Very new token
Strong hype/FOMO phase
Extremely volatile
Smart money + traders already active
Important Signals
Bullish Signs
Strong first impulse candle
Price still holding above launch area
Volume initially very high
Not fully dumped after first pump
Liquidity decent for a new token
If momentum continues, next psychological zones can be:
0.15
0.18
Retest of 0.20
Risk Signals (Very Important)
This chart also shows dangerous characteristics:
1. FDV Too High Compared to Market Cap
MC: ~$19M
FDV: ~$134M
That means a huge amount of tokens may still unlock later.
This can create:
Heavy sell pressure
Sudden crashes
Whale manipulation
2. Very Low Holder Count
Only ~2,000 holders.
That means:
A few whales can move price heavily
Price can dump 30–60% quickly
3. Vertical Pump
This kind of candle:
Usually retraces hard
Needs consolidation before safer entry
Many traders buy the top because of excitement.
High Probability Scenarios
Scenario 1 — Bullish Continuation
If price:
Holds above 0.11–0.12
Volume returns strong
Breaks 0.15 cleanly
Then another push toward:
0.18–0.20 possible.
Scenario 2 — Healthy Pullback
Most realistic.
Price may revisit:
0.10
0.08
even 0.06
before deciding next move.
That would actually be healthier for long-term continuation.
Scenario 3 — Trap / Distribution
If whales start selling:
Price can crash back toward launch zone fast.
Especially because:
holder count small
liquidity not huge
early buyers already massively in profit
Safer Strategy Right Now
With small capital like your $5:
Avoid:
FOMO buying big green candles
High leverage futures here
Chasing after 500% moves
Better:
Wait for:
consolidation
support confirmation
volume recovery
Then enter small.
My Overall View
Short term: Bullish but dangerous
Mid term: Depends on token utility/team
Risk level: Very high
Reward potential: Also high
This is the kind of coin that can:
either do another 2–5x
or lose 70% very quickly.
$ZEST
476
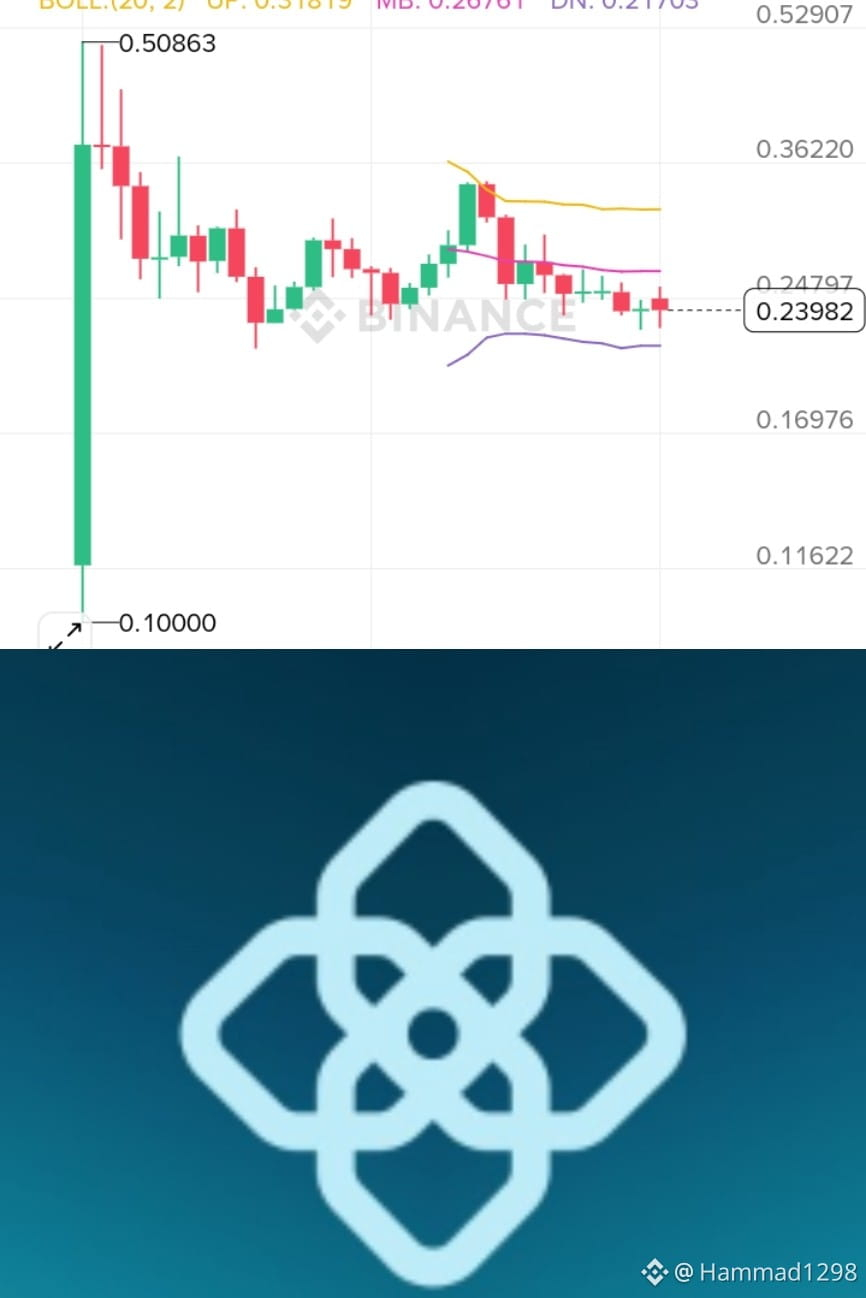
~CƏNUBİ BAZAR STRUKTURU :
Qiymət dumpdan sonra dəstəyin yaxınlığında sıxılır. Bu, deməkdir ki:
feyk breakouts ehtimalı var,
candlestickləri izləmək təhlükəlidir,
təsdiq girişləri proqnozdan daha önəmlidir.
Ən etibarlı Sniper Strategiyası (UZUN)
Giriş Zonası
Gözləyin:
0.258–0.262 üstündə bərpa olunma
güclü yaşıl candlestick və həcm ilə
Stop Loss
0.242
Hədəflər
TP1: 0.285
TP2: 0.318
TP3: 0.36+
Bu, təsadüfi likvidasiyadan qaçaraq daha sağlam bir reallıq RR təqdim edir.
Anti-Trap Qaydaları
Bu qaydalar siqnalın özündən daha vacibdir.
EDMƏYİN:
huge yaşıl candlesticklərdən sonra daxil olun
SL vurulduqdan sonra intiqam ticarəti edin
tam margin istifadə edin
meme/yeni coinlərdə orta alın
BTC-nin ani volatillik artımları zamanı ticarət edin
YALNIZ DAXİL OLUN:
resistansın üstündə candlestick bağlandıqda
həcm artdıqda
BTC sabit və ya bullish olduqda
spread/liquidity normal görünür.
Məni Dərhal Bullish Edəcək Nə
Əgər OPG:
0.30 üstündə güclü bağlanırsa
həcm partlayırsa
BTC bullish qalırsa
onda 0.40+ yönündə momentum davam etməsi mümkün olur.
İndiki zamanda hələ də “təsdiq gözləyin” chartıdır, kor-şəkildə giriş chartı deyil.
$OPG
{future}(OPGUSDT)
~CƏNUBİ BAZAR STRUKTURU :
Qiymət dumpdan sonra dəstəyin yaxınlığında sıxılır. Bu, deməkdir ki:
feyk breakouts ehtimalı var,
candlestickləri izləmək təhlükəlidir,
təsdiq girişləri proqnozdan daha önəmlidir.
Ən etibarlı Sniper Strategiyası (UZUN)
Giriş Zonası
Gözləyin:
0.258–0.262 üstündə bərpa olunma
güclü yaşıl candlestick və həcm ilə
Stop Loss
0.242
Hədəflər
TP1: 0.285
TP2: 0.318
TP3: 0.36+
Bu, təsadüfi likvidasiyadan qaçaraq daha sağlam bir reallıq RR təqdim edir.
Anti-Trap Qaydaları
Bu qaydalar siqnalın özündən daha vacibdir.
EDMƏYİN:
huge yaşıl candlesticklərdən sonra daxil olun
SL vurulduqdan sonra intiqam ticarəti edin
tam margin istifadə edin
meme/yeni coinlərdə orta alın
BTC-nin ani volatillik artımları zamanı ticarət edin
YALNIZ DAXİL OLUN:
resistansın üstündə candlestick bağlandıqda
həcm artdıqda
BTC sabit və ya bullish olduqda
spread/liquidity normal görünür.
Məni Dərhal Bullish Edəcək Nə
Əgər OPG:
0.30 üstündə güclü bağlanırsa
həcm partlayırsa
BTC bullish qalırsa
onda 0.40+ yönündə momentum davam etməsi mümkün olur.
İndiki zamanda hələ də “təsdiq gözləyin” chartıdır, kor-şəkildə giriş chartı deyil.
$OPG
Qiymət dumpdan sonra dəstəyin yaxınlığında sıxılır. Bu, deməkdir ki:
feyk breakouts ehtimalı var,
candlestickləri izləmək təhlükəlidir,
təsdiq girişləri proqnozdan daha önəmlidir.
Ən etibarlı Sniper Strategiyası (UZUN)
Giriş Zonası
Gözləyin:
0.258–0.262 üstündə bərpa olunma
güclü yaşıl candlestick və həcm ilə
Stop Loss
0.242
Hədəflər
TP1: 0.285
TP2: 0.318
TP3: 0.36+
Bu, təsadüfi likvidasiyadan qaçaraq daha sağlam bir reallıq RR təqdim edir.
Anti-Trap Qaydaları
Bu qaydalar siqnalın özündən daha vacibdir.
EDMƏYİN:
huge yaşıl candlesticklərdən sonra daxil olun
SL vurulduqdan sonra intiqam ticarəti edin
tam margin istifadə edin
meme/yeni coinlərdə orta alın
BTC-nin ani volatillik artımları zamanı ticarət edin
YALNIZ DAXİL OLUN:
resistansın üstündə candlestick bağlandıqda
həcm artdıqda
BTC sabit və ya bullish olduqda
spread/liquidity normal görünür.
Məni Dərhal Bullish Edəcək Nə
Əgər OPG:
0.30 üstündə güclü bağlanırsa
həcm partlayırsa
BTC bullish qalırsa
onda 0.40+ yönündə momentum davam etməsi mümkün olur.
İndiki zamanda hələ də “təsdiq gözləyin” chartıdır, kor-şəkildə giriş chartı deyil.
$OPG
258
Tərcüməyə bax
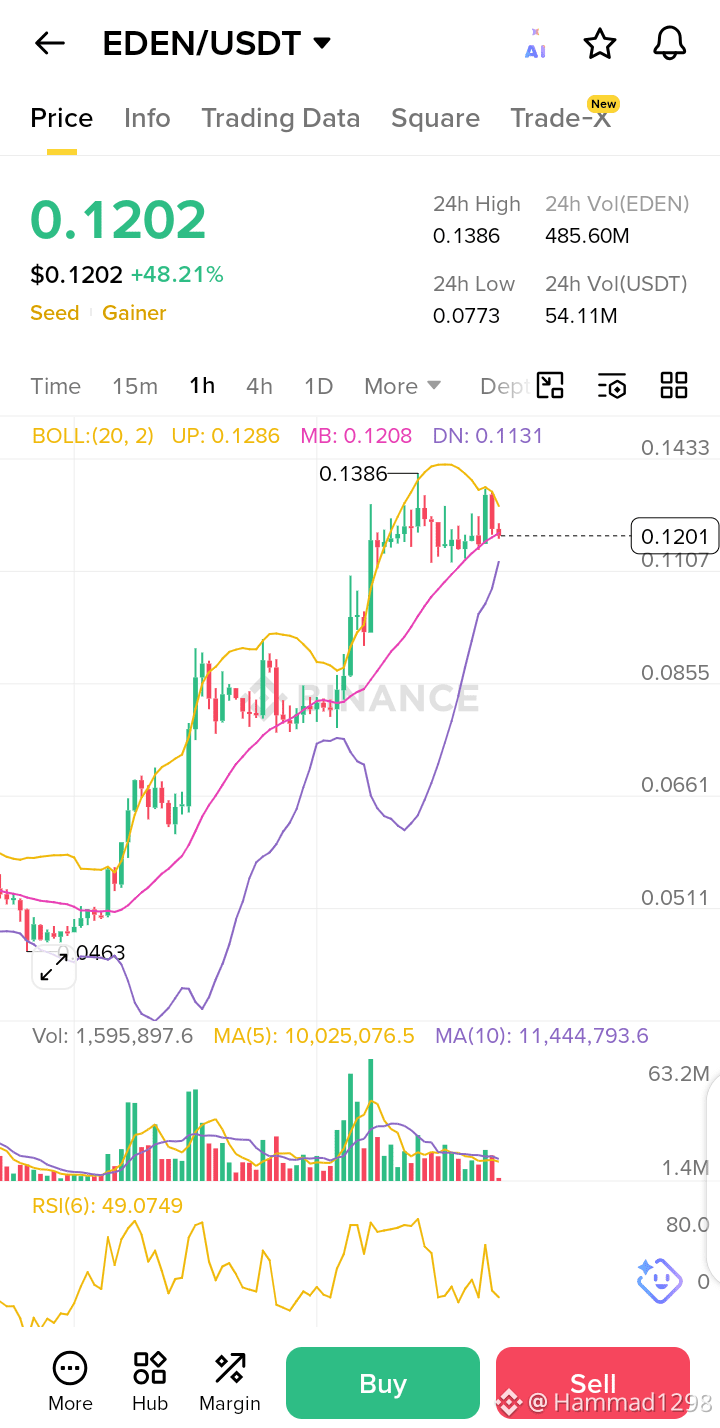
For EDEN, a real bullish confirmation is not just “price going up.”
You want confirmation from structure + volume + candle close.
Main confirmations I’d watch:
1.Hold above $0.10 psychologically
If price keeps rejecting below $0.10 → weak.
If it retests and holds → bullish continuation sign.
2.Higher highs + higher lows on 1H / 4H
Strong trend structure.
No deep liquidation candles.
3.Break resistance with volume
Thin breakout = trap risk.
Explosive volume during breakout = stronger confirmation. �
Crypto Breakout Scanner +1
4.Successful retest This is the biggest one. Example:
Breaks $0.12
Pulls back
Holds $0.12
Then pushes higher again
That’s usually stronger than one random green candle.
5.BTC stability matters If Bitcoin dumps suddenly, low-cap alts like EDEN can collapse fast even if their chart looks bullish. �
TrendXBit +1
Right now EDEN looks:
momentum bullish,
but also overheated short term.
The strongest bullish confirmation for me would be:
consolidation above $0.10,
then clean breakout above recent local high with strong volume.
Danger signs:
huge wick rejections,
volume dying,
fast drop back below breakout zone,
BTC weakness,
or sudden 20% candles down.
$EDEN
{future}(EDENUSDT)
For EDEN, a real bullish confirmation is not just “price going up.”
You want confirmation from structure + volume + candle close.
Main confirmations I’d watch:
1.Hold above $0.10 psychologically
If price keeps rejecting below $0.10 → weak.
If it retests and holds → bullish continuation sign.
2.Higher highs + higher lows on 1H / 4H
Strong trend structure.
No deep liquidation candles.
3.Break resistance with volume
Thin breakout = trap risk.
Explosive volume during breakout = stronger confirmation. �
Crypto Breakout Scanner +1
4.Successful retest This is the biggest one. Example:
Breaks $0.12
Pulls back
Holds $0.12
Then pushes higher again
That’s usually stronger than one random green candle.
5.BTC stability matters If Bitcoin dumps suddenly, low-cap alts like EDEN can collapse fast even if their chart looks bullish. �
TrendXBit +1
Right now EDEN looks:
momentum bullish,
but also overheated short term.
The strongest bullish confirmation for me would be:
consolidation above $0.10,
then clean breakout above recent local high with strong volume.
Danger signs:
huge wick rejections,
volume dying,
fast drop back below breakout zone,
BTC weakness,
or sudden 20% candles down.
$EDEN
You want confirmation from structure + volume + candle close.
Main confirmations I’d watch:
1.Hold above $0.10 psychologically
If price keeps rejecting below $0.10 → weak.
If it retests and holds → bullish continuation sign.
2.Higher highs + higher lows on 1H / 4H
Strong trend structure.
No deep liquidation candles.
3.Break resistance with volume
Thin breakout = trap risk.
Explosive volume during breakout = stronger confirmation. �
Crypto Breakout Scanner +1
4.Successful retest This is the biggest one. Example:
Breaks $0.12
Pulls back
Holds $0.12
Then pushes higher again
That’s usually stronger than one random green candle.
5.BTC stability matters If Bitcoin dumps suddenly, low-cap alts like EDEN can collapse fast even if their chart looks bullish. �
TrendXBit +1
Right now EDEN looks:
momentum bullish,
but also overheated short term.
The strongest bullish confirmation for me would be:
consolidation above $0.10,
then clean breakout above recent local high with strong volume.
Danger signs:
huge wick rejections,
volume dying,
fast drop back below breakout zone,
BTC weakness,
or sudden 20% candles down.
$EDEN
215

Məqalə
ABŞ Fondları və Texnologiya Nəhəngləri: Möhtəşəm 7 Bir ÇarpazdaHansı Şirkət Gerçək Bir Stalvardır — və Hansı Tamamilə Hype İlə İrəliləyir?
“Möhtəşəm 7” — Apple, Microsoft, Nvidia, Amazon, Alphabet, Meta və Tesla — müasir fond bazarının bel sütununa çevrilmişdir. Birlikdə, trilyonlarla bazar dəyərinə sahibdirlər, qlobal innovasiyanı idarə edirlər və S&P 500 və Nasdaq-ın istiqamətini ciddi şəkildə təsir edirlər.
Amma 2026-cı ildə böyük bir dəyişiklik görünməyə başlayır.
Bu nəhənglər artıq bir yerdə hərəkət etmir.
Bəzi şirkətlər, pul axını, innovasiya və iş gücü ilə böyük dəyərlərini doğrulamağa çalışır. Digərləri isə daha çox hekayə, spekulyasiya və bazar həyəcanı ilə istiqamətlənirlər, stabil əsaslardan daha çox.
ABŞ Fondları və Texnologiya Nəhəngləri: Möhtəşəm 7 Bir Çarpazda
Hansı Şirkət Gerçək Bir Stalvardır — və Hansı Tamamilə Hype İlə İrəliləyir?
“Möhtəşəm 7” — Apple, Microsoft, Nvidia, Amazon, Alphabet, Meta və Tesla — müasir fond bazarının bel sütununa çevrilmişdir. Birlikdə, trilyonlarla bazar dəyərinə sahibdirlər, qlobal innovasiyanı idarə edirlər və S&P 500 və Nasdaq-ın istiqamətini ciddi şəkildə təsir edirlər.
Amma 2026-cı ildə böyük bir dəyişiklik görünməyə başlayır.
Bu nəhənglər artıq bir yerdə hərəkət etmir.
Bəzi şirkətlər, pul axını, innovasiya və iş gücü ilə böyük dəyərlərini doğrulamağa çalışır. Digərləri isə daha çox hekayə, spekulyasiya və bazar həyəcanı ilə istiqamətlənirlər, stabil əsaslardan daha çox.
“Möhtəşəm 7” — Apple, Microsoft, Nvidia, Amazon, Alphabet, Meta və Tesla — müasir fond bazarının bel sütununa çevrilmişdir. Birlikdə, trilyonlarla bazar dəyərinə sahibdirlər, qlobal innovasiyanı idarə edirlər və S&P 500 və Nasdaq-ın istiqamətini ciddi şəkildə təsir edirlər.
Amma 2026-cı ildə böyük bir dəyişiklik görünməyə başlayır.
Bu nəhənglər artıq bir yerdə hərəkət etmir.
Bəzi şirkətlər, pul axını, innovasiya və iş gücü ilə böyük dəyərlərini doğrulamağa çalışır. Digərləri isə daha çox hekayə, spekulyasiya və bazar həyəcanı ilə istiqamətlənirlər, stabil əsaslardan daha çox.
150

Məqalə
Tərcüməyə bax
The Rise of Traditional Finance in the Digital Era: Gold, Oil, and Tech Giants in FocusFor decades, traditional finance (TradFi) has been the backbone of the global economy. From gold reserves and crude oil trade to the dominance of US tech giants, every major financial cycle has shaped how people invest, save, and build wealth. Today, the world stands at a unique turning point where traditional markets and digital assets are interacting more closely than ever before. #For decades, traditional finance (TradFi) has been the backbone of the global economy. From gold reserves and crude oil trade to the dominance of US tech giants, every major financial cycle has shaped how people invest, save, and build wealth. Today, the world stands at a unique turning point where traditional markets and digital assets are interacting more closely than ever before. #PostonTradFi
The birth of modern financial markets began with stock exchanges and commodity trading centuries ago. Gold became a symbol of stability and protection during economic uncertainty, while crude oil emerged as the fuel powering industries and global growth. In recent decades, US technology companies such as Apple, Microsoft, Nvidia, Amazon, and Google transformed the stock market into a technology-driven powerhouse. Their innovation changed communication, artificial intelligence, cloud computing, and even financial systems themselves.
Currently, markets are experiencing strong volatility due to inflation concerns, interest rate policies, geopolitical tensions, and global elections. Gold recently pulled back after reaching major highs, but many investors still view it as a long-term safe haven during uncertain political and economic conditions. Oil prices remain heavily influenced by conflicts in the Middle East, OPEC production decisions, and global demand from developing economies.
At the same time, the “Magnificent 7” tech stocks continue attracting massive capital. Some investors consider Nvidia and Microsoft the strongest long-term players because of AI growth and enterprise technology dominance. Others believe certain tech valuations are becoming overheated due to market hype and speculative buying.
Politically, financial markets are deeply connected with global decisions. US-China trade tensions, sanctions, war-related supply disruptions, and central bank policies all directly impact stocks, gold, and commodities. A single statement from the Federal Reserve can move billions of dollars across markets within minutes.
Looking ahead, TradFi markets may continue evolving alongside crypto and blockchain technology rather than competing against them. Investors today are no longer choosing only between stocks or crypto; many are diversifying across both sectors to balance stability and growth opportunities.
In my view, understanding the relationship between politics, technology, commodities, and investor psychology is now more important than simply following trends. Markets reward patience, research, and risk management far more than emotional decisions. #PostonTradFi
$XAU
{future}(XAUUSDT)
$NVDA
{future}(NVDAUSDT)
The Rise of Traditional Finance in the Digital Era: Gold, Oil, and Tech Giants in Focus
For decades, traditional finance (TradFi) has been the backbone of the global economy. From gold reserves and crude oil trade to the dominance of US tech giants, every major financial cycle has shaped how people invest, save, and build wealth. Today, the world stands at a unique turning point where traditional markets and digital assets are interacting more closely than ever before. #For decades, traditional finance (TradFi) has been the backbone of the global economy. From gold reserves and crude oil trade to the dominance of US tech giants, every major financial cycle has shaped how people invest, save, and build wealth. Today, the world stands at a unique turning point where traditional markets and digital assets are interacting more closely than ever before. #PostonTradFi
The birth of modern financial markets began with stock exchanges and commodity trading centuries ago. Gold became a symbol of stability and protection during economic uncertainty, while crude oil emerged as the fuel powering industries and global growth. In recent decades, US technology companies such as Apple, Microsoft, Nvidia, Amazon, and Google transformed the stock market into a technology-driven powerhouse. Their innovation changed communication, artificial intelligence, cloud computing, and even financial systems themselves.
Currently, markets are experiencing strong volatility due to inflation concerns, interest rate policies, geopolitical tensions, and global elections. Gold recently pulled back after reaching major highs, but many investors still view it as a long-term safe haven during uncertain political and economic conditions. Oil prices remain heavily influenced by conflicts in the Middle East, OPEC production decisions, and global demand from developing economies.
At the same time, the “Magnificent 7” tech stocks continue attracting massive capital. Some investors consider Nvidia and Microsoft the strongest long-term players because of AI growth and enterprise technology dominance. Others believe certain tech valuations are becoming overheated due to market hype and speculative buying.
Politically, financial markets are deeply connected with global decisions. US-China trade tensions, sanctions, war-related supply disruptions, and central bank policies all directly impact stocks, gold, and commodities. A single statement from the Federal Reserve can move billions of dollars across markets within minutes.
Looking ahead, TradFi markets may continue evolving alongside crypto and blockchain technology rather than competing against them. Investors today are no longer choosing only between stocks or crypto; many are diversifying across both sectors to balance stability and growth opportunities.
In my view, understanding the relationship between politics, technology, commodities, and investor psychology is now more important than simply following trends. Markets reward patience, research, and risk management far more than emotional decisions. #PostonTradFi
$XAU
$NVDA
The birth of modern financial markets began with stock exchanges and commodity trading centuries ago. Gold became a symbol of stability and protection during economic uncertainty, while crude oil emerged as the fuel powering industries and global growth. In recent decades, US technology companies such as Apple, Microsoft, Nvidia, Amazon, and Google transformed the stock market into a technology-driven powerhouse. Their innovation changed communication, artificial intelligence, cloud computing, and even financial systems themselves.
Currently, markets are experiencing strong volatility due to inflation concerns, interest rate policies, geopolitical tensions, and global elections. Gold recently pulled back after reaching major highs, but many investors still view it as a long-term safe haven during uncertain political and economic conditions. Oil prices remain heavily influenced by conflicts in the Middle East, OPEC production decisions, and global demand from developing economies.
At the same time, the “Magnificent 7” tech stocks continue attracting massive capital. Some investors consider Nvidia and Microsoft the strongest long-term players because of AI growth and enterprise technology dominance. Others believe certain tech valuations are becoming overheated due to market hype and speculative buying.
Politically, financial markets are deeply connected with global decisions. US-China trade tensions, sanctions, war-related supply disruptions, and central bank policies all directly impact stocks, gold, and commodities. A single statement from the Federal Reserve can move billions of dollars across markets within minutes.
Looking ahead, TradFi markets may continue evolving alongside crypto and blockchain technology rather than competing against them. Investors today are no longer choosing only between stocks or crypto; many are diversifying across both sectors to balance stability and growth opportunities.
In my view, understanding the relationship between politics, technology, commodities, and investor psychology is now more important than simply following trends. Markets reward patience, research, and risk management far more than emotional decisions. #PostonTradFi
$XAU
$NVDA
195

Məqalə
Tərcüməyə bax
Bitcoin Market Update (May 2026): Is BTC Preparing for Its Next Big Move?Bitcoin is once again dominating the crypto market, and investors around the world are closely watching its next move.
After months of volatility, BTC is currently trading around the $79K–$81K zone, showing strong resilience despite inflation concerns, global uncertainty, and market pressure.
So what is really happening in the Bitcoin market right now?
Why Bitcoin Is Still Strong ?
Even during recent pullbacks, Bitcoin has managed to hold important support levels.
One major reason is institutional demand.
Large investors and spot Bitcoin ETFs continue accumulating BTC, helping maintain strong market confidence. Bitcoin dominance in the crypto market also remains high, showing that investors still trust BTC more than most altcoins.
The Most Important Levels Right Now
Traders are currently focused on these key price zones:
- Strong support: $75K–$80K
- Major resistance: $84K–$85K
- Bullish breakout zone: Above $85K
- Risk zone: Below $72K
Analysts believe that if Bitcoin successfully breaks above the $84K–$85K resistance area, the market could enter another strong bullish phase.
However, if BTC loses major support levels, short-term corrections may occur before the next upward move.
Why The Market Is Volatile ?
Several global factors are affecting Bitcoin right now:
- U.S. inflation data
- Interest rate expectations
- Rising oil prices
- Geopolitical tensions
- Global liquidity conditions
These factors are creating uncertainty across financial markets, including crypto.
That is why Bitcoin is experiencing rapid price swings even while maintaining its long-term bullish structure.
Bitcoin Dominance Is Rising
Another important signal is BTC dominance.
Bitcoin currently controls a large share of the total crypto market capitalization, showing that investors are moving toward safer crypto assets instead of taking excessive risks in smaller altcoins.
Historically, strong BTC dominance often indicates that Bitcoin is leading the market direction.
What Smart Investors Are Doing ?
Many experienced investors are:
- Accumulating gradually
- Avoiding emotional trading
- Holding long term
- Watching key support levels carefully
- Managing risk instead of chasing hype
The market still remains highly volatile, but long-term confidence in Bitcoin has not disappeared.
Final Thoughts
Bitcoin in May 2026 remains in a very important phase.
The market is showing both caution and strength at the same time.
If BTC maintains support above the current range and breaks key resistance zones, another major bullish move could begin. But if macroeconomic pressure increases, temporary corrections are still possible.
For now, patience, discipline, and proper risk management remain the most important strategies in crypto.
The next few weeks could decide Bitcoin’s direction for the rest of 2026.
$BTC
{spot}(BTCUSDT)
Bitcoin Market Update (May 2026): Is BTC Preparing for Its Next Big Move?
Bitcoin is once again dominating the crypto market, and investors around the world are closely watching its next move.
After months of volatility, BTC is currently trading around the $79K–$81K zone, showing strong resilience despite inflation concerns, global uncertainty, and market pressure.
So what is really happening in the Bitcoin market right now?
Why Bitcoin Is Still Strong ?
Even during recent pullbacks, Bitcoin has managed to hold important support levels.
One major reason is institutional demand.
Large investors and spot Bitcoin ETFs continue accumulating BTC, helping maintain strong market confidence. Bitcoin dominance in the crypto market also remains high, showing that investors still trust BTC more than most altcoins.
The Most Important Levels Right Now
Traders are currently focused on these key price zones:
- Strong support: $75K–$80K
- Major resistance: $84K–$85K
- Bullish breakout zone: Above $85K
- Risk zone: Below $72K
Analysts believe that if Bitcoin successfully breaks above the $84K–$85K resistance area, the market could enter another strong bullish phase.
However, if BTC loses major support levels, short-term corrections may occur before the next upward move.
Why The Market Is Volatile ?
Several global factors are affecting Bitcoin right now:
- U.S. inflation data
- Interest rate expectations
- Rising oil prices
- Geopolitical tensions
- Global liquidity conditions
These factors are creating uncertainty across financial markets, including crypto.
That is why Bitcoin is experiencing rapid price swings even while maintaining its long-term bullish structure.
Bitcoin Dominance Is Rising
Another important signal is BTC dominance.
Bitcoin currently controls a large share of the total crypto market capitalization, showing that investors are moving toward safer crypto assets instead of taking excessive risks in smaller altcoins.
Historically, strong BTC dominance often indicates that Bitcoin is leading the market direction.
What Smart Investors Are Doing ?
Many experienced investors are:
- Accumulating gradually
- Avoiding emotional trading
- Holding long term
- Watching key support levels carefully
- Managing risk instead of chasing hype
The market still remains highly volatile, but long-term confidence in Bitcoin has not disappeared.
Final Thoughts
Bitcoin in May 2026 remains in a very important phase.
The market is showing both caution and strength at the same time.
If BTC maintains support above the current range and breaks key resistance zones, another major bullish move could begin. But if macroeconomic pressure increases, temporary corrections are still possible.
For now, patience, discipline, and proper risk management remain the most important strategies in crypto.
The next few weeks could decide Bitcoin’s direction for the rest of 2026.
$BTC
After months of volatility, BTC is currently trading around the $79K–$81K zone, showing strong resilience despite inflation concerns, global uncertainty, and market pressure.
So what is really happening in the Bitcoin market right now?
Why Bitcoin Is Still Strong ?
Even during recent pullbacks, Bitcoin has managed to hold important support levels.
One major reason is institutional demand.
Large investors and spot Bitcoin ETFs continue accumulating BTC, helping maintain strong market confidence. Bitcoin dominance in the crypto market also remains high, showing that investors still trust BTC more than most altcoins.
The Most Important Levels Right Now
Traders are currently focused on these key price zones:
- Strong support: $75K–$80K
- Major resistance: $84K–$85K
- Bullish breakout zone: Above $85K
- Risk zone: Below $72K
Analysts believe that if Bitcoin successfully breaks above the $84K–$85K resistance area, the market could enter another strong bullish phase.
However, if BTC loses major support levels, short-term corrections may occur before the next upward move.
Why The Market Is Volatile ?
Several global factors are affecting Bitcoin right now:
- U.S. inflation data
- Interest rate expectations
- Rising oil prices
- Geopolitical tensions
- Global liquidity conditions
These factors are creating uncertainty across financial markets, including crypto.
That is why Bitcoin is experiencing rapid price swings even while maintaining its long-term bullish structure.
Bitcoin Dominance Is Rising
Another important signal is BTC dominance.
Bitcoin currently controls a large share of the total crypto market capitalization, showing that investors are moving toward safer crypto assets instead of taking excessive risks in smaller altcoins.
Historically, strong BTC dominance often indicates that Bitcoin is leading the market direction.
What Smart Investors Are Doing ?
Many experienced investors are:
- Accumulating gradually
- Avoiding emotional trading
- Holding long term
- Watching key support levels carefully
- Managing risk instead of chasing hype
The market still remains highly volatile, but long-term confidence in Bitcoin has not disappeared.
Final Thoughts
Bitcoin in May 2026 remains in a very important phase.
The market is showing both caution and strength at the same time.
If BTC maintains support above the current range and breaks key resistance zones, another major bullish move could begin. But if macroeconomic pressure increases, temporary corrections are still possible.
For now, patience, discipline, and proper risk management remain the most important strategies in crypto.
The next few weeks could decide Bitcoin’s direction for the rest of 2026.
$BTC
131
Məqalə
Tərcüməyə bax
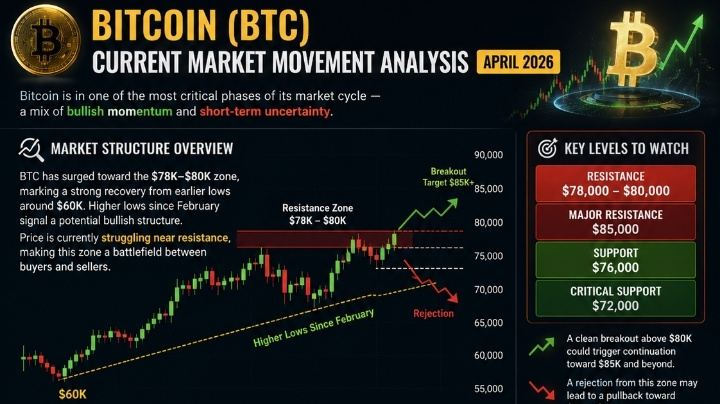
📊 Bitcoin (BTC) Current Market Movement Analysis – April 2026Bitcoin is currently in one of the most critical phases of its market cycle — a mix of bullish momentum and short-term uncertainty.
🔍 Market Structure Overview
BTC has recently surged toward the $78K–$80K zone, marking a strong recovery from earlier lows around $60K. This move is supported by a shift in trend, with higher lows forming since February, signaling a potential bullish structure forming. �
MarketWatch
At the same time, price is struggling near resistance, which makes this zone a battlefield between buyers and sellers.
⚖️ Key Levels to Watch
Resistance: $78,000 – $80,000
Major Resistance: $85,000
Support: $76,000
Critical Support: $72,000
This range is extremely important because:
A clean breakout above $80K could trigger continuation toward $85K and beyond.
A rejection from this zone may lead to a pullback toward $72K–$76K. �
Binance
📈 What’s Driving the Market?
1. Institutional Buying Power
Large-scale buying and ETF inflows are pushing demand higher, strengthening bullish sentiment. �
Investors
2. Macro Factors (Global Events)
Improved geopolitical conditions (like easing tensions globally) are increasing risk appetite, benefiting crypto markets. �
Barron's
3. Liquidity & Short Squeeze Potential
Massive short positions in the market mean that a breakout can trigger liquidation cascades, accelerating price upward. �
Finance Magnates
⚠️ Hidden Risk (Most Traders Ignore)
Despite bullish momentum, indicators show:
Overbought conditions
Weakening momentum in some timeframes
Strong psychological resistance near $80K
This suggests the market may cool down before the next big move. �
MEXC
🧠 Smart Trader Insight
Right now, BTC is not about guessing direction — it’s about reacting to confirmation.
Breakout traders → wait for strong close above resistance
Rejection traders → look for clear rejection signals at resistance
No setup → no trade
📌 Final Verdict
Bitcoin is in a compression phase near resistance, where:
Breakout = continuation rally
Rejection = healthy correction
The next move will likely be fast and volatile, so patience and discipline are key.
💡 Simple Truth:
In this market, the winners are not the ones who predict…
They are the ones who wait and execute at the right moment.
$BTC
{future}(BTCUSDT)
📊 Bitcoin (BTC) Current Market Movement Analysis – April 2026
Bitcoin is currently in one of the most critical phases of its market cycle — a mix of bullish momentum and short-term uncertainty.
🔍 Market Structure Overview
BTC has recently surged toward the $78K–$80K zone, marking a strong recovery from earlier lows around $60K. This move is supported by a shift in trend, with higher lows forming since February, signaling a potential bullish structure forming. �
MarketWatch
At the same time, price is struggling near resistance, which makes this zone a battlefield between buyers and sellers.
⚖️ Key Levels to Watch
Resistance: $78,000 – $80,000
Major Resistance: $85,000
Support: $76,000
Critical Support: $72,000
This range is extremely important because:
A clean breakout above $80K could trigger continuation toward $85K and beyond.
A rejection from this zone may lead to a pullback toward $72K–$76K. �
Binance
📈 What’s Driving the Market?
1. Institutional Buying Power
Large-scale buying and ETF inflows are pushing demand higher, strengthening bullish sentiment. �
Investors
2. Macro Factors (Global Events)
Improved geopolitical conditions (like easing tensions globally) are increasing risk appetite, benefiting crypto markets. �
Barron's
3. Liquidity & Short Squeeze Potential
Massive short positions in the market mean that a breakout can trigger liquidation cascades, accelerating price upward. �
Finance Magnates
⚠️ Hidden Risk (Most Traders Ignore)
Despite bullish momentum, indicators show:
Overbought conditions
Weakening momentum in some timeframes
Strong psychological resistance near $80K
This suggests the market may cool down before the next big move. �
MEXC
🧠 Smart Trader Insight
Right now, BTC is not about guessing direction — it’s about reacting to confirmation.
Breakout traders → wait for strong close above resistance
Rejection traders → look for clear rejection signals at resistance
No setup → no trade
📌 Final Verdict
Bitcoin is in a compression phase near resistance, where:
Breakout = continuation rally
Rejection = healthy correction
The next move will likely be fast and volatile, so patience and discipline are key.
💡 Simple Truth:
In this market, the winners are not the ones who predict…
They are the ones who wait and execute at the right moment.
$BTC
🔍 Market Structure Overview
BTC has recently surged toward the $78K–$80K zone, marking a strong recovery from earlier lows around $60K. This move is supported by a shift in trend, with higher lows forming since February, signaling a potential bullish structure forming. �
MarketWatch
At the same time, price is struggling near resistance, which makes this zone a battlefield between buyers and sellers.
⚖️ Key Levels to Watch
Resistance: $78,000 – $80,000
Major Resistance: $85,000
Support: $76,000
Critical Support: $72,000
This range is extremely important because:
A clean breakout above $80K could trigger continuation toward $85K and beyond.
A rejection from this zone may lead to a pullback toward $72K–$76K. �
Binance
📈 What’s Driving the Market?
1. Institutional Buying Power
Large-scale buying and ETF inflows are pushing demand higher, strengthening bullish sentiment. �
Investors
2. Macro Factors (Global Events)
Improved geopolitical conditions (like easing tensions globally) are increasing risk appetite, benefiting crypto markets. �
Barron's
3. Liquidity & Short Squeeze Potential
Massive short positions in the market mean that a breakout can trigger liquidation cascades, accelerating price upward. �
Finance Magnates
⚠️ Hidden Risk (Most Traders Ignore)
Despite bullish momentum, indicators show:
Overbought conditions
Weakening momentum in some timeframes
Strong psychological resistance near $80K
This suggests the market may cool down before the next big move. �
MEXC
🧠 Smart Trader Insight
Right now, BTC is not about guessing direction — it’s about reacting to confirmation.
Breakout traders → wait for strong close above resistance
Rejection traders → look for clear rejection signals at resistance
No setup → no trade
📌 Final Verdict
Bitcoin is in a compression phase near resistance, where:
Breakout = continuation rally
Rejection = healthy correction
The next move will likely be fast and volatile, so patience and discipline are key.
💡 Simple Truth:
In this market, the winners are not the ones who predict…
They are the ones who wait and execute at the right moment.
$BTC
86
Tərcüməyə bax
BTC isn’t just a coin… it’s a test of patience.
Most people lose not because of the market — but because they can’t stay still.
They chase pumps.
They panic on dips.
They ignore structure.
📌 Tip:
Wait for clear rejection or breakout. No setup = no trade.
Discipline beats prediction every time.
The market rewards patience, not emotions.
#BTC #Trading #Discipline #CryptoPatience
$BTC
{future}(BTCUSDT)
BTC isn’t just a coin… it’s a test of patience.
Most people lose not because of the market — but because they can’t stay still.
They chase pumps.
They panic on dips.
They ignore structure.
📌 Tip:
Wait for clear rejection or breakout. No setup = no trade.
Discipline beats prediction every time.
The market rewards patience, not emotions.
#BTC #Trading #Discipline #CryptoPatience
$BTC
Most people lose not because of the market — but because they can’t stay still.
They chase pumps.
They panic on dips.
They ignore structure.
📌 Tip:
Wait for clear rejection or breakout. No setup = no trade.
Discipline beats prediction every time.
The market rewards patience, not emotions.
#BTC #Trading #Discipline #CryptoPatience
$BTC
96

Məqalə
$ROBO və Fabric Foundation arxasındakı vizyonu araşdırmaqTez inkişaf edən kripto sahəsində, yeni layihələr istifadəçilərin mərkəzləşdirilməmiş texnologiyalarla necə qarşılıqlı əlaqədə olduğunu yaxşılaşdırmaq yollarını araşdırmağa davam edir. Yaxın zamanda diqqətimi çəkən bir layihə @FabricFND tərəfindən rəhbərlik edilən təşəbbüsdür. Fabric Foundation arxasındakı komandaya daha effektiv və genişlənə bilən Web3 ekosistemini dəstəkləyə biləcək infrastruktur qurmağa fokuslandığı görünür.
Bu ekosistemin əsas elementlərindən biri $ROBO-dur. Sadəcə başqa bir token buraxılışı olmaqdan çox, $ROBO daha geniş bir viziyanın bir hissəsi olaraq hazırlanmış kimi görünür, burada avtomatlaşdırma və ağıllı blockchain alətləri mürəkkəb on-chain proseslərini sadələşdirə bilər. İnkişaf bu istiqamətdə davam edərsə, token istifadəçiləri mərkəzləşdirilməmiş xidmətlərlə daha rahat bir şəkildə əlaqələndirməkdə mühüm rol oynaya bilər.
$ROBO və Fabric Foundation arxasındakı vizyonu araşdırmaq
Tez inkişaf edən kripto sahəsində, yeni layihələr istifadəçilərin mərkəzləşdirilməmiş texnologiyalarla necə qarşılıqlı əlaqədə olduğunu yaxşılaşdırmaq yollarını araşdırmağa davam edir. Yaxın zamanda diqqətimi çəkən bir layihə @Fabric Foundation tərəfindən rəhbərlik edilən təşəbbüsdür. Fabric Foundation arxasındakı komandaya daha effektiv və genişlənə bilən Web3 ekosistemini dəstəkləyə biləcək infrastruktur qurmağa fokuslandığı görünür.
Bu ekosistemin əsas elementlərindən biri $ROBO -dur. Sadəcə başqa bir token buraxılışı olmaqdan çox, $ROBO daha geniş bir viziyanın bir hissəsi olaraq hazırlanmış kimi görünür, burada avtomatlaşdırma və ağıllı blockchain alətləri mürəkkəb on-chain proseslərini sadələşdirə bilər. İnkişaf bu istiqamətdə davam edərsə, token istifadəçiləri mərkəzləşdirilməmiş xidmətlərlə daha rahat bir şəkildə əlaqələndirməkdə mühüm rol oynaya bilər.
Bu ekosistemin əsas elementlərindən biri $ROBO -dur. Sadəcə başqa bir token buraxılışı olmaqdan çox, $ROBO daha geniş bir viziyanın bir hissəsi olaraq hazırlanmış kimi görünür, burada avtomatlaşdırma və ağıllı blockchain alətləri mürəkkəb on-chain proseslərini sadələşdirə bilər. İnkişaf bu istiqamətdə davam edərsə, token istifadəçiləri mərkəzləşdirilməmiş xidmətlərlə daha rahat bir şəkildə əlaqələndirməkdə mühüm rol oynaya bilər.
73
#robo $ROBO
Niyə ROBO Mənim Diqqətimi Cəlb Etdi
ROBO-nun təqdimatı yaxınlarda mənim diqqətimi cəlb etdi, çünki kripto bazarı avtomatlaşdırmaya və daha ağıllı on-chain alətlərə doğru irəliləyir. Blokçeyn ilə avtomatlaşdırmanı birləşdirən layihələr, istifadəçilərin DeFi və rəqəmsal aktivlərlə daha səmərəli şəkildə əlaqə qurma yollarını axtardığı üçün getdikcə daha aktual hala gəlir.
ROBO-nun maraqlı cəhəti, mürəkkəb blokçeyn proseslərini sadələşdirmək ətrafındakı hekayədir. Layihə müvəffəqiyyətlə istifadəçilərə strategiyaları avtomatlaşdırmağa və ya səmərəliliyi artırmağa kömək edən alətlər təqdim etsə, bu, sadə spekulasyondan kənarda real dəyər yarada bilər.
İzlədiyim digər bir amil, erkən mərhələ inkişaf potensialıdır. Bir çox uğurlu kripto layihəsi səssizcə başlayıb, lakin icma və ekosistem genişlənməyə başladıqdan sonra populyarlıq qazandı. ROBO üçün növbəti əsas göstəricilər inkişaf irəliləyişi, icma iştirakçılığı və zamanla necə likvidliyin böyüdüyü olacaq.
Əlbəttə ki, hər yeni təqdimat risk daşıyır və hər hansı bir sərmayə qərarı vermədən öncə öz araşdırmanızı aparmaq həmişə vacibdir. Lakin innovasiya kripto dünyasını irəlilədən amildir və ROBO kimi layihələr, ekosistemin daima inkişafda olduğunu xatırladır.
$ROBO
{future}(ROBOUSDT)
#robo $ROBO
Niyə ROBO Mənim Diqqətimi Cəlb Etdi
ROBO-nun təqdimatı yaxınlarda mənim diqqətimi cəlb etdi, çünki kripto bazarı avtomatlaşdırmaya və daha ağıllı on-chain alətlərə doğru irəliləyir. Blokçeyn ilə avtomatlaşdırmanı birləşdirən layihələr, istifadəçilərin DeFi və rəqəmsal aktivlərlə daha səmərəli şəkildə əlaqə qurma yollarını axtardığı üçün getdikcə daha aktual hala gəlir.
ROBO-nun maraqlı cəhəti, mürəkkəb blokçeyn proseslərini sadələşdirmək ətrafındakı hekayədir. Layihə müvəffəqiyyətlə istifadəçilərə strategiyaları avtomatlaşdırmağa və ya səmərəliliyi artırmağa kömək edən alətlər təqdim etsə, bu, sadə spekulasyondan kənarda real dəyər yarada bilər.
İzlədiyim digər bir amil, erkən mərhələ inkişaf potensialıdır. Bir çox uğurlu kripto layihəsi səssizcə başlayıb, lakin icma və ekosistem genişlənməyə başladıqdan sonra populyarlıq qazandı. ROBO üçün növbəti əsas göstəricilər inkişaf irəliləyişi, icma iştirakçılığı və zamanla necə likvidliyin böyüdüyü olacaq.
Əlbəttə ki, hər yeni təqdimat risk daşıyır və hər hansı bir sərmayə qərarı vermədən öncə öz araşdırmanızı aparmaq həmişə vacibdir. Lakin innovasiya kripto dünyasını irəlilədən amildir və ROBO kimi layihələr, ekosistemin daima inkişafda olduğunu xatırladır.
$ROBO
Niyə ROBO Mənim Diqqətimi Cəlb Etdi
ROBO-nun təqdimatı yaxınlarda mənim diqqətimi cəlb etdi, çünki kripto bazarı avtomatlaşdırmaya və daha ağıllı on-chain alətlərə doğru irəliləyir. Blokçeyn ilə avtomatlaşdırmanı birləşdirən layihələr, istifadəçilərin DeFi və rəqəmsal aktivlərlə daha səmərəli şəkildə əlaqə qurma yollarını axtardığı üçün getdikcə daha aktual hala gəlir.
ROBO-nun maraqlı cəhəti, mürəkkəb blokçeyn proseslərini sadələşdirmək ətrafındakı hekayədir. Layihə müvəffəqiyyətlə istifadəçilərə strategiyaları avtomatlaşdırmağa və ya səmərəliliyi artırmağa kömək edən alətlər təqdim etsə, bu, sadə spekulasyondan kənarda real dəyər yarada bilər.
İzlədiyim digər bir amil, erkən mərhələ inkişaf potensialıdır. Bir çox uğurlu kripto layihəsi səssizcə başlayıb, lakin icma və ekosistem genişlənməyə başladıqdan sonra populyarlıq qazandı. ROBO üçün növbəti əsas göstəricilər inkişaf irəliləyişi, icma iştirakçılığı və zamanla necə likvidliyin böyüdüyü olacaq.
Əlbəttə ki, hər yeni təqdimat risk daşıyır və hər hansı bir sərmayə qərarı vermədən öncə öz araşdırmanızı aparmaq həmişə vacibdir. Lakin innovasiya kripto dünyasını irəlilədən amildir və ROBO kimi layihələr, ekosistemin daima inkişafda olduğunu xatırladır.
$ROBO
19
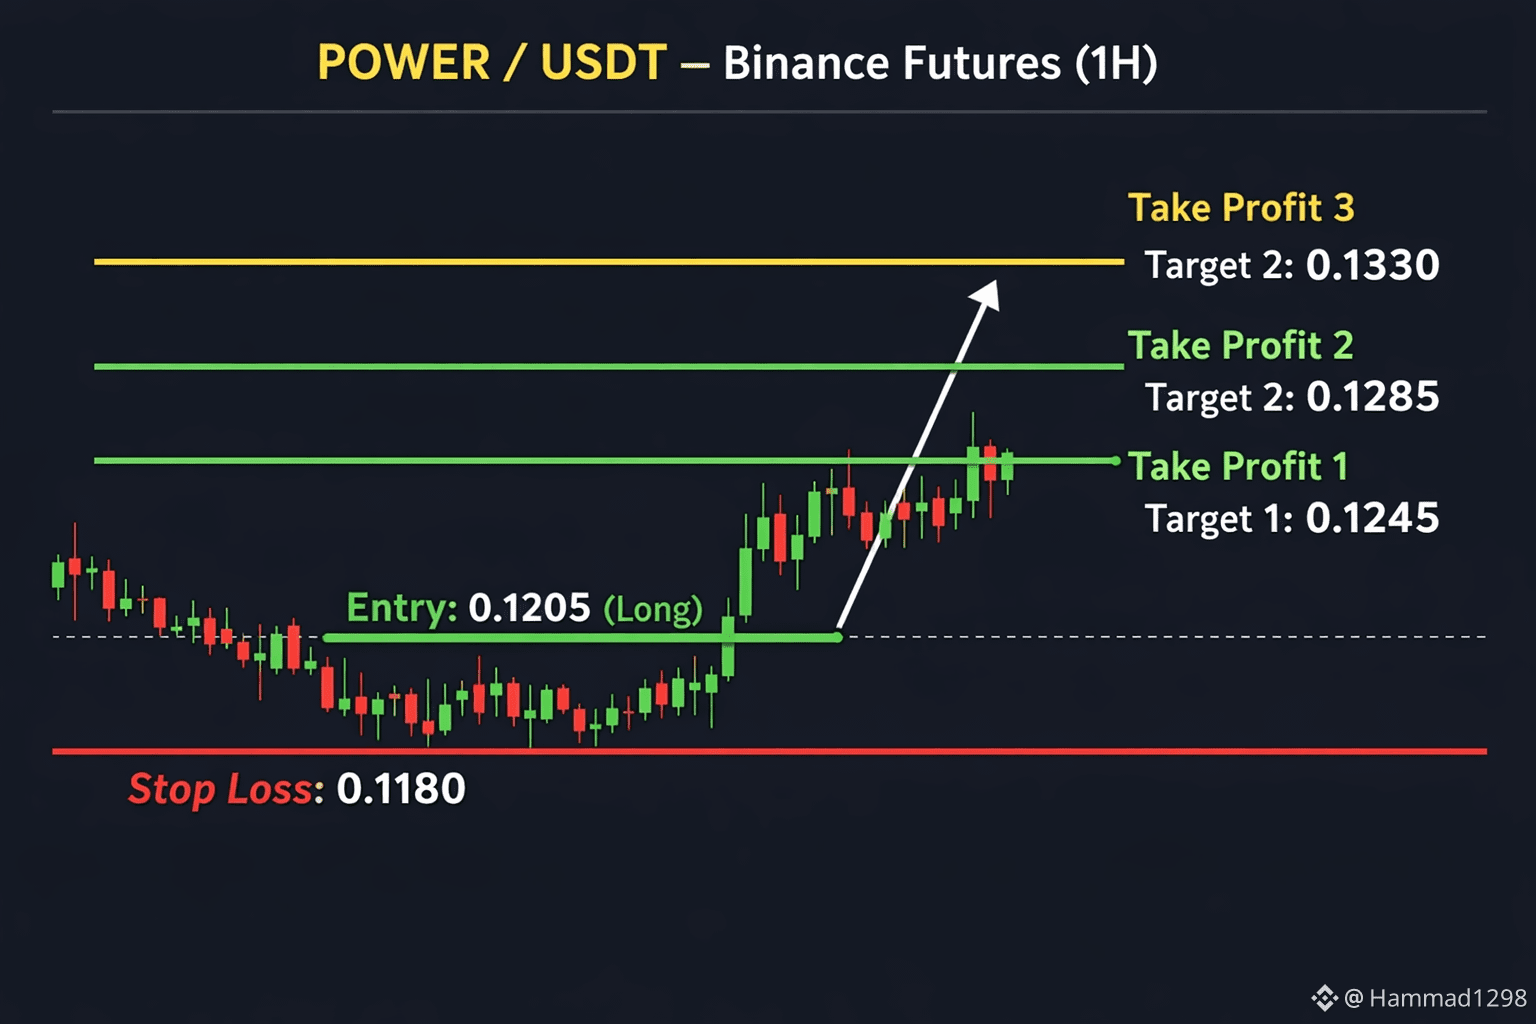
🚀 POWER/USDT Uzun Quraşdırma (Binance Futures)
💚 Giriş: 0.1205
🛑 Zərər Dayandırma: 0.1180
🎯 Qazanc:
TP1: 0.1245
TP2: 0.1285
TP3: 0.1330
📊 RSI 57 → sağlam yüksəliş momenti.
Hər TP-də qazancı qismən çıxarın və TP1-dən sonra ZD izləyin.
💡 Ağıllı ticarət edin, riski idarə edin və qazancın artmasına imkan verin!
$POWER
{future}(POWERUSDT)
🚀 POWER/USDT Uzun Quraşdırma (Binance Futures)
💚 Giriş: 0.1205
🛑 Zərər Dayandırma: 0.1180
🎯 Qazanc:
TP1: 0.1245
TP2: 0.1285
TP3: 0.1330
📊 RSI 57 → sağlam yüksəliş momenti.
Hər TP-də qazancı qismən çıxarın və TP1-dən sonra ZD izləyin.
💡 Ağıllı ticarət edin, riski idarə edin və qazancın artmasına imkan verin!
$POWER
💚 Giriş: 0.1205
🛑 Zərər Dayandırma: 0.1180
🎯 Qazanc:
TP1: 0.1245
TP2: 0.1285
TP3: 0.1330
📊 RSI 57 → sağlam yüksəliş momenti.
Hər TP-də qazancı qismən çıxarın və TP1-dən sonra ZD izləyin.
💡 Ağıllı ticarət edin, riski idarə edin və qazancın artmasına imkan verin!
$POWER
128
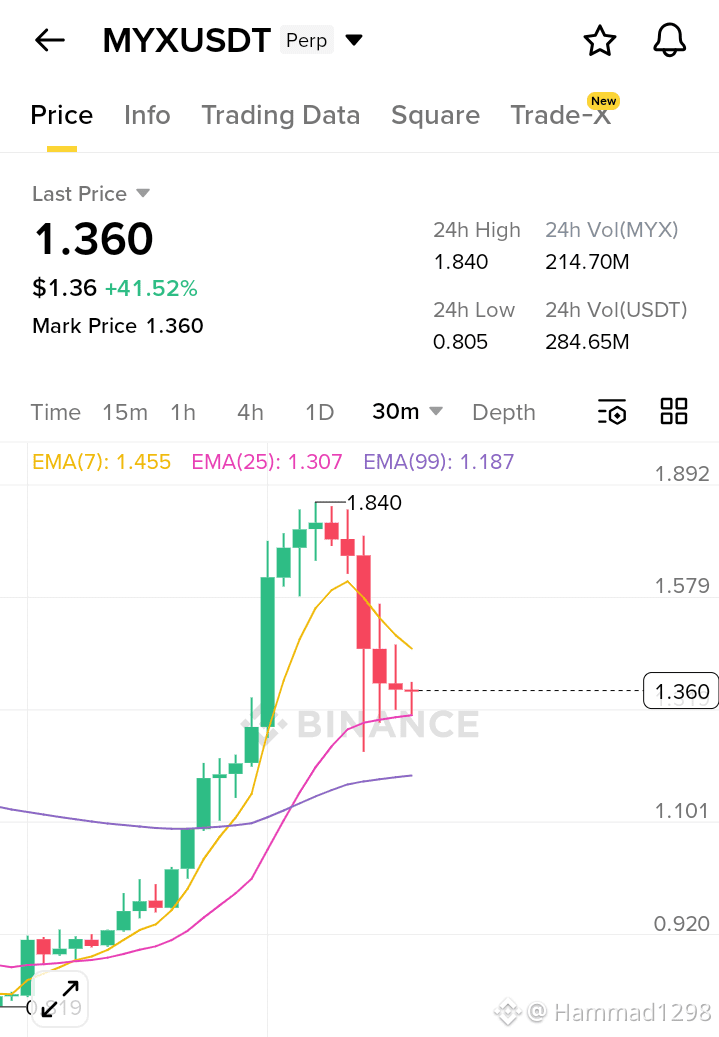
$MYX MYX koini 1.205 USDT dəstək zonasının ətrafında potansiyal bullish dönüşün erkən əlamətlərini göstərir. Son vaxtlar baş verən velas fəaliyyəti güclü alım həcmi ilə müşayiət olunur, bu da tez-tez satıcıların düşüşdən sonra akkumulyasiyaya getdiyini işarə edir.
Əgər həcmi artırmağa davam edərsə və qiymət 1.205-in üstündə qalarsa, MYX qısa müddətdə yuxarı doğru hərəkət üçün momentum qura bilər. Davamlı həcmlə bir partlayış gələn seanslarda daha güclü bullish davam etməsini təsdiqləyə bilər.
Həmişə riskləri idarə edin və ticarətə daxil olmadan əvvəl təsdiqləmə gözləyin.
$MYX
{future}(MYXUSDT)
$MYX MYX koini 1.205 USDT dəstək zonasının ətrafında potansiyal bullish dönüşün erkən əlamətlərini göstərir. Son vaxtlar baş verən velas fəaliyyəti güclü alım həcmi ilə müşayiət olunur, bu da tez-tez satıcıların düşüşdən sonra akkumulyasiyaya getdiyini işarə edir.
Əgər həcmi artırmağa davam edərsə və qiymət 1.205-in üstündə qalarsa, MYX qısa müddətdə yuxarı doğru hərəkət üçün momentum qura bilər. Davamlı həcmlə bir partlayış gələn seanslarda daha güclü bullish davam etməsini təsdiqləyə bilər.
Həmişə riskləri idarə edin və ticarətə daxil olmadan əvvəl təsdiqləmə gözləyin.
$MYX
Əgər həcmi artırmağa davam edərsə və qiymət 1.205-in üstündə qalarsa, MYX qısa müddətdə yuxarı doğru hərəkət üçün momentum qura bilər. Davamlı həcmlə bir partlayış gələn seanslarda daha güclü bullish davam etməsini təsdiqləyə bilər.
Həmişə riskləri idarə edin və ticarətə daxil olmadan əvvəl təsdiqləmə gözləyin.
$MYX
77
BTC Yeniləmə 📉
Bitcoin aşağı yönlü təzyiq göstərir və bu tendensiyanı davam etdirə bilər. Əgər satma momentumu güclü qalarsa, BTC $62K – $64K dəstək zonasına düşə bilər.
Bu aralıqda həcm təsdiqi və əsas dəstək reaksiyalarına diqqət yetirin. Bu ərazidən güclü bir sıçrayış dönüş siqnalı verə bilər — əks halda, daha da aşağı eniş mümkün ola bilər.
Ticaretinizi təhlükəsiz edin və riskinizi idarə edin.
$BTC
{spot}(BTCUSDT)
BTC Yeniləmə 📉
Bitcoin aşağı yönlü təzyiq göstərir və bu tendensiyanı davam etdirə bilər. Əgər satma momentumu güclü qalarsa, BTC $62K – $64K dəstək zonasına düşə bilər.
Bu aralıqda həcm təsdiqi və əsas dəstək reaksiyalarına diqqət yetirin. Bu ərazidən güclü bir sıçrayış dönüş siqnalı verə bilər — əks halda, daha da aşağı eniş mümkün ola bilər.
Ticaretinizi təhlükəsiz edin və riskinizi idarə edin.
$BTC
Bitcoin aşağı yönlü təzyiq göstərir və bu tendensiyanı davam etdirə bilər. Əgər satma momentumu güclü qalarsa, BTC $62K – $64K dəstək zonasına düşə bilər.
Bu aralıqda həcm təsdiqi və əsas dəstək reaksiyalarına diqqət yetirin. Bu ərazidən güclü bir sıçrayış dönüş siqnalı verə bilər — əks halda, daha da aşağı eniş mümkün ola bilər.
Ticaretinizi təhlükəsiz edin və riskinizi idarə edin.
$BTC
19
🚀 $BERA Bullish Setup
BERA güclü bullish momentumu göstərir, qiymət əsas dəstəyin üstündə qalır. Alış təzyiqi artır və struktur yuxarıya davam etməyi dəstəkləyir 📈
Dəstək saxlanıldığı müddətcə, daha da yuxarıya doğru hərəkət ehtimalları var. Təsdiq üçün həcmin genişlənməsinə baxın.
⚠️ Maliyyə məsləhəti deyil. Düzgün risk idarəçiliyi ilə ticarət edin.
$BERA
{spot}(BERAUSDT)
🚀 $BERA Bullish Setup
BERA güclü bullish momentumu göstərir, qiymət əsas dəstəyin üstündə qalır. Alış təzyiqi artır və struktur yuxarıya davam etməyi dəstəkləyir 📈
Dəstək saxlanıldığı müddətcə, daha da yuxarıya doğru hərəkət ehtimalları var. Təsdiq üçün həcmin genişlənməsinə baxın.
⚠️ Maliyyə məsləhəti deyil. Düzgün risk idarəçiliyi ilə ticarət edin.
$BERA
BERA güclü bullish momentumu göstərir, qiymət əsas dəstəyin üstündə qalır. Alış təzyiqi artır və struktur yuxarıya davam etməyi dəstəkləyir 📈
Dəstək saxlanıldığı müddətcə, daha da yuxarıya doğru hərəkət ehtimalları var. Təsdiq üçün həcmin genişlənməsinə baxın.
⚠️ Maliyyə məsləhəti deyil. Düzgün risk idarəçiliyi ilə ticarət edin.
$BERA
118
Daha çox kontent araşdırmaq üçün daxil olun
Binance Square-də qlobal kriptovalyuta istifadəçilərinə qoşulun
⚡️ Kriptovalyuta haqqında ən son və faydalı məlumatları əldə edin.
💬 Dünyanın ən böyük kriptovalyuta birjası tərəfindən etibar edilir.
👍 Doğrulanmış yaradıcılardan gələn real məlumatları kəşf edin.
E-poçt/Telefon nömrəsi
Trenddə olan mövzular
BinanceReopensWithdrawalsForMoreAssets
978,211 baxış
Müzakirə edir: 5,018
Bərpa ilə bağlı yeniləmə #9: Daha çox aktiv üzrə çıxarışlar bərpa ediləcək (2026-11-06)
Binance Announcement
·13 bəyənmə
·22.4k baxış
AnthropicIPOValuationDoubts
628 baxış
Müzakirə edir: 40
USStocksSlipandCryptoMarketUnderBroadPressure
50,932 baxış
Müzakirə edir: 457