

CoinsProbe
3.4k Paylaşımlar

CoinsProbe
 Square Verified+
Şikayət et
İstifadəçini blokla
Coinsprobe is the leading cryptocurrency platform that provides the latest news, breakouts, price predictions, airdrops, events, and ICO presales.
1 İzlənilir
9.8K+ İzləyicilər
12.6K+ Bəyəndi
Postlar
·
--
Məqalə
Bitcoin ETF-ləri 7 günə $742.56M cəlb edir, Ethereum isə $15M-lik tək günlük çıxış görürƏsas məqamlar
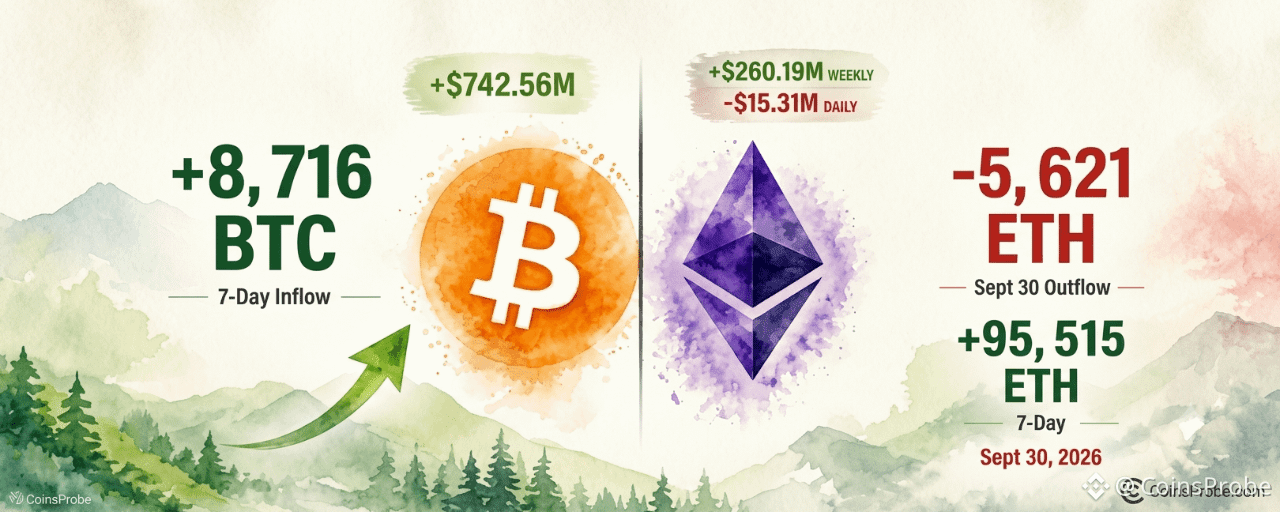
Bitcoin ETF-ləri, Lookonchain-ə görə, sentyabrın 30-dək 7 günlük xalis inflow-larda +8,716 BTC ($742.56M) qeydə alıb
Ethereum ETF-ləri gün içində mənfiə çevrildi — müsbət həftəlik cəmi olsa da, tək sessiyalı çıxış 5,621 ETH ($15.31M)
Bitcoin, hər iki aktiv sinfi üzrə cəmi 1.0 milyard dollarlıq həftəlik ETF xalis inflow-un 74.1%-ni ələ keçirib
30 Sentyabrda BTC-nin gündəlik inflow-u +628 BTC həftənin 1,245 BTC-lik gündəlik ortalamasından təxminən 50% aşağı idi
TƏCİLİ
Lookonchain-ə görə, sentyabrın 30-dək Bitcoin spot ETF-ləri 7 günlük xalis giriş kimi +8,716 BTC (yəni 742.56 milyon dollar) qeydə alıb. Eyni sessiyada Ethereum ETF-ləri 7 günlük Ethereum ETF mənzərəsi müsbət qalsa da, tək gündəlik xalis çıxış kimi 5,621 ETH ($15.31 milyon) göstərib.
Bitcoin ETF-ləri 7 günə $742.56M cəlb edir, Ethereum isə $15M-lik tək günlük çıxış görür
Əsas məqamlar
Bitcoin ETF-ləri, Lookonchain-ə görə, sentyabrın 30-dək 7 günlük xalis inflow-larda +8,716 BTC ($742.56M) qeydə alıb
Ethereum ETF-ləri gün içində mənfiə çevrildi — müsbət həftəlik cəmi olsa da, tək sessiyalı çıxış 5,621 ETH ($15.31M)
Bitcoin, hər iki aktiv sinfi üzrə cəmi 1.0 milyard dollarlıq həftəlik ETF xalis inflow-un 74.1%-ni ələ keçirib
30 Sentyabrda BTC-nin gündəlik inflow-u +628 BTC həftənin 1,245 BTC-lik gündəlik ortalamasından təxminən 50% aşağı idi
TƏCİLİ
Lookonchain-ə görə, sentyabrın 30-dək Bitcoin spot ETF-ləri 7 günlük xalis giriş kimi +8,716 BTC (yəni 742.56 milyon dollar) qeydə alıb. Eyni sessiyada Ethereum ETF-ləri 7 günlük Ethereum ETF mənzərəsi müsbət qalsa da, tək gündəlik xalis çıxış kimi 5,621 ETH ($15.31 milyon) göstərib.
Bitcoin ETF-ləri, Lookonchain-ə görə, sentyabrın 30-dək 7 günlük xalis inflow-larda +8,716 BTC ($742.56M) qeydə alıb
Ethereum ETF-ləri gün içində mənfiə çevrildi — müsbət həftəlik cəmi olsa da, tək sessiyalı çıxış 5,621 ETH ($15.31M)
Bitcoin, hər iki aktiv sinfi üzrə cəmi 1.0 milyard dollarlıq həftəlik ETF xalis inflow-un 74.1%-ni ələ keçirib
30 Sentyabrda BTC-nin gündəlik inflow-u +628 BTC həftənin 1,245 BTC-lik gündəlik ortalamasından təxminən 50% aşağı idi
TƏCİLİ
Lookonchain-ə görə, sentyabrın 30-dək Bitcoin spot ETF-ləri 7 günlük xalis giriş kimi +8,716 BTC (yəni 742.56 milyon dollar) qeydə alıb. Eyni sessiyada Ethereum ETF-ləri 7 günlük Ethereum ETF mənzərəsi müsbət qalsa da, tək gündəlik xalis çıxış kimi 5,621 ETH ($15.31 milyon) göstərib.
2
3
2.8k
·
--
Məqalə
Bitcoin’in Yüksəlişi Fyuçerslərə əsaslanır — Spot Tələbat İtmiş HissədirƏsas məqamlar
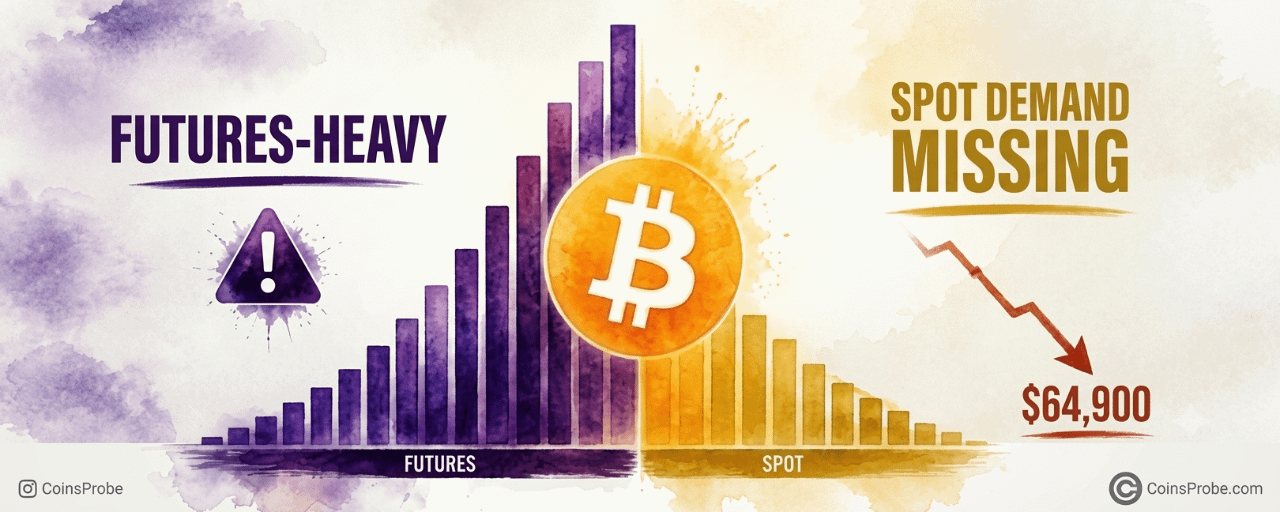
Bitcoin $84,456-da ticarət edir (+0.31% 24saat) — Binance dominasiya qrafiki demək olar ki tam fyuçersə ağır (bənövşəyi) bar üstünlüyünü göstərir
CryptoQuant analitiki Darkfost xəbərdarlıq edir: spot tələbatı "itkin hissədir" — fyuçerslərə əsaslanan reboundlar "tezliklə qeyri-sabit ola bilər"
Spot-dominant baza $64,900-da oturur — fyuçerslərin tərs dönüşü spotun yenidən daxil olması olmadan cari səviyyələrdən 23% eniş riski yaradır
Binance dominasiya qrafikində qızılın (spot-dominant) barlarının qayıtmasına diqqət yetirin — bu, yeganə struktur təsdiq siqnalıdır
Bitcoin’in Yüksəlişi Fyuçerslərə əsaslanır — Spot Tələbat İtmiş Hissədir
Əsas məqamlar
Bitcoin $84,456-da ticarət edir (+0.31% 24saat) — Binance dominasiya qrafiki demək olar ki tam fyuçersə ağır (bənövşəyi) bar üstünlüyünü göstərir
CryptoQuant analitiki Darkfost xəbərdarlıq edir: spot tələbatı "itkin hissədir" — fyuçerslərə əsaslanan reboundlar "tezliklə qeyri-sabit ola bilər"
Spot-dominant baza $64,900-da oturur — fyuçerslərin tərs dönüşü spotun yenidən daxil olması olmadan cari səviyyələrdən 23% eniş riski yaradır
Binance dominasiya qrafikində qızılın (spot-dominant) barlarının qayıtmasına diqqət yetirin — bu, yeganə struktur təsdiq siqnalıdır
Bitcoin $84,456-da ticarət edir (+0.31% 24saat) — Binance dominasiya qrafiki demək olar ki tam fyuçersə ağır (bənövşəyi) bar üstünlüyünü göstərir
CryptoQuant analitiki Darkfost xəbərdarlıq edir: spot tələbatı "itkin hissədir" — fyuçerslərə əsaslanan reboundlar "tezliklə qeyri-sabit ola bilər"
Spot-dominant baza $64,900-da oturur — fyuçerslərin tərs dönüşü spotun yenidən daxil olması olmadan cari səviyyələrdən 23% eniş riski yaradır
Binance dominasiya qrafikində qızılın (spot-dominant) barlarının qayıtmasına diqqət yetirin — bu, yeganə struktur təsdiq siqnalıdır
1
1
1.2k
·
--
Qismən doğrudur
Məqalə
Avalanche Zəncir Üzərində 807 Aktivlə RWA Tokenləşdirilməsində Qlobal Miqyasda #5 SıralamadaƏsas məqamlar
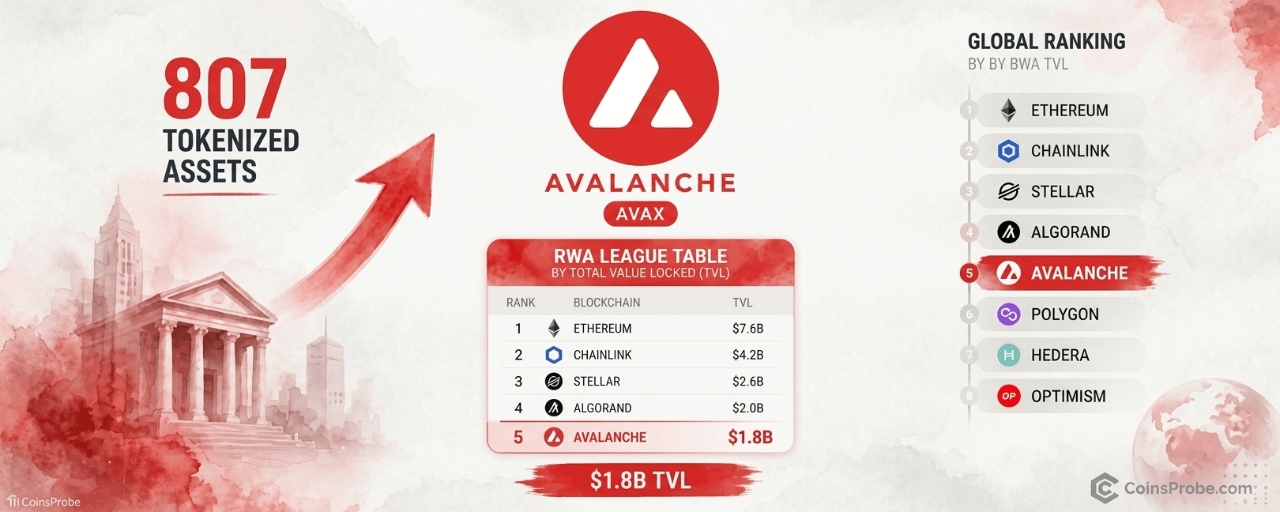
AVAX RWA tokenləşdirilməsində qlobal miqyasda #5-dir: $1.8B TVL və on-çeyndə 807 tokenləşdirilmiş aktiv
Stelların 49 aktivinə qarşı 807 aktiv — Stellar #4-də olsa belə, AVAX institusional genişlikdə öndədir
Analyst CryptoBullet1 RWA-nın mövqelənməsini AVAX üzrə davamlı yüksəlişin əsas struktur səbəbi kimi göstərir
Ethereum $21,881.1B RWA TVL-ə sahibdir — AVAX tezisi üçün əsas rəqabət riski
Avalanche kriptoda ən təsirli Real World Asset (RWA) ekosistemlərindən birini səssizcə qurub. $1.8 milyard RWA TVL və şəbəkəsində təmin edilmiş 807 tokenləşdirilmiş aktivlə AVAX bütün blokçeyn şəbəkələri arasında real dünya aktivlərinin tokenləşdirilməsi üzrə qlobal miqyasda #5-ci yerdədir — bu, qısa müddətli qiymət dinamikasından xeyli kənara çıxan struktur mövqedir.
Avalanche Zəncir Üzərində 807 Aktivlə RWA Tokenləşdirilməsində Qlobal Miqyasda #5 Sıralamada
Əsas məqamlar
AVAX RWA tokenləşdirilməsində qlobal miqyasda #5-dir: $1.8B TVL və on-çeyndə 807 tokenləşdirilmiş aktiv
Stelların 49 aktivinə qarşı 807 aktiv — Stellar #4-də olsa belə, AVAX institusional genişlikdə öndədir
Analyst CryptoBullet1 RWA-nın mövqelənməsini AVAX üzrə davamlı yüksəlişin əsas struktur səbəbi kimi göstərir
Ethereum $21,881.1B RWA TVL-ə sahibdir — AVAX tezisi üçün əsas rəqabət riski
Avalanche kriptoda ən təsirli Real World Asset (RWA) ekosistemlərindən birini səssizcə qurub. $1.8 milyard RWA TVL və şəbəkəsində təmin edilmiş 807 tokenləşdirilmiş aktivlə AVAX bütün blokçeyn şəbəkələri arasında real dünya aktivlərinin tokenləşdirilməsi üzrə qlobal miqyasda #5-ci yerdədir — bu, qısa müddətli qiymət dinamikasından xeyli kənara çıxan struktur mövqedir.
AVAX RWA tokenləşdirilməsində qlobal miqyasda #5-dir: $1.8B TVL və on-çeyndə 807 tokenləşdirilmiş aktiv
Stelların 49 aktivinə qarşı 807 aktiv — Stellar #4-də olsa belə, AVAX institusional genişlikdə öndədir
Analyst CryptoBullet1 RWA-nın mövqelənməsini AVAX üzrə davamlı yüksəlişin əsas struktur səbəbi kimi göstərir
Ethereum $21,881.1B RWA TVL-ə sahibdir — AVAX tezisi üçün əsas rəqabət riski
Avalanche kriptoda ən təsirli Real World Asset (RWA) ekosistemlərindən birini səssizcə qurub. $1.8 milyard RWA TVL və şəbəkəsində təmin edilmiş 807 tokenləşdirilmiş aktivlə AVAX bütün blokçeyn şəbəkələri arasında real dünya aktivlərinin tokenləşdirilməsi üzrə qlobal miqyasda #5-ci yerdədir — bu, qısa müddətli qiymət dinamikasından xeyli kənara çıxan struktur mövqedir.
2
3
3.9k
·
--
Doğrulanıb
Məqalə
NEAR NYSE Arca-da Bitwise NEAR ETF-ni təqdim edir: 35,5M 1-ci gün axınları ilə artımƏsas Xüsusiyyətlər
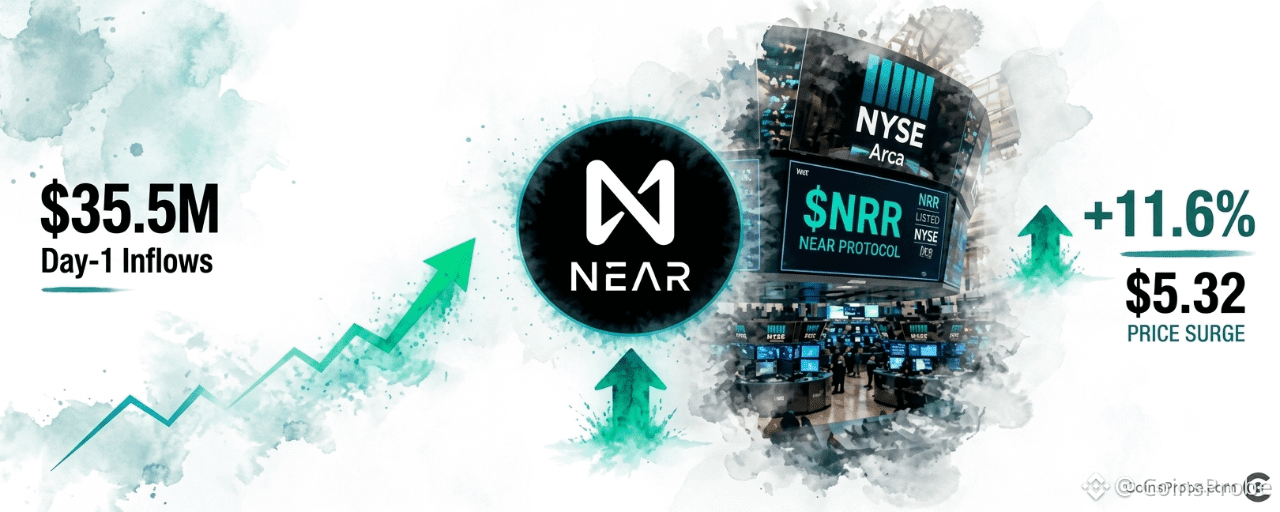
NEAR 5,32$-да ticarət edir — 11,61% artım — Bitwise NEAR ETF-i ($NRR) 29 sentyabr 2026-cı ildə NYSE Arca-da işə düşdükdən sonra.
1-ci gün göstəriciləri: 36 mln. $ AUM və 35,5 mln. $ xalis axınlar — ümumi AUM-un 98,6%-i 1-ci ticarət günündə per @NEARProtocol gəlib.
$NRR ABŞ-da ilk spot NEAR ETP-dir və hər buraxılan səhri dəstəkləmək üçün birbaşa spot token alışlarını tələb edir.
$5,50 müqavimətinə və gündəlik $NRR axınlarına diqqət edin — davamlı axınlar struktural alıcını təsdiqləyir; dayanmış axınlar isə bir günlük premium siqnalı verir.
NEAR NYSE Arca-da Bitwise NEAR ETF-ni təqdim edir: 35,5M 1-ci gün axınları ilə artım
Əsas Xüsusiyyətlər
NEAR 5,32$-да ticarət edir — 11,61% artım — Bitwise NEAR ETF-i ($NRR) 29 sentyabr 2026-cı ildə NYSE Arca-da işə düşdükdən sonra.
1-ci gün göstəriciləri: 36 mln. $ AUM və 35,5 mln. $ xalis axınlar — ümumi AUM-un 98,6%-i 1-ci ticarət günündə per @NEARProtocol gəlib.
$NRR ABŞ-da ilk spot NEAR ETP-dir və hər buraxılan səhri dəstəkləmək üçün birbaşa spot token alışlarını tələb edir.
$5,50 müqavimətinə və gündəlik $NRR axınlarına diqqət edin — davamlı axınlar struktural alıcını təsdiqləyir; dayanmış axınlar isə bir günlük premium siqnalı verir.
NEAR 5,32$-да ticarət edir — 11,61% artım — Bitwise NEAR ETF-i ($NRR) 29 sentyabr 2026-cı ildə NYSE Arca-da işə düşdükdən sonra.
1-ci gün göstəriciləri: 36 mln. $ AUM və 35,5 mln. $ xalis axınlar — ümumi AUM-un 98,6%-i 1-ci ticarət günündə per @NEARProtocol gəlib.
$NRR ABŞ-da ilk spot NEAR ETP-dir və hər buraxılan səhri dəstəkləmək üçün birbaşa spot token alışlarını tələb edir.
$5,50 müqavimətinə və gündəlik $NRR axınlarına diqqət edin — davamlı axınlar struktural alıcını təsdiqləyir; dayanmış axınlar isə bir günlük premium siqnalı verir.
1
1.3k
·
--
Məqalə
Tərcüməyə bax
Bitcoin Absorbs $276M Bitget Exodus in One Hour — Price Holds $83K–$84KKey Highlights
Bitcoin holds $83K–$84K as 3,326 BTC (~$276M) exits Bitget in 60 minutes after withdrawal reopeningSingle-hour outflow equals ~12 days of normal Bitget daily BTC withdrawals, per @IT_Tech_PL via CryptoQuantPrice reaction: flat — demand absorption at $83K–$84K absorbs full distressed sell event without breakdownKey levels: $82K invalidation (bearish) vs. $87K–$87.5K resistance (bull confirmation target)
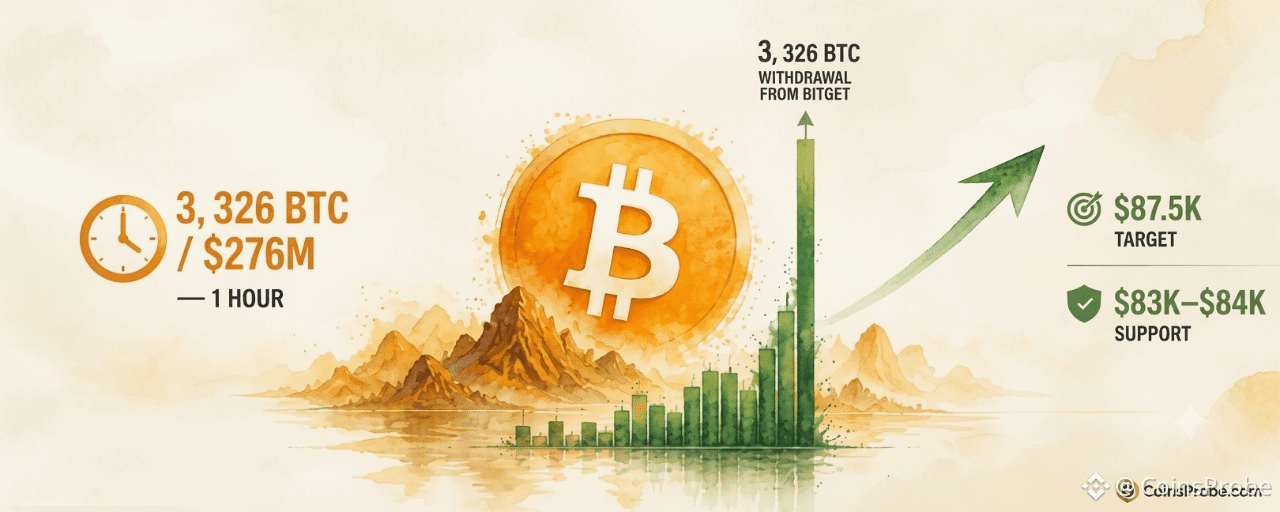
Bitcoin is trading at approximately $83,203 — down just 0.10% over the past 24 hours — with a market capitalization of $1.67 trillion. That near-flat performance is the story. Not because nothing happened, but because something extraordinary happened and the price barely flinched.
On-chain analyst @IT_Tech_PL, writing via CryptoQuant, put it plainly: “In the first hour, 3,326 BTC (~$276M) left the exchange… That first hour alone moved about 12 days’ worth of normal outflows. Price barely moved and held 83–84K.” That is not a routine data point. It is a structural signal about who is absorbing supply right now.
What Happened — The Bitget Withdrawal Event
Bitget reopened BTC withdrawals following the exchange’s $388 million hack that forced a temporary suspension. The moment the gates opened, pent-up withdrawal demand was released in a single compressed burst.
The numbers: 3,326 BTC — approximately $276 million at current prices — left Bitget in the first 60 minutes after reopening. To put that in context, @IT_Tech_PL’s data shows that this single hour represented roughly 12 days’ worth of normal daily outflow from the exchange, compressed into one window.
Metric Value BTC withdrawn (1 hour) 3,326 BTC (~$276M) Normal daily outflow (estimate) ~277 BTC/day Compression factor ~12× normal daily outflow BTC price during event $83,000–$84,000 Price reaction Essentially flat
Source: @IT_Tech_PL via CryptoQuant
Under normal market conditions, a forced exit of this scale — concentrated into a single hour — would be expected to generate meaningful sell-side pressure on spot markets. Holders withdrawing from an exchange that just suffered a $388M exploit are, rationally, motivated sellers. The fact that Bitcoin absorbed every dollar of that potential supply without breaking $83K is the signal.
Why Price Resilience During Forced Selling Matters
This is not about Bitget specifically. It is about what the price response reveals about the current demand structure underneath Bitcoin.
When a large, concentrated outflow event — driven by fear, not conviction — fails to suppress price, the market is communicating that buy-side liquidity at this level is deep enough to absorb distressed selling. This is the mechanical definition of accumulation: sellers exist, buyers match them, and price does not clear lower.
CryptoQuant’s chart for the August 30–September 29 window shows the September 28–29 withdrawal spike as the single largest outflow event on the 30-day chart — a vertical green bar with no comparable precedent in the prior month. Bitcoin’s price line across that same window holds $83K–$84K without a meaningful breakdown.
Bitcoin Exchange Withdrawals – Bitget | Aug 30 – Sep 29 | Source: @cryptoquant_com (X)
Bitcoin Exchange Withdrawals — Bitget | Aug 30–Sep 29 | Source: @cryptoquant_com (X)
The prior context matters here too. The Bitget hacker moved $351.6M — swapping ETH for BTC via THORChain — creating a separate but related supply-side event in the weeks prior. Bitcoin absorbed that as well. Two significant forced supply events. Price is still above $83K.
The Key Levels — Support, Resistance, and Invalidation
Per the CryptoQuant chart analysis, three levels define the current structure:
$83K–$84K — Current support zone. This is where price held during the withdrawal event. Holding here is the baseline bull case.$82K — Invalidation. A sustained close below $82K would signal that the demand absorption documented above was not sufficient to maintain the trend. This is the level to watch for regime change.$87K–$87.5K — Resistance, per the late-September chart peak. Reclaiming this zone on volume would confirm the accumulation thesis and open the next leg.
Bullish Scenario — Hold Above $83K
Bitcoin continues to hold $83K–$84K as support. The demand absorption documented in the withdrawal event proves durable. Price grinds toward $87K–$87.5K resistance. A weekly close above $87.5K would be the first confirmation that the post-hack supply overhang has been fully cleared and the market is structurally ready for expansion.
Bearish Scenario — Break Below $82K
A clean daily close below $82K would indicate the demand that absorbed the Bitget outflow was short-term arbitrage rather than structural accumulation. In that scenario, mid-September’s $76K–$77K low becomes the next logical support test — a roughly 8–9% drawdown from current levels. This outcome would require a re-evaluation of the accumulation thesis entirely.
What This Is — And What It Isn’t
This is not a guarantee of upside. One hour of price resilience does not define a bull market. What it does confirm, with precision, is that at $83K–$84K, there exists sufficient buy-side demand to absorb 3,326 BTC of concentrated selling without price dislocation. That is a measurable, documented fact — not an interpretation.
The Bitget situation also carries an important caveat: withdrawal events from hacked exchanges are structurally different from normal exchange outflows. Users withdrawing post-hack may move coins to cold storage rather than sell immediately. The full impact on spot supply may be lagged. However, the price response — or lack thereof — is real-time and unambiguous.
Bitcoin’s $276M absorption test returned a passing grade. The market printed it in one hour at $83K–$84K. Whether the demand that absorbed that supply sustains at these levels is the only question that matters now. Watch $82K as the invalidation line and $87.5K as the confirmation target. One of those levels will answer the question.
Disclaimer: This article is for informational purposes only and does not constitute financial advice. Always conduct your own research before making any investment decisions.
Bitcoin Absorbs $276M Bitget Exodus in One Hour — Price Holds $83K–$84K
Key Highlights
Bitcoin holds $83K–$84K as 3,326 BTC (~$276M) exits Bitget in 60 minutes after withdrawal reopeningSingle-hour outflow equals ~12 days of normal Bitget daily BTC withdrawals, per @IT_Tech_PL via CryptoQuantPrice reaction: flat — demand absorption at $83K–$84K absorbs full distressed sell event without breakdownKey levels: $82K invalidation (bearish) vs. $87K–$87.5K resistance (bull confirmation target)
Bitcoin is trading at approximately $83,203 — down just 0.10% over the past 24 hours — with a market capitalization of $1.67 trillion. That near-flat performance is the story. Not because nothing happened, but because something extraordinary happened and the price barely flinched.
On-chain analyst @IT_Tech_PL, writing via CryptoQuant, put it plainly: “In the first hour, 3,326 BTC (~$276M) left the exchange… That first hour alone moved about 12 days’ worth of normal outflows. Price barely moved and held 83–84K.” That is not a routine data point. It is a structural signal about who is absorbing supply right now.
What Happened — The Bitget Withdrawal Event
Bitget reopened BTC withdrawals following the exchange’s $388 million hack that forced a temporary suspension. The moment the gates opened, pent-up withdrawal demand was released in a single compressed burst.
The numbers: 3,326 BTC — approximately $276 million at current prices — left Bitget in the first 60 minutes after reopening. To put that in context, @IT_Tech_PL’s data shows that this single hour represented roughly 12 days’ worth of normal daily outflow from the exchange, compressed into one window.
Metric Value BTC withdrawn (1 hour) 3,326 BTC (~$276M) Normal daily outflow (estimate) ~277 BTC/day Compression factor ~12× normal daily outflow BTC price during event $83,000–$84,000 Price reaction Essentially flat
Source: @IT_Tech_PL via CryptoQuant
Under normal market conditions, a forced exit of this scale — concentrated into a single hour — would be expected to generate meaningful sell-side pressure on spot markets. Holders withdrawing from an exchange that just suffered a $388M exploit are, rationally, motivated sellers. The fact that Bitcoin absorbed every dollar of that potential supply without breaking $83K is the signal.
Why Price Resilience During Forced Selling Matters
This is not about Bitget specifically. It is about what the price response reveals about the current demand structure underneath Bitcoin.
When a large, concentrated outflow event — driven by fear, not conviction — fails to suppress price, the market is communicating that buy-side liquidity at this level is deep enough to absorb distressed selling. This is the mechanical definition of accumulation: sellers exist, buyers match them, and price does not clear lower.
CryptoQuant’s chart for the August 30–September 29 window shows the September 28–29 withdrawal spike as the single largest outflow event on the 30-day chart — a vertical green bar with no comparable precedent in the prior month. Bitcoin’s price line across that same window holds $83K–$84K without a meaningful breakdown.
Bitcoin Exchange Withdrawals – Bitget | Aug 30 – Sep 29 | Source: @cryptoquant_com (X)
Bitcoin Exchange Withdrawals — Bitget | Aug 30–Sep 29 | Source: @cryptoquant_com (X)
The prior context matters here too. The Bitget hacker moved $351.6M — swapping ETH for BTC via THORChain — creating a separate but related supply-side event in the weeks prior. Bitcoin absorbed that as well. Two significant forced supply events. Price is still above $83K.
The Key Levels — Support, Resistance, and Invalidation
Per the CryptoQuant chart analysis, three levels define the current structure:
$83K–$84K — Current support zone. This is where price held during the withdrawal event. Holding here is the baseline bull case.$82K — Invalidation. A sustained close below $82K would signal that the demand absorption documented above was not sufficient to maintain the trend. This is the level to watch for regime change.$87K–$87.5K — Resistance, per the late-September chart peak. Reclaiming this zone on volume would confirm the accumulation thesis and open the next leg.
Bullish Scenario — Hold Above $83K
Bitcoin continues to hold $83K–$84K as support. The demand absorption documented in the withdrawal event proves durable. Price grinds toward $87K–$87.5K resistance. A weekly close above $87.5K would be the first confirmation that the post-hack supply overhang has been fully cleared and the market is structurally ready for expansion.
Bearish Scenario — Break Below $82K
A clean daily close below $82K would indicate the demand that absorbed the Bitget outflow was short-term arbitrage rather than structural accumulation. In that scenario, mid-September’s $76K–$77K low becomes the next logical support test — a roughly 8–9% drawdown from current levels. This outcome would require a re-evaluation of the accumulation thesis entirely.
What This Is — And What It Isn’t
This is not a guarantee of upside. One hour of price resilience does not define a bull market. What it does confirm, with precision, is that at $83K–$84K, there exists sufficient buy-side demand to absorb 3,326 BTC of concentrated selling without price dislocation. That is a measurable, documented fact — not an interpretation.
The Bitget situation also carries an important caveat: withdrawal events from hacked exchanges are structurally different from normal exchange outflows. Users withdrawing post-hack may move coins to cold storage rather than sell immediately. The full impact on spot supply may be lagged. However, the price response — or lack thereof — is real-time and unambiguous.
Bitcoin’s $276M absorption test returned a passing grade. The market printed it in one hour at $83K–$84K. Whether the demand that absorbed that supply sustains at these levels is the only question that matters now. Watch $82K as the invalidation line and $87.5K as the confirmation target. One of those levels will answer the question.
Disclaimer: This article is for informational purposes only and does not constitute financial advice. Always conduct your own research before making any investment decisions.
Bitcoin holds $83K–$84K as 3,326 BTC (~$276M) exits Bitget in 60 minutes after withdrawal reopeningSingle-hour outflow equals ~12 days of normal Bitget daily BTC withdrawals, per @IT_Tech_PL via CryptoQuantPrice reaction: flat — demand absorption at $83K–$84K absorbs full distressed sell event without breakdownKey levels: $82K invalidation (bearish) vs. $87K–$87.5K resistance (bull confirmation target)
Bitcoin is trading at approximately $83,203 — down just 0.10% over the past 24 hours — with a market capitalization of $1.67 trillion. That near-flat performance is the story. Not because nothing happened, but because something extraordinary happened and the price barely flinched.
On-chain analyst @IT_Tech_PL, writing via CryptoQuant, put it plainly: “In the first hour, 3,326 BTC (~$276M) left the exchange… That first hour alone moved about 12 days’ worth of normal outflows. Price barely moved and held 83–84K.” That is not a routine data point. It is a structural signal about who is absorbing supply right now.
What Happened — The Bitget Withdrawal Event
Bitget reopened BTC withdrawals following the exchange’s $388 million hack that forced a temporary suspension. The moment the gates opened, pent-up withdrawal demand was released in a single compressed burst.
The numbers: 3,326 BTC — approximately $276 million at current prices — left Bitget in the first 60 minutes after reopening. To put that in context, @IT_Tech_PL’s data shows that this single hour represented roughly 12 days’ worth of normal daily outflow from the exchange, compressed into one window.
Metric Value BTC withdrawn (1 hour) 3,326 BTC (~$276M) Normal daily outflow (estimate) ~277 BTC/day Compression factor ~12× normal daily outflow BTC price during event $83,000–$84,000 Price reaction Essentially flat
Source: @IT_Tech_PL via CryptoQuant
Under normal market conditions, a forced exit of this scale — concentrated into a single hour — would be expected to generate meaningful sell-side pressure on spot markets. Holders withdrawing from an exchange that just suffered a $388M exploit are, rationally, motivated sellers. The fact that Bitcoin absorbed every dollar of that potential supply without breaking $83K is the signal.
Why Price Resilience During Forced Selling Matters
This is not about Bitget specifically. It is about what the price response reveals about the current demand structure underneath Bitcoin.
When a large, concentrated outflow event — driven by fear, not conviction — fails to suppress price, the market is communicating that buy-side liquidity at this level is deep enough to absorb distressed selling. This is the mechanical definition of accumulation: sellers exist, buyers match them, and price does not clear lower.
CryptoQuant’s chart for the August 30–September 29 window shows the September 28–29 withdrawal spike as the single largest outflow event on the 30-day chart — a vertical green bar with no comparable precedent in the prior month. Bitcoin’s price line across that same window holds $83K–$84K without a meaningful breakdown.
Bitcoin Exchange Withdrawals – Bitget | Aug 30 – Sep 29 | Source: @cryptoquant_com (X)
Bitcoin Exchange Withdrawals — Bitget | Aug 30–Sep 29 | Source: @cryptoquant_com (X)
The prior context matters here too. The Bitget hacker moved $351.6M — swapping ETH for BTC via THORChain — creating a separate but related supply-side event in the weeks prior. Bitcoin absorbed that as well. Two significant forced supply events. Price is still above $83K.
The Key Levels — Support, Resistance, and Invalidation
Per the CryptoQuant chart analysis, three levels define the current structure:
$83K–$84K — Current support zone. This is where price held during the withdrawal event. Holding here is the baseline bull case.$82K — Invalidation. A sustained close below $82K would signal that the demand absorption documented above was not sufficient to maintain the trend. This is the level to watch for regime change.$87K–$87.5K — Resistance, per the late-September chart peak. Reclaiming this zone on volume would confirm the accumulation thesis and open the next leg.
Bullish Scenario — Hold Above $83K
Bitcoin continues to hold $83K–$84K as support. The demand absorption documented in the withdrawal event proves durable. Price grinds toward $87K–$87.5K resistance. A weekly close above $87.5K would be the first confirmation that the post-hack supply overhang has been fully cleared and the market is structurally ready for expansion.
Bearish Scenario — Break Below $82K
A clean daily close below $82K would indicate the demand that absorbed the Bitget outflow was short-term arbitrage rather than structural accumulation. In that scenario, mid-September’s $76K–$77K low becomes the next logical support test — a roughly 8–9% drawdown from current levels. This outcome would require a re-evaluation of the accumulation thesis entirely.
What This Is — And What It Isn’t
This is not a guarantee of upside. One hour of price resilience does not define a bull market. What it does confirm, with precision, is that at $83K–$84K, there exists sufficient buy-side demand to absorb 3,326 BTC of concentrated selling without price dislocation. That is a measurable, documented fact — not an interpretation.
The Bitget situation also carries an important caveat: withdrawal events from hacked exchanges are structurally different from normal exchange outflows. Users withdrawing post-hack may move coins to cold storage rather than sell immediately. The full impact on spot supply may be lagged. However, the price response — or lack thereof — is real-time and unambiguous.
Bitcoin’s $276M absorption test returned a passing grade. The market printed it in one hour at $83K–$84K. Whether the demand that absorbed that supply sustains at these levels is the only question that matters now. Watch $82K as the invalidation line and $87.5K as the confirmation target. One of those levels will answer the question.
Disclaimer: This article is for informational purposes only and does not constitute financial advice. Always conduct your own research before making any investment decisions.
113
·
--
Məqalə
Tərcüməyə bax
SUI Golden Cross Forms — Last Two Signals Led to +220% Rallies, Target $4Key Highlights
SUI trades at $1.15 (+2.96% 24h, $4.72B market cap) as a golden cross forms on the daily chartAnalyst @alicharts flags 50D SMA crossing above 200D SMA — prior two instances produced +240.25% and +222.45% rallies$4.00 price target requires +245% from current $1.15; key resistance at $1.80 and $3.00Invalidation level: $0.72 — a break below negates the golden cross thesis entirely
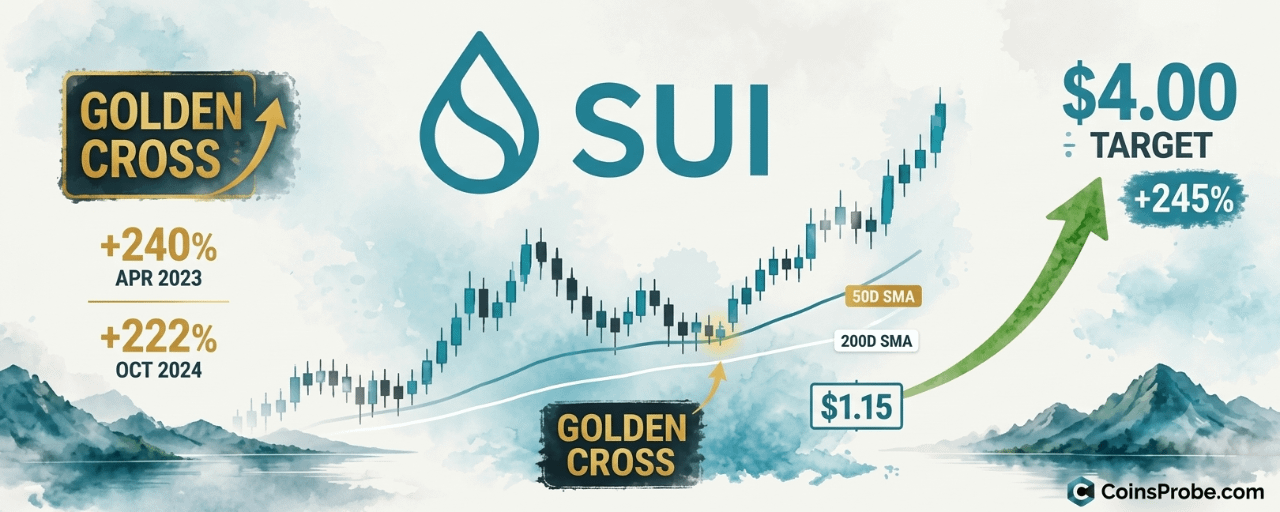
SUI is trading at $1.15 — up 2.96% in 24 hours — with a market cap of $4.72 billion, as one of the most reliable trend-reversal signals in technical analysis begins to form on its daily chart: a golden cross.
Crypto analyst Ali Martinez (@alicharts) flagged the setup on September 30, 2026, identifying SUI as “on the verge of printing a new golden cross, with the 50-day SMA beginning to cross above the 200-day SMA.” Martinez called it “a major bullish trend signal” that “could mark the beginning of a longer-term bull market” — with a price target of $4.00.
What a Golden Cross Actually Measures
The golden cross is not a price level — it is a momentum event. It occurs when a shorter-term moving average (the 50-day SMA) crosses above a longer-term one (the 200-day SMA), signaling that recent price action has accelerated above the longer-term trend baseline. The 200-day SMA acts as the long-cycle anchor; when the 50-day breaches it from below, it reflects sustained buying pressure that has outpaced months of prior selling.
This matters on the daily chart because the 200-day SMA represents roughly 40 weeks of price history. A cross above it is not noise — it requires a structural shift in momentum to execute.
The Track Record — Two Prior Golden Crosses, Two +220%+ Rallies
The daily chart shared by @alicharts documents SUI’s prior golden cross instances across the 2025 cycle. Both resulted in sustained rallies of comparable magnitude:
Instance Signal Type Rally Produced Golden Cross #1 (2025 Cycle — Early) 50D SMA crosses above 200D SMA +240.25% Golden Cross #2 (2025 Cycle — Mid) 50D SMA crosses above 200D SMA +222.45% Golden Cross #3 (Forming — Sept 2026) 50D SMA crossing above 200D SMA Target: +245% to$4.00
Source: @alicharts daily SUI chart, September 30, 2026
Two-for-two is a track record. The current signal is now forming at a structurally similar setup — a deep correction from prior highs followed by a base at approximately $0.72, now recovering with the 50-day SMA curling upward through the 200-day SMA.
Reading the Chart — Levels That Matter
Ali Martinez’s daily SUI chart reveals the full structure of the current setup. Price bottomed near $0.72 — the key support zone — before recovering to current levels around $1.15–$1.16. Two resistance checkpoints stand between current price and the $4.00 target: $1.80 (first resistance) and $3.00 (second major resistance). The $4.00 target represents a +245% move from the $1.15 entry level.
SUI Daily Chart Analysis | Source: @alicharts (X)
The prior percentage moves annotated on the left side of the chart — the +240.25% and +222.45% labels — represent already-completed rallies from the 2025 cycle peaks, confirming the pattern context. The current formation mirrors those prior launchpad conditions: base established, golden cross imminent, momentum returning.
Key Levels — Support, Resistance, and the Invalidation Line
Three prices define this trade:
$0.72 — Support / Invalidation: The recent cycle low. A sustained breakdown below this level would invalidate the golden cross thesis and suggest the 200-day SMA is not acting as support but rather resistance from below.$1.80 — First Resistance: The initial checkpoint. A clean break and hold above $1.80 on daily closes would confirm the trend reversal is advancing as expected.$3.00 — Second Resistance: The intermediate target before the $4.00 zone. Historical resistance from the 2025 cycle structure. Clearing $3.00 on high volume opens the direct path to Martinez’s target.
Bullish Scenario — Confirmed Golden Cross and $1.80 Reclaim
If SUI’s 50-day SMA completes the cross above the 200-day SMA on a daily close, and price subsequently reclaims and holds $1.80, the pattern aligns with the two prior golden cross instances that each produced 220%–240% gains. From $1.80, the next measured move targets $3.00, then $4.00. The +245% path from current levels to $4.00 is consistent with both prior precedents.
Bearish Scenario — Death Cross Invalidation at $0.72
A failure of the golden cross — where the 50-day SMA stalls and rolls back below the 200-day SMA — combined with a breakdown below the $0.72 support level would negate the current bullish structure entirely. In that scenario, SUI would be printing a failed golden cross, historically a bearish signal when the cross reverses quickly, with downside risk reopening toward prior accumulation zones.
Two-for-Two Becomes Three-for-Three — or Doesn’t
SUI’s golden cross is forming at $1.15 with a documented two-for-two track record of producing +220% to +240% rallies in both prior instances this cycle, per Ali Martinez’s daily chart analysis. The mechanism is straightforward: the 50-day SMA crossing above the 200-day SMA signals that medium-term momentum has structurally overtaken the long-term trend, historically the inflection point for SUI’s largest sustained moves.
The $4.00 target requires +245% from current price, with $1.80 and $3.00 as the intermediate checkpoints that will define whether the third instance matches its predecessors. Watch $0.72 as the hard invalidation — and watch $1.80 as the first confirmation that the cross is holding.
Disclaimer: The views and analysis presented in this article are for informational purposes only and reflect the author’s perspective, not financial advice. Technical patterns and indicators discussed are subject to market volatility and may or may not yield anticipated results. Investors are advised to exercise caution, conduct independent research, and make decisions aligned with their individual risk tolerance.
SUI Golden Cross Forms — Last Two Signals Led to +220% Rallies, Target $4
Key Highlights
SUI trades at $1.15 (+2.96% 24h, $4.72B market cap) as a golden cross forms on the daily chartAnalyst @alicharts flags 50D SMA crossing above 200D SMA — prior two instances produced +240.25% and +222.45% rallies$4.00 price target requires +245% from current $1.15; key resistance at $1.80 and $3.00Invalidation level: $0.72 — a break below negates the golden cross thesis entirely
SUI is trading at $1.15 — up 2.96% in 24 hours — with a market cap of $4.72 billion, as one of the most reliable trend-reversal signals in technical analysis begins to form on its daily chart: a golden cross.
Crypto analyst Ali Martinez (@alicharts) flagged the setup on September 30, 2026, identifying SUI as “on the verge of printing a new golden cross, with the 50-day SMA beginning to cross above the 200-day SMA.” Martinez called it “a major bullish trend signal” that “could mark the beginning of a longer-term bull market” — with a price target of $4.00.
What a Golden Cross Actually Measures
The golden cross is not a price level — it is a momentum event. It occurs when a shorter-term moving average (the 50-day SMA) crosses above a longer-term one (the 200-day SMA), signaling that recent price action has accelerated above the longer-term trend baseline. The 200-day SMA acts as the long-cycle anchor; when the 50-day breaches it from below, it reflects sustained buying pressure that has outpaced months of prior selling.
This matters on the daily chart because the 200-day SMA represents roughly 40 weeks of price history. A cross above it is not noise — it requires a structural shift in momentum to execute.
The Track Record — Two Prior Golden Crosses, Two +220%+ Rallies
The daily chart shared by @alicharts documents SUI’s prior golden cross instances across the 2025 cycle. Both resulted in sustained rallies of comparable magnitude:
Instance Signal Type Rally Produced Golden Cross #1 (2025 Cycle — Early) 50D SMA crosses above 200D SMA +240.25% Golden Cross #2 (2025 Cycle — Mid) 50D SMA crosses above 200D SMA +222.45% Golden Cross #3 (Forming — Sept 2026) 50D SMA crossing above 200D SMA Target: +245% to$4.00
Source: @alicharts daily SUI chart, September 30, 2026
Two-for-two is a track record. The current signal is now forming at a structurally similar setup — a deep correction from prior highs followed by a base at approximately $0.72, now recovering with the 50-day SMA curling upward through the 200-day SMA.
Reading the Chart — Levels That Matter
Ali Martinez’s daily SUI chart reveals the full structure of the current setup. Price bottomed near $0.72 — the key support zone — before recovering to current levels around $1.15–$1.16. Two resistance checkpoints stand between current price and the $4.00 target: $1.80 (first resistance) and $3.00 (second major resistance). The $4.00 target represents a +245% move from the $1.15 entry level.
SUI Daily Chart Analysis | Source: @alicharts (X)
The prior percentage moves annotated on the left side of the chart — the +240.25% and +222.45% labels — represent already-completed rallies from the 2025 cycle peaks, confirming the pattern context. The current formation mirrors those prior launchpad conditions: base established, golden cross imminent, momentum returning.
Key Levels — Support, Resistance, and the Invalidation Line
Three prices define this trade:
$0.72 — Support / Invalidation: The recent cycle low. A sustained breakdown below this level would invalidate the golden cross thesis and suggest the 200-day SMA is not acting as support but rather resistance from below.$1.80 — First Resistance: The initial checkpoint. A clean break and hold above $1.80 on daily closes would confirm the trend reversal is advancing as expected.$3.00 — Second Resistance: The intermediate target before the $4.00 zone. Historical resistance from the 2025 cycle structure. Clearing $3.00 on high volume opens the direct path to Martinez’s target.
Bullish Scenario — Confirmed Golden Cross and $1.80 Reclaim
If SUI’s 50-day SMA completes the cross above the 200-day SMA on a daily close, and price subsequently reclaims and holds $1.80, the pattern aligns with the two prior golden cross instances that each produced 220%–240% gains. From $1.80, the next measured move targets $3.00, then $4.00. The +245% path from current levels to $4.00 is consistent with both prior precedents.
Bearish Scenario — Death Cross Invalidation at $0.72
A failure of the golden cross — where the 50-day SMA stalls and rolls back below the 200-day SMA — combined with a breakdown below the $0.72 support level would negate the current bullish structure entirely. In that scenario, SUI would be printing a failed golden cross, historically a bearish signal when the cross reverses quickly, with downside risk reopening toward prior accumulation zones.
Two-for-Two Becomes Three-for-Three — or Doesn’t
SUI’s golden cross is forming at $1.15 with a documented two-for-two track record of producing +220% to +240% rallies in both prior instances this cycle, per Ali Martinez’s daily chart analysis. The mechanism is straightforward: the 50-day SMA crossing above the 200-day SMA signals that medium-term momentum has structurally overtaken the long-term trend, historically the inflection point for SUI’s largest sustained moves.
The $4.00 target requires +245% from current price, with $1.80 and $3.00 as the intermediate checkpoints that will define whether the third instance matches its predecessors. Watch $0.72 as the hard invalidation — and watch $1.80 as the first confirmation that the cross is holding.
Disclaimer: The views and analysis presented in this article are for informational purposes only and reflect the author’s perspective, not financial advice. Technical patterns and indicators discussed are subject to market volatility and may or may not yield anticipated results. Investors are advised to exercise caution, conduct independent research, and make decisions aligned with their individual risk tolerance.
SUI trades at $1.15 (+2.96% 24h, $4.72B market cap) as a golden cross forms on the daily chartAnalyst @alicharts flags 50D SMA crossing above 200D SMA — prior two instances produced +240.25% and +222.45% rallies$4.00 price target requires +245% from current $1.15; key resistance at $1.80 and $3.00Invalidation level: $0.72 — a break below negates the golden cross thesis entirely
SUI is trading at $1.15 — up 2.96% in 24 hours — with a market cap of $4.72 billion, as one of the most reliable trend-reversal signals in technical analysis begins to form on its daily chart: a golden cross.
Crypto analyst Ali Martinez (@alicharts) flagged the setup on September 30, 2026, identifying SUI as “on the verge of printing a new golden cross, with the 50-day SMA beginning to cross above the 200-day SMA.” Martinez called it “a major bullish trend signal” that “could mark the beginning of a longer-term bull market” — with a price target of $4.00.
What a Golden Cross Actually Measures
The golden cross is not a price level — it is a momentum event. It occurs when a shorter-term moving average (the 50-day SMA) crosses above a longer-term one (the 200-day SMA), signaling that recent price action has accelerated above the longer-term trend baseline. The 200-day SMA acts as the long-cycle anchor; when the 50-day breaches it from below, it reflects sustained buying pressure that has outpaced months of prior selling.
This matters on the daily chart because the 200-day SMA represents roughly 40 weeks of price history. A cross above it is not noise — it requires a structural shift in momentum to execute.
The Track Record — Two Prior Golden Crosses, Two +220%+ Rallies
The daily chart shared by @alicharts documents SUI’s prior golden cross instances across the 2025 cycle. Both resulted in sustained rallies of comparable magnitude:
Instance Signal Type Rally Produced Golden Cross #1 (2025 Cycle — Early) 50D SMA crosses above 200D SMA +240.25% Golden Cross #2 (2025 Cycle — Mid) 50D SMA crosses above 200D SMA +222.45% Golden Cross #3 (Forming — Sept 2026) 50D SMA crossing above 200D SMA Target: +245% to$4.00
Source: @alicharts daily SUI chart, September 30, 2026
Two-for-two is a track record. The current signal is now forming at a structurally similar setup — a deep correction from prior highs followed by a base at approximately $0.72, now recovering with the 50-day SMA curling upward through the 200-day SMA.
Reading the Chart — Levels That Matter
Ali Martinez’s daily SUI chart reveals the full structure of the current setup. Price bottomed near $0.72 — the key support zone — before recovering to current levels around $1.15–$1.16. Two resistance checkpoints stand between current price and the $4.00 target: $1.80 (first resistance) and $3.00 (second major resistance). The $4.00 target represents a +245% move from the $1.15 entry level.
SUI Daily Chart Analysis | Source: @alicharts (X)
The prior percentage moves annotated on the left side of the chart — the +240.25% and +222.45% labels — represent already-completed rallies from the 2025 cycle peaks, confirming the pattern context. The current formation mirrors those prior launchpad conditions: base established, golden cross imminent, momentum returning.
Key Levels — Support, Resistance, and the Invalidation Line
Three prices define this trade:
$0.72 — Support / Invalidation: The recent cycle low. A sustained breakdown below this level would invalidate the golden cross thesis and suggest the 200-day SMA is not acting as support but rather resistance from below.$1.80 — First Resistance: The initial checkpoint. A clean break and hold above $1.80 on daily closes would confirm the trend reversal is advancing as expected.$3.00 — Second Resistance: The intermediate target before the $4.00 zone. Historical resistance from the 2025 cycle structure. Clearing $3.00 on high volume opens the direct path to Martinez’s target.
Bullish Scenario — Confirmed Golden Cross and $1.80 Reclaim
If SUI’s 50-day SMA completes the cross above the 200-day SMA on a daily close, and price subsequently reclaims and holds $1.80, the pattern aligns with the two prior golden cross instances that each produced 220%–240% gains. From $1.80, the next measured move targets $3.00, then $4.00. The +245% path from current levels to $4.00 is consistent with both prior precedents.
Bearish Scenario — Death Cross Invalidation at $0.72
A failure of the golden cross — where the 50-day SMA stalls and rolls back below the 200-day SMA — combined with a breakdown below the $0.72 support level would negate the current bullish structure entirely. In that scenario, SUI would be printing a failed golden cross, historically a bearish signal when the cross reverses quickly, with downside risk reopening toward prior accumulation zones.
Two-for-Two Becomes Three-for-Three — or Doesn’t
SUI’s golden cross is forming at $1.15 with a documented two-for-two track record of producing +220% to +240% rallies in both prior instances this cycle, per Ali Martinez’s daily chart analysis. The mechanism is straightforward: the 50-day SMA crossing above the 200-day SMA signals that medium-term momentum has structurally overtaken the long-term trend, historically the inflection point for SUI’s largest sustained moves.
The $4.00 target requires +245% from current price, with $1.80 and $3.00 as the intermediate checkpoints that will define whether the third instance matches its predecessors. Watch $0.72 as the hard invalidation — and watch $1.80 as the first confirmation that the cross is holding.
Disclaimer: The views and analysis presented in this article are for informational purposes only and reflect the author’s perspective, not financial advice. Technical patterns and indicators discussed are subject to market volatility and may or may not yield anticipated results. Investors are advised to exercise caution, conduct independent research, and make decisions aligned with their individual risk tolerance.
196
·
--
Məqalə
Tərcüməyə bax
Bitcoin Profit-Taking Hits 2026 High — $80K Is the Line That MattersKey Highlights
Bitcoin's unrealized profit margin hit 33% — a 2026 high and the highest reading since December 2024, per CryptoQuantProfit-taking volume reached its highest point of 2026, with demand metrics simultaneously fading$80,000 is the first critical on-chain support — loss of this level risks a deeper retracement toward $70,000Bull market structure remains intact: Bitcoin is still trading above its realized price on-chain
Bitcoin is trading near $82,600–$83,600 as on-chain data delivers one of its clearest distribution warnings of the year. Traders are locking in gains at the fastest pace since the cycle began, unrealized profit margins have hit a 2026 high of 33%, and demand is measurably softening. The bull market structure remains intact — but the rally is showing real cracks, not sentiment noise.
That assessment comes directly from CryptoQuant, the on-chain analytics platform whose analysts track Bitcoin’s realized profit and loss flows in real time. Their exact words: “Holders are cashing in. Profit-taking just hit a 2026 high, trader unrealized profits reached 33%, and demand is fading. The bull market is intact, but the rally is showing cracks. $80K is the first support to watch.” That is not a hedged observation — it is a declarative, data-backed conclusion with a specific level attached.
The On-Chain Signal — Unrealized Profit Margin at 33%
The Unrealized Profit/Loss Margin measures what percentage of Bitcoin’s circulating supply is sitting in profit relative to its cost basis, expressed as a margin above or below breakeven. When this reading climbs sharply, it signals that a large share of the market is deep in profit — and historically, that is when distribution pressure intensifies as holders convert unrealized gains into realized ones.
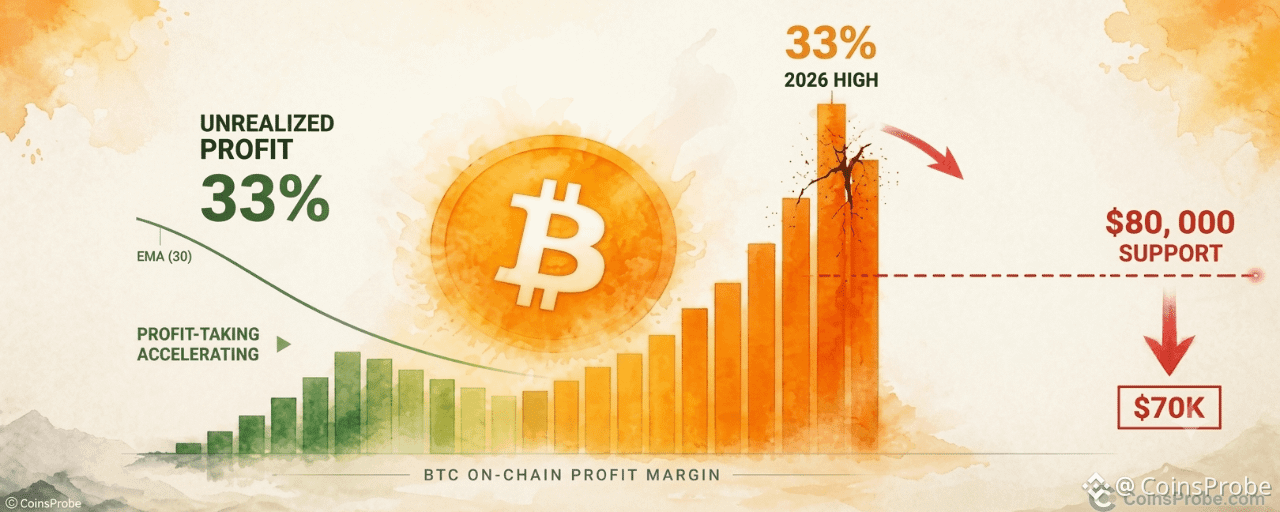
CryptoQuant’s chart shows the margin has reached approximately 33% — the highest reading in 2026 and the highest since December 2024. The green bars representing unrealized profit are expanding while the 30-period EMA on the margin line is curling lower, a configuration that has historically coincided with local tops rather than continuation. Critically, prior 40%+ margin readings — seen during Bitcoin’s run toward $103,000–$105,000 — preceded significant pullbacks, including the correction from roughly $110,000 back toward $75,000. At 33%, the current reading sits just below that historically dangerous threshold, suggesting sellers are active but not yet exhausted.
Bitcoin On-Chain Trader Analysis | Source: @cryptoquant_com (X)
The bull market structural argument remains supported by one key data point: Bitcoin’s price is still trading above its realized price — shown in pink on the CryptoQuant chart — meaning the average coin in circulation was acquired at a lower price than today’s market price. That is the technical definition of a bull market regime on-chain. The warning is not about regime change. It is about near-term distribution within a functioning bull market.
Profit-Taking at a 2026 High — What That Actually Means
Profit-taking metrics measure the volume of Bitcoin being moved on-chain at a price higher than its acquisition cost — in other words, coins moving into exchanges or wallets at a realized gain. When this metric hits a cycle high, it means more Bitcoin is being sold for profit right now than at any prior point in 2026. That is supply entering the market from a position of strength, not panic.
This matters for price because realized profit is not a lagging indicator — it is a direct measure of sell-side pressure. Every Bitcoin sold for profit is a coin that moved from a long-term holder to a shorter-term buyer, typically at or near current market prices. If demand cannot absorb that flow at current levels, price must fall to find clearing prices where buyers are willing to step in. CryptoQuant’s note that demand is fading compounds the concern: rising supply from profit-takers meeting declining new demand is the textbook setup for a near-term correction.
For context on how these dynamics have played out historically, the Bitcoin LTH MVRV analysis at CoinsProbe tracks how long-term holder behavior has historically preceded major price inflections — the current profit-taking surge follows a similar script.
$80,000 — Why This Level Is Structural, Not Arbitrary
CryptoQuant’s designation of $80,000 as the first critical support is grounded in on-chain cost basis data, not technical charting preference. The $80,000 zone represents a dense cluster of realized prices for coins acquired during Bitcoin’s prior accumulation range — meaning a large cohort of holders have a cost basis near this level. A sustained close below $80,000 would push those holders into unrealized loss territory, historically the point at which conviction weakens and selling accelerates.
The chart analysis reinforces this: below $80,000, the next meaningful support cluster sits in the $70,000 zone, with the 12% loss threshold from current levels placing a floor near $60,000 in an extended drawdown scenario. Those are not targets — they are the levels where historical on-chain data shows buyers have previously absorbed distribution pressure and reversed price.
One useful parallel: the $70,000–$75,000 reload zone cited by CryptoQuant’s chart as a potential re-entry area sits just below the $80,000 support. If profit-taking volume does not abate and demand continues to fade, that is the range where compression of the margin toward 0% — a historical capitulation signal — would be expected to emerge.
Bull Market Intact — But Cracks Are Measurable
The distinction CryptoQuant draws is precise and worth preserving. This is not a bear market call. Bitcoin trading above its realized price means the structural bull market regime is technically unchanged. What the data identifies is a local exhaustion signal — a period where the rally has generated enough profit to incentivize mass distribution, and where demand has not kept pace with that supply.
This mirrors the setup that preceded corrections earlier in the cycle. When the margin was at 40%+ near the $103,000–$105,000 resistance zone, the subsequent correction reached $75,000 — a drawdown of approximately 28%. The current 33% margin reading, if it follows the same arc without reaching the 40% threshold, implies a shallower but still meaningful pullback, with $80,000 as the first test.
For traders who have tracked Bitcoin’s demand metrics across timeframes, this aligns with broader observations about cycle behavior — the same on-chain framework that flagged recovery in earlier stress periods is now quantifying the cooling at the top of the rally range.
Bullish Scenario — $80K Holds as Support
If Bitcoin defends the $80,000 level on a closing basis — particularly a weekly close — the profit-taking wave could be absorbed without structural damage. A compression of the unrealized profit margin back toward 20%–25% would signal that distribution has run its course and a new demand cohort has stepped in at lower prices. In that case, the path back toward $103,000–$105,000 resistance reopens, with the prior all-time high zone as the next meaningful target above.
Bearish Scenario — $80K Fails on a Close
A sustained daily or weekly close below $80,000 removes the structural on-chain support that has kept this bull market intact. In that scenario, the chart identifies $70,000 as the next demand zone, with $60,000 representing the 12% loss threshold from realized price — a level that has historically triggered capitulation and forced selling from weaker hands. The margin compression toward 0% in that range would be the on-chain signal to watch for a potential reversal and re-entry.
Bitcoin’s broader on-chain regime has not broken. But the data from CryptoQuant is unambiguous: profit-taking is at a 2026 high, unrealized profit margins are at their most elevated reading since December 2024, and demand is measurably fading. That combination has preceded corrections within bull markets before. Watch $80,000 — a weekly close below it opens the $70,000 test. A hold at $80,000 keeps the continuation case alive.
Disclaimer: The views and analysis presented in this article are for informational purposes only and reflect the author’s perspective, not financial advice. Technical patterns and indicators discussed are subject to market volatility and may or may not yield anticipated results. Investors are advised to exercise caution, conduct independent research, and make decisions aligned with their individual risk tolerance.
Bitcoin Profit-Taking Hits 2026 High — $80K Is the Line That Matters
Key Highlights
Bitcoin's unrealized profit margin hit 33% — a 2026 high and the highest reading since December 2024, per CryptoQuantProfit-taking volume reached its highest point of 2026, with demand metrics simultaneously fading$80,000 is the first critical on-chain support — loss of this level risks a deeper retracement toward $70,000Bull market structure remains intact: Bitcoin is still trading above its realized price on-chain
Bitcoin is trading near $82,600–$83,600 as on-chain data delivers one of its clearest distribution warnings of the year. Traders are locking in gains at the fastest pace since the cycle began, unrealized profit margins have hit a 2026 high of 33%, and demand is measurably softening. The bull market structure remains intact — but the rally is showing real cracks, not sentiment noise.
That assessment comes directly from CryptoQuant, the on-chain analytics platform whose analysts track Bitcoin’s realized profit and loss flows in real time. Their exact words: “Holders are cashing in. Profit-taking just hit a 2026 high, trader unrealized profits reached 33%, and demand is fading. The bull market is intact, but the rally is showing cracks. $80K is the first support to watch.” That is not a hedged observation — it is a declarative, data-backed conclusion with a specific level attached.
The On-Chain Signal — Unrealized Profit Margin at 33%
The Unrealized Profit/Loss Margin measures what percentage of Bitcoin’s circulating supply is sitting in profit relative to its cost basis, expressed as a margin above or below breakeven. When this reading climbs sharply, it signals that a large share of the market is deep in profit — and historically, that is when distribution pressure intensifies as holders convert unrealized gains into realized ones.
CryptoQuant’s chart shows the margin has reached approximately 33% — the highest reading in 2026 and the highest since December 2024. The green bars representing unrealized profit are expanding while the 30-period EMA on the margin line is curling lower, a configuration that has historically coincided with local tops rather than continuation. Critically, prior 40%+ margin readings — seen during Bitcoin’s run toward $103,000–$105,000 — preceded significant pullbacks, including the correction from roughly $110,000 back toward $75,000. At 33%, the current reading sits just below that historically dangerous threshold, suggesting sellers are active but not yet exhausted.
Bitcoin On-Chain Trader Analysis | Source: @cryptoquant_com (X)
The bull market structural argument remains supported by one key data point: Bitcoin’s price is still trading above its realized price — shown in pink on the CryptoQuant chart — meaning the average coin in circulation was acquired at a lower price than today’s market price. That is the technical definition of a bull market regime on-chain. The warning is not about regime change. It is about near-term distribution within a functioning bull market.
Profit-Taking at a 2026 High — What That Actually Means
Profit-taking metrics measure the volume of Bitcoin being moved on-chain at a price higher than its acquisition cost — in other words, coins moving into exchanges or wallets at a realized gain. When this metric hits a cycle high, it means more Bitcoin is being sold for profit right now than at any prior point in 2026. That is supply entering the market from a position of strength, not panic.
This matters for price because realized profit is not a lagging indicator — it is a direct measure of sell-side pressure. Every Bitcoin sold for profit is a coin that moved from a long-term holder to a shorter-term buyer, typically at or near current market prices. If demand cannot absorb that flow at current levels, price must fall to find clearing prices where buyers are willing to step in. CryptoQuant’s note that demand is fading compounds the concern: rising supply from profit-takers meeting declining new demand is the textbook setup for a near-term correction.
For context on how these dynamics have played out historically, the Bitcoin LTH MVRV analysis at CoinsProbe tracks how long-term holder behavior has historically preceded major price inflections — the current profit-taking surge follows a similar script.
$80,000 — Why This Level Is Structural, Not Arbitrary
CryptoQuant’s designation of $80,000 as the first critical support is grounded in on-chain cost basis data, not technical charting preference. The $80,000 zone represents a dense cluster of realized prices for coins acquired during Bitcoin’s prior accumulation range — meaning a large cohort of holders have a cost basis near this level. A sustained close below $80,000 would push those holders into unrealized loss territory, historically the point at which conviction weakens and selling accelerates.
The chart analysis reinforces this: below $80,000, the next meaningful support cluster sits in the $70,000 zone, with the 12% loss threshold from current levels placing a floor near $60,000 in an extended drawdown scenario. Those are not targets — they are the levels where historical on-chain data shows buyers have previously absorbed distribution pressure and reversed price.
One useful parallel: the $70,000–$75,000 reload zone cited by CryptoQuant’s chart as a potential re-entry area sits just below the $80,000 support. If profit-taking volume does not abate and demand continues to fade, that is the range where compression of the margin toward 0% — a historical capitulation signal — would be expected to emerge.
Bull Market Intact — But Cracks Are Measurable
The distinction CryptoQuant draws is precise and worth preserving. This is not a bear market call. Bitcoin trading above its realized price means the structural bull market regime is technically unchanged. What the data identifies is a local exhaustion signal — a period where the rally has generated enough profit to incentivize mass distribution, and where demand has not kept pace with that supply.
This mirrors the setup that preceded corrections earlier in the cycle. When the margin was at 40%+ near the $103,000–$105,000 resistance zone, the subsequent correction reached $75,000 — a drawdown of approximately 28%. The current 33% margin reading, if it follows the same arc without reaching the 40% threshold, implies a shallower but still meaningful pullback, with $80,000 as the first test.
For traders who have tracked Bitcoin’s demand metrics across timeframes, this aligns with broader observations about cycle behavior — the same on-chain framework that flagged recovery in earlier stress periods is now quantifying the cooling at the top of the rally range.
Bullish Scenario — $80K Holds as Support
If Bitcoin defends the $80,000 level on a closing basis — particularly a weekly close — the profit-taking wave could be absorbed without structural damage. A compression of the unrealized profit margin back toward 20%–25% would signal that distribution has run its course and a new demand cohort has stepped in at lower prices. In that case, the path back toward $103,000–$105,000 resistance reopens, with the prior all-time high zone as the next meaningful target above.
Bearish Scenario — $80K Fails on a Close
A sustained daily or weekly close below $80,000 removes the structural on-chain support that has kept this bull market intact. In that scenario, the chart identifies $70,000 as the next demand zone, with $60,000 representing the 12% loss threshold from realized price — a level that has historically triggered capitulation and forced selling from weaker hands. The margin compression toward 0% in that range would be the on-chain signal to watch for a potential reversal and re-entry.
Bitcoin’s broader on-chain regime has not broken. But the data from CryptoQuant is unambiguous: profit-taking is at a 2026 high, unrealized profit margins are at their most elevated reading since December 2024, and demand is measurably fading. That combination has preceded corrections within bull markets before. Watch $80,000 — a weekly close below it opens the $70,000 test. A hold at $80,000 keeps the continuation case alive.
Disclaimer: The views and analysis presented in this article are for informational purposes only and reflect the author’s perspective, not financial advice. Technical patterns and indicators discussed are subject to market volatility and may or may not yield anticipated results. Investors are advised to exercise caution, conduct independent research, and make decisions aligned with their individual risk tolerance.
Bitcoin's unrealized profit margin hit 33% — a 2026 high and the highest reading since December 2024, per CryptoQuantProfit-taking volume reached its highest point of 2026, with demand metrics simultaneously fading$80,000 is the first critical on-chain support — loss of this level risks a deeper retracement toward $70,000Bull market structure remains intact: Bitcoin is still trading above its realized price on-chain
Bitcoin is trading near $82,600–$83,600 as on-chain data delivers one of its clearest distribution warnings of the year. Traders are locking in gains at the fastest pace since the cycle began, unrealized profit margins have hit a 2026 high of 33%, and demand is measurably softening. The bull market structure remains intact — but the rally is showing real cracks, not sentiment noise.
That assessment comes directly from CryptoQuant, the on-chain analytics platform whose analysts track Bitcoin’s realized profit and loss flows in real time. Their exact words: “Holders are cashing in. Profit-taking just hit a 2026 high, trader unrealized profits reached 33%, and demand is fading. The bull market is intact, but the rally is showing cracks. $80K is the first support to watch.” That is not a hedged observation — it is a declarative, data-backed conclusion with a specific level attached.
The On-Chain Signal — Unrealized Profit Margin at 33%
The Unrealized Profit/Loss Margin measures what percentage of Bitcoin’s circulating supply is sitting in profit relative to its cost basis, expressed as a margin above or below breakeven. When this reading climbs sharply, it signals that a large share of the market is deep in profit — and historically, that is when distribution pressure intensifies as holders convert unrealized gains into realized ones.
CryptoQuant’s chart shows the margin has reached approximately 33% — the highest reading in 2026 and the highest since December 2024. The green bars representing unrealized profit are expanding while the 30-period EMA on the margin line is curling lower, a configuration that has historically coincided with local tops rather than continuation. Critically, prior 40%+ margin readings — seen during Bitcoin’s run toward $103,000–$105,000 — preceded significant pullbacks, including the correction from roughly $110,000 back toward $75,000. At 33%, the current reading sits just below that historically dangerous threshold, suggesting sellers are active but not yet exhausted.
Bitcoin On-Chain Trader Analysis | Source: @cryptoquant_com (X)
The bull market structural argument remains supported by one key data point: Bitcoin’s price is still trading above its realized price — shown in pink on the CryptoQuant chart — meaning the average coin in circulation was acquired at a lower price than today’s market price. That is the technical definition of a bull market regime on-chain. The warning is not about regime change. It is about near-term distribution within a functioning bull market.
Profit-Taking at a 2026 High — What That Actually Means
Profit-taking metrics measure the volume of Bitcoin being moved on-chain at a price higher than its acquisition cost — in other words, coins moving into exchanges or wallets at a realized gain. When this metric hits a cycle high, it means more Bitcoin is being sold for profit right now than at any prior point in 2026. That is supply entering the market from a position of strength, not panic.
This matters for price because realized profit is not a lagging indicator — it is a direct measure of sell-side pressure. Every Bitcoin sold for profit is a coin that moved from a long-term holder to a shorter-term buyer, typically at or near current market prices. If demand cannot absorb that flow at current levels, price must fall to find clearing prices where buyers are willing to step in. CryptoQuant’s note that demand is fading compounds the concern: rising supply from profit-takers meeting declining new demand is the textbook setup for a near-term correction.
For context on how these dynamics have played out historically, the Bitcoin LTH MVRV analysis at CoinsProbe tracks how long-term holder behavior has historically preceded major price inflections — the current profit-taking surge follows a similar script.
$80,000 — Why This Level Is Structural, Not Arbitrary
CryptoQuant’s designation of $80,000 as the first critical support is grounded in on-chain cost basis data, not technical charting preference. The $80,000 zone represents a dense cluster of realized prices for coins acquired during Bitcoin’s prior accumulation range — meaning a large cohort of holders have a cost basis near this level. A sustained close below $80,000 would push those holders into unrealized loss territory, historically the point at which conviction weakens and selling accelerates.
The chart analysis reinforces this: below $80,000, the next meaningful support cluster sits in the $70,000 zone, with the 12% loss threshold from current levels placing a floor near $60,000 in an extended drawdown scenario. Those are not targets — they are the levels where historical on-chain data shows buyers have previously absorbed distribution pressure and reversed price.
One useful parallel: the $70,000–$75,000 reload zone cited by CryptoQuant’s chart as a potential re-entry area sits just below the $80,000 support. If profit-taking volume does not abate and demand continues to fade, that is the range where compression of the margin toward 0% — a historical capitulation signal — would be expected to emerge.
Bull Market Intact — But Cracks Are Measurable
The distinction CryptoQuant draws is precise and worth preserving. This is not a bear market call. Bitcoin trading above its realized price means the structural bull market regime is technically unchanged. What the data identifies is a local exhaustion signal — a period where the rally has generated enough profit to incentivize mass distribution, and where demand has not kept pace with that supply.
This mirrors the setup that preceded corrections earlier in the cycle. When the margin was at 40%+ near the $103,000–$105,000 resistance zone, the subsequent correction reached $75,000 — a drawdown of approximately 28%. The current 33% margin reading, if it follows the same arc without reaching the 40% threshold, implies a shallower but still meaningful pullback, with $80,000 as the first test.
For traders who have tracked Bitcoin’s demand metrics across timeframes, this aligns with broader observations about cycle behavior — the same on-chain framework that flagged recovery in earlier stress periods is now quantifying the cooling at the top of the rally range.
Bullish Scenario — $80K Holds as Support
If Bitcoin defends the $80,000 level on a closing basis — particularly a weekly close — the profit-taking wave could be absorbed without structural damage. A compression of the unrealized profit margin back toward 20%–25% would signal that distribution has run its course and a new demand cohort has stepped in at lower prices. In that case, the path back toward $103,000–$105,000 resistance reopens, with the prior all-time high zone as the next meaningful target above.
Bearish Scenario — $80K Fails on a Close
A sustained daily or weekly close below $80,000 removes the structural on-chain support that has kept this bull market intact. In that scenario, the chart identifies $70,000 as the next demand zone, with $60,000 representing the 12% loss threshold from realized price — a level that has historically triggered capitulation and forced selling from weaker hands. The margin compression toward 0% in that range would be the on-chain signal to watch for a potential reversal and re-entry.
Bitcoin’s broader on-chain regime has not broken. But the data from CryptoQuant is unambiguous: profit-taking is at a 2026 high, unrealized profit margins are at their most elevated reading since December 2024, and demand is measurably fading. That combination has preceded corrections within bull markets before. Watch $80,000 — a weekly close below it opens the $70,000 test. A hold at $80,000 keeps the continuation case alive.
Disclaimer: The views and analysis presented in this article are for informational purposes only and reflect the author’s perspective, not financial advice. Technical patterns and indicators discussed are subject to market volatility and may or may not yield anticipated results. Investors are advised to exercise caution, conduct independent research, and make decisions aligned with their individual risk tolerance.
103
·
--
Məqalə
Tərcüməyə bax
AVAX Reclaims Key Horizontal — Analyst Eyes $25, $65, and $147 TargetsKey Highlights
AVAX trades at $11.56 after reclaiming $9 horizontal support — the Summer 2026 cycle lowAnalyst CryptoBullet1 sets three targets: $25 (+116%), $65 (+462%), $147 (+1,171%) from current price$9 is the thesis anchor — a weekly close below invalidates the entire bullish structureDescending trendline from 2022 sits at $22–$25 — a weekly close above is the first confirmation trigger
Avalanche (AVAX) is trading at approximately $11.56 — holding above the $9 horizontal support level that defined the Summer 2026 cycle low. The reclaim of that level is not a minor technical development: it is the structural reset that one analyst argues marks the end of AVAX’s worst drawdown in this cycle.
That analyst is CryptoBullet1 (@CryptoBullet1), who flagged the move on September 29, 2026. His exact words: “I doubt that $AVAX will return to those Summer 2026 prices. IMO the worst is over for $AVAX holders.” He set three sequential price targets: $25, $65, and $147 — implying upside of +116%, +462%, and +1,171% from current levels respectively.
The Signal — A Liquidity Sweep Below $9, Then a Reclaim
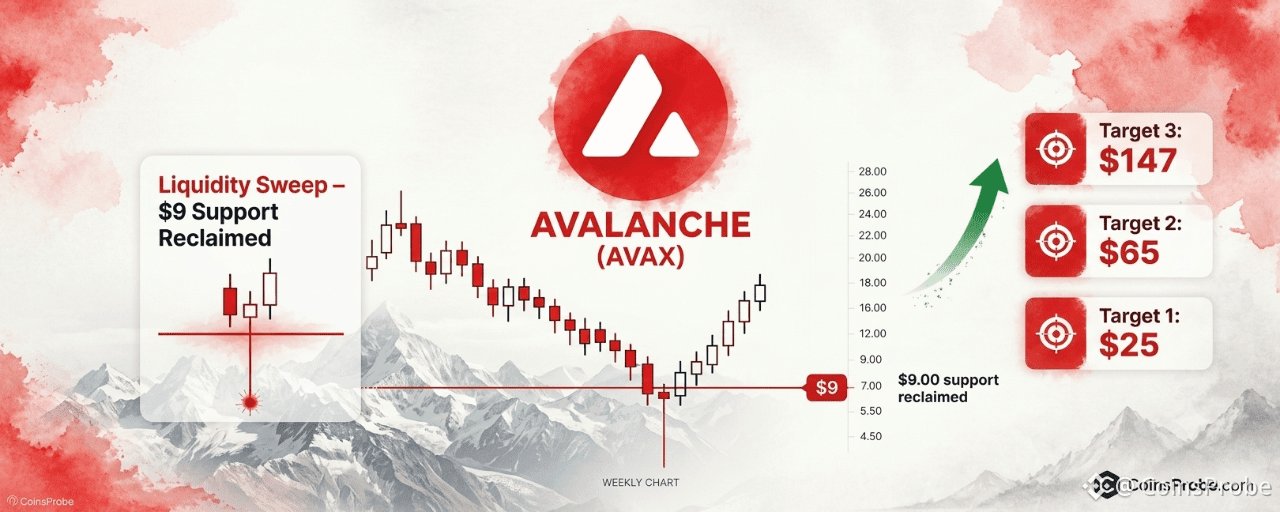
The weekly AVAX/USDT chart on Binance tells a specific structural story. During the summer of 2026, price wicked below the $9 horizontal support — a classic liquidity grab that swept stop-losses and retail exits accumulated beneath that level. The candle closed back above $9, and AVAX has since been consolidating above it.
This is not a breakout. It is a reclaim. The distinction matters. A reclaim confirms that the prior support held on a closing basis after being tested — it is a stronger signal than a simple bounce, because it demonstrates sustained buying interest at that zone rather than a momentary reaction.
CryptoBullet1’s weekly chart shows the $9 horizontal as a thick black support line, with a visible wick extending below it during the Summer 2026 low. Price is now consolidating above that line, facing a descending dotted resistance trendline that originates from AVAX’s 2022 highs and currently sits in the $22–$25 zone.
AVAX/USDT Weekly Analysis | Source: @CryptoBullet1 (X)
The Three Targets — What Each One Represents
The three targets are not arbitrary. They map to specific structural levels on the weekly chart, with each representing a distinct phase of the recovery thesis.
Target Price Upside from$11.56 Significance Target 1 $25 +116% Descending resistance trendline breakout zone Target 2 $65 +462% Mid-cycle resistance from 2023–2024 consolidation Target 3 $147 +1,171% Macro cycle target — near prior all-time high zone
Source: @CryptoBullet1 (X) — AVAX/USDT Weekly, Binance
Target 1 at $25 is the most structurally significant near-term level. The descending trendline from 2022 currently intersects in the $22–$25 range on the weekly timeframe. A sustained weekly close above $25 would confirm a trendline breakout — the structural precondition for the larger moves toward $65 and $147. Without that close, the descending resistance remains intact and the recovery thesis stays untested at its first major hurdle.
Why the $9 Level Is the Thesis Anchor
Every part of this analysis depends on $9 holding. CryptoBullet1’s argument that “the worst is over” is predicated entirely on the liquidity sweep being a one-time event — a terminal flush that cleared weak hands and established a cycle low. If AVAX returns below $9 on a weekly closing basis, that interpretation is invalidated.
The mechanism behind the liquidity grab matters here. When price briefly traded below $9, it triggered stop-losses placed by traders who had bought the $9 support zone across previous months. That cascade of selling — representing genuine exits, not just paper losses — is what CryptoBullet1 identifies as the capitulation event. The wick-and-recover pattern on the weekly chart is the visual evidence that buyers stepped in at exactly those prices, absorbing the stop-loss cascade and pushing price back above the level within the same weekly candle.
The Descending Trendline — The One Obstacle
The bullish thesis from $11.56 to $147 is not a straight line. The descending resistance trendline — drawn from the 2022 highs through subsequent lower highs — currently intersects the $22–$25 zone on the weekly chart. This is the structural barrier that separates Target 1 from the current price.
Until AVAX closes a weekly candle above $25, the trendline remains unbroken. A rejection at that trendline without a weekly close above it would mean the recovery from the Summer 2026 low has stalled at its first major test. That is not a thesis-killer — it would simply mean a longer consolidation period before the eventual breakout — but it would delay the timeline for Targets 2 and 3 significantly.
AVAX’s longer-term narrative has evolved considerably over the past year. For context on what has changed in the ecosystem, read our piece on what has replaced the Avalanche hype among top altcoins.
Bullish Scenario — Weekly Close Above $25
A sustained weekly close above $25 confirms the descending trendline breakout that has capped AVAX since 2022. That opens the measured move toward $65 as the next structural target — a level representing the 2023–2024 mid-cycle resistance zone. From $65, a continuation toward the $147 macro target becomes technically viable, consistent with CryptoBullet1’s full three-stage recovery thesis.
Bearish Scenario — Weekly Close Below $9
A confirmed weekly close below $9 invalidates the liquidity-sweep-as-bottom interpretation entirely. It would mean the Summer 2026 wick was not a terminal flush but a temporary pause before further downside. In that scenario, the next meaningful support would need to be identified from lower timeframe structure, and the three targets outlined above would require reassessment from a lower base.
The Recovery Thesis in Summary
CryptoBullet1’s analysis presents a staged recovery structure: the Summer 2026 liquidity sweep at $9 marks the cycle low → price reclaims $9 support on a closing basis → consolidation builds above support → price tests and breaks the descending trendline at $25 → staged moves toward $65 and then $147 follow. Each stage requires the prior stage to complete before it becomes active. The thesis is linear and binary: $9 holds or it doesn’t.
At $11.56, AVAX sits 116% below Target 1, 462% below Target 2, and 1,171% below the main target of $147. The reclaim of $9 has occurred. The next confirmation event is a weekly close above $25 — the descending trendline breakout that would validate the full recovery structure. Until that close is printed, the thesis is intact but unconfirmed at its first major test. Watch $9 as the invalidation level and $25 as the first confirmation that the worst is structurally behind AVAX holders.
Disclaimer: The views and analysis presented in this article are for informational purposes only and reflect the author’s perspective, not financial advice. Technical patterns and indicators discussed are subject to market volatility and may or may not yield anticipated results. Investors are advised to exercise caution, conduct independent research, and make decisions aligned with their individual risk tolerance.
AVAX Reclaims Key Horizontal — Analyst Eyes $25, $65, and $147 Targets
Key Highlights
AVAX trades at $11.56 after reclaiming $9 horizontal support — the Summer 2026 cycle lowAnalyst CryptoBullet1 sets three targets: $25 (+116%), $65 (+462%), $147 (+1,171%) from current price$9 is the thesis anchor — a weekly close below invalidates the entire bullish structureDescending trendline from 2022 sits at $22–$25 — a weekly close above is the first confirmation trigger
Avalanche (AVAX) is trading at approximately $11.56 — holding above the $9 horizontal support level that defined the Summer 2026 cycle low. The reclaim of that level is not a minor technical development: it is the structural reset that one analyst argues marks the end of AVAX’s worst drawdown in this cycle.
That analyst is CryptoBullet1 (@CryptoBullet1), who flagged the move on September 29, 2026. His exact words: “I doubt that $AVAX will return to those Summer 2026 prices. IMO the worst is over for $AVAX holders.” He set three sequential price targets: $25, $65, and $147 — implying upside of +116%, +462%, and +1,171% from current levels respectively.
The Signal — A Liquidity Sweep Below $9, Then a Reclaim
The weekly AVAX/USDT chart on Binance tells a specific structural story. During the summer of 2026, price wicked below the $9 horizontal support — a classic liquidity grab that swept stop-losses and retail exits accumulated beneath that level. The candle closed back above $9, and AVAX has since been consolidating above it.
This is not a breakout. It is a reclaim. The distinction matters. A reclaim confirms that the prior support held on a closing basis after being tested — it is a stronger signal than a simple bounce, because it demonstrates sustained buying interest at that zone rather than a momentary reaction.
CryptoBullet1’s weekly chart shows the $9 horizontal as a thick black support line, with a visible wick extending below it during the Summer 2026 low. Price is now consolidating above that line, facing a descending dotted resistance trendline that originates from AVAX’s 2022 highs and currently sits in the $22–$25 zone.
AVAX/USDT Weekly Analysis | Source: @CryptoBullet1 (X)
The Three Targets — What Each One Represents
The three targets are not arbitrary. They map to specific structural levels on the weekly chart, with each representing a distinct phase of the recovery thesis.
Target Price Upside from$11.56 Significance Target 1 $25 +116% Descending resistance trendline breakout zone Target 2 $65 +462% Mid-cycle resistance from 2023–2024 consolidation Target 3 $147 +1,171% Macro cycle target — near prior all-time high zone
Source: @CryptoBullet1 (X) — AVAX/USDT Weekly, Binance
Target 1 at $25 is the most structurally significant near-term level. The descending trendline from 2022 currently intersects in the $22–$25 range on the weekly timeframe. A sustained weekly close above $25 would confirm a trendline breakout — the structural precondition for the larger moves toward $65 and $147. Without that close, the descending resistance remains intact and the recovery thesis stays untested at its first major hurdle.
Why the $9 Level Is the Thesis Anchor
Every part of this analysis depends on $9 holding. CryptoBullet1’s argument that “the worst is over” is predicated entirely on the liquidity sweep being a one-time event — a terminal flush that cleared weak hands and established a cycle low. If AVAX returns below $9 on a weekly closing basis, that interpretation is invalidated.
The mechanism behind the liquidity grab matters here. When price briefly traded below $9, it triggered stop-losses placed by traders who had bought the $9 support zone across previous months. That cascade of selling — representing genuine exits, not just paper losses — is what CryptoBullet1 identifies as the capitulation event. The wick-and-recover pattern on the weekly chart is the visual evidence that buyers stepped in at exactly those prices, absorbing the stop-loss cascade and pushing price back above the level within the same weekly candle.
The Descending Trendline — The One Obstacle
The bullish thesis from $11.56 to $147 is not a straight line. The descending resistance trendline — drawn from the 2022 highs through subsequent lower highs — currently intersects the $22–$25 zone on the weekly chart. This is the structural barrier that separates Target 1 from the current price.
Until AVAX closes a weekly candle above $25, the trendline remains unbroken. A rejection at that trendline without a weekly close above it would mean the recovery from the Summer 2026 low has stalled at its first major test. That is not a thesis-killer — it would simply mean a longer consolidation period before the eventual breakout — but it would delay the timeline for Targets 2 and 3 significantly.
AVAX’s longer-term narrative has evolved considerably over the past year. For context on what has changed in the ecosystem, read our piece on what has replaced the Avalanche hype among top altcoins.
Bullish Scenario — Weekly Close Above $25
A sustained weekly close above $25 confirms the descending trendline breakout that has capped AVAX since 2022. That opens the measured move toward $65 as the next structural target — a level representing the 2023–2024 mid-cycle resistance zone. From $65, a continuation toward the $147 macro target becomes technically viable, consistent with CryptoBullet1’s full three-stage recovery thesis.
Bearish Scenario — Weekly Close Below $9
A confirmed weekly close below $9 invalidates the liquidity-sweep-as-bottom interpretation entirely. It would mean the Summer 2026 wick was not a terminal flush but a temporary pause before further downside. In that scenario, the next meaningful support would need to be identified from lower timeframe structure, and the three targets outlined above would require reassessment from a lower base.
The Recovery Thesis in Summary
CryptoBullet1’s analysis presents a staged recovery structure: the Summer 2026 liquidity sweep at $9 marks the cycle low → price reclaims $9 support on a closing basis → consolidation builds above support → price tests and breaks the descending trendline at $25 → staged moves toward $65 and then $147 follow. Each stage requires the prior stage to complete before it becomes active. The thesis is linear and binary: $9 holds or it doesn’t.
At $11.56, AVAX sits 116% below Target 1, 462% below Target 2, and 1,171% below the main target of $147. The reclaim of $9 has occurred. The next confirmation event is a weekly close above $25 — the descending trendline breakout that would validate the full recovery structure. Until that close is printed, the thesis is intact but unconfirmed at its first major test. Watch $9 as the invalidation level and $25 as the first confirmation that the worst is structurally behind AVAX holders.
Disclaimer: The views and analysis presented in this article are for informational purposes only and reflect the author’s perspective, not financial advice. Technical patterns and indicators discussed are subject to market volatility and may or may not yield anticipated results. Investors are advised to exercise caution, conduct independent research, and make decisions aligned with their individual risk tolerance.
AVAX trades at $11.56 after reclaiming $9 horizontal support — the Summer 2026 cycle lowAnalyst CryptoBullet1 sets three targets: $25 (+116%), $65 (+462%), $147 (+1,171%) from current price$9 is the thesis anchor — a weekly close below invalidates the entire bullish structureDescending trendline from 2022 sits at $22–$25 — a weekly close above is the first confirmation trigger
Avalanche (AVAX) is trading at approximately $11.56 — holding above the $9 horizontal support level that defined the Summer 2026 cycle low. The reclaim of that level is not a minor technical development: it is the structural reset that one analyst argues marks the end of AVAX’s worst drawdown in this cycle.
That analyst is CryptoBullet1 (@CryptoBullet1), who flagged the move on September 29, 2026. His exact words: “I doubt that $AVAX will return to those Summer 2026 prices. IMO the worst is over for $AVAX holders.” He set three sequential price targets: $25, $65, and $147 — implying upside of +116%, +462%, and +1,171% from current levels respectively.
The Signal — A Liquidity Sweep Below $9, Then a Reclaim
The weekly AVAX/USDT chart on Binance tells a specific structural story. During the summer of 2026, price wicked below the $9 horizontal support — a classic liquidity grab that swept stop-losses and retail exits accumulated beneath that level. The candle closed back above $9, and AVAX has since been consolidating above it.
This is not a breakout. It is a reclaim. The distinction matters. A reclaim confirms that the prior support held on a closing basis after being tested — it is a stronger signal than a simple bounce, because it demonstrates sustained buying interest at that zone rather than a momentary reaction.
CryptoBullet1’s weekly chart shows the $9 horizontal as a thick black support line, with a visible wick extending below it during the Summer 2026 low. Price is now consolidating above that line, facing a descending dotted resistance trendline that originates from AVAX’s 2022 highs and currently sits in the $22–$25 zone.
AVAX/USDT Weekly Analysis | Source: @CryptoBullet1 (X)
The Three Targets — What Each One Represents
The three targets are not arbitrary. They map to specific structural levels on the weekly chart, with each representing a distinct phase of the recovery thesis.
Target Price Upside from$11.56 Significance Target 1 $25 +116% Descending resistance trendline breakout zone Target 2 $65 +462% Mid-cycle resistance from 2023–2024 consolidation Target 3 $147 +1,171% Macro cycle target — near prior all-time high zone
Source: @CryptoBullet1 (X) — AVAX/USDT Weekly, Binance
Target 1 at $25 is the most structurally significant near-term level. The descending trendline from 2022 currently intersects in the $22–$25 range on the weekly timeframe. A sustained weekly close above $25 would confirm a trendline breakout — the structural precondition for the larger moves toward $65 and $147. Without that close, the descending resistance remains intact and the recovery thesis stays untested at its first major hurdle.
Why the $9 Level Is the Thesis Anchor
Every part of this analysis depends on $9 holding. CryptoBullet1’s argument that “the worst is over” is predicated entirely on the liquidity sweep being a one-time event — a terminal flush that cleared weak hands and established a cycle low. If AVAX returns below $9 on a weekly closing basis, that interpretation is invalidated.
The mechanism behind the liquidity grab matters here. When price briefly traded below $9, it triggered stop-losses placed by traders who had bought the $9 support zone across previous months. That cascade of selling — representing genuine exits, not just paper losses — is what CryptoBullet1 identifies as the capitulation event. The wick-and-recover pattern on the weekly chart is the visual evidence that buyers stepped in at exactly those prices, absorbing the stop-loss cascade and pushing price back above the level within the same weekly candle.
The Descending Trendline — The One Obstacle
The bullish thesis from $11.56 to $147 is not a straight line. The descending resistance trendline — drawn from the 2022 highs through subsequent lower highs — currently intersects the $22–$25 zone on the weekly chart. This is the structural barrier that separates Target 1 from the current price.
Until AVAX closes a weekly candle above $25, the trendline remains unbroken. A rejection at that trendline without a weekly close above it would mean the recovery from the Summer 2026 low has stalled at its first major test. That is not a thesis-killer — it would simply mean a longer consolidation period before the eventual breakout — but it would delay the timeline for Targets 2 and 3 significantly.
AVAX’s longer-term narrative has evolved considerably over the past year. For context on what has changed in the ecosystem, read our piece on what has replaced the Avalanche hype among top altcoins.
Bullish Scenario — Weekly Close Above $25
A sustained weekly close above $25 confirms the descending trendline breakout that has capped AVAX since 2022. That opens the measured move toward $65 as the next structural target — a level representing the 2023–2024 mid-cycle resistance zone. From $65, a continuation toward the $147 macro target becomes technically viable, consistent with CryptoBullet1’s full three-stage recovery thesis.
Bearish Scenario — Weekly Close Below $9
A confirmed weekly close below $9 invalidates the liquidity-sweep-as-bottom interpretation entirely. It would mean the Summer 2026 wick was not a terminal flush but a temporary pause before further downside. In that scenario, the next meaningful support would need to be identified from lower timeframe structure, and the three targets outlined above would require reassessment from a lower base.
The Recovery Thesis in Summary
CryptoBullet1’s analysis presents a staged recovery structure: the Summer 2026 liquidity sweep at $9 marks the cycle low → price reclaims $9 support on a closing basis → consolidation builds above support → price tests and breaks the descending trendline at $25 → staged moves toward $65 and then $147 follow. Each stage requires the prior stage to complete before it becomes active. The thesis is linear and binary: $9 holds or it doesn’t.
At $11.56, AVAX sits 116% below Target 1, 462% below Target 2, and 1,171% below the main target of $147. The reclaim of $9 has occurred. The next confirmation event is a weekly close above $25 — the descending trendline breakout that would validate the full recovery structure. Until that close is printed, the thesis is intact but unconfirmed at its first major test. Watch $9 as the invalidation level and $25 as the first confirmation that the worst is structurally behind AVAX holders.
Disclaimer: The views and analysis presented in this article are for informational purposes only and reflect the author’s perspective, not financial advice. Technical patterns and indicators discussed are subject to market volatility and may or may not yield anticipated results. Investors are advised to exercise caution, conduct independent research, and make decisions aligned with their individual risk tolerance.
1
314
·
--
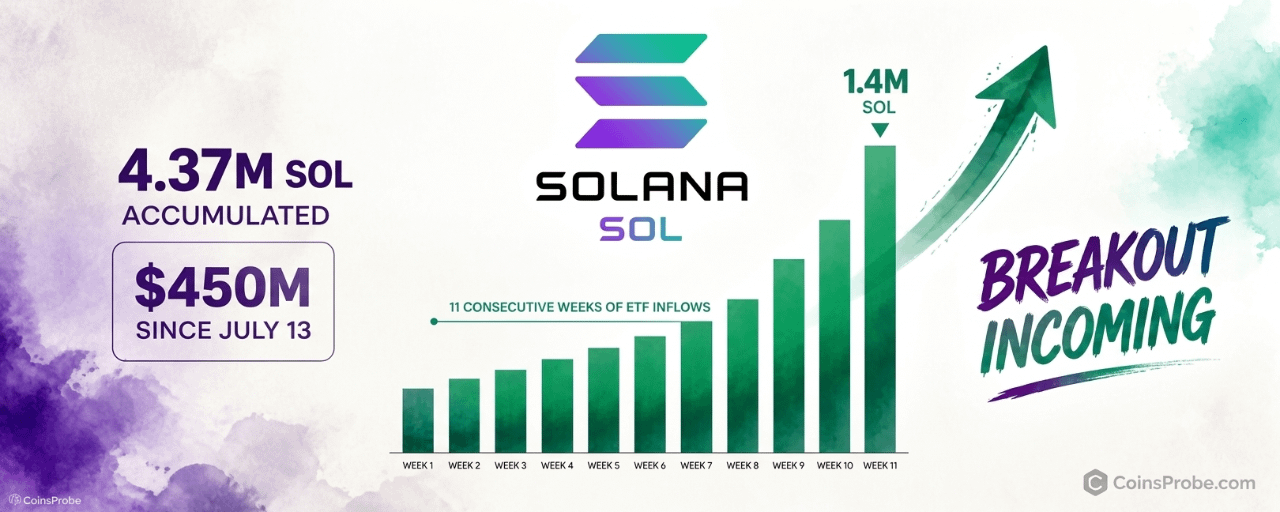
Məqalə
Tərcüməyə bax
Solana ETF Inflows Hit 11 Straight Weeks — Is a Breakout Incoming?Key Highlights
US Spot Solana ETFs accumulated 4.37M SOL (~$450M) since July 13 — 11 consecutive weeks of net inflowsSeptember 21 recorded the largest single-week ETF inflow on the chart: ~1.35–1.4M SOL, an accelerating trendAnalyst @alicharts flags 11 straight inflow weeks and is watching the next leg higher toward $150Watch for ETF weekly inflow continuation above 1M SOL — first negative week breaks the 11-streak thesis
Solana is building a case that institutional money is not rotating out — it is accelerating in. US Spot Solana ETFs have absorbed approximately 4.37 million SOL, worth around $450 million, since July 13, marking 11 consecutive weeks of net inflows with no interruption.
Crypto analyst Ali Martinez (@alicharts) flags the streak directly: “US Spot Solana ETFs have accumulated roughly 4.37 million $SOL, worth around $450 million, since July 13. That marks 11 consecutive weeks of net inflows. With institutional demand continuing to absorb Solana, I’m watching for the next leg higher toward $150.”
His framing is unambiguous: this is a supply absorption event, not a sentiment trade.
The ETF Flow Data — What 11 Consecutive Weeks Actually Means
ETF net inflows measure the difference between new capital entering a fund and capital exiting it each week. A single week of inflows can be noise. Three weeks is a trend. Eleven consecutive weeks with zero negative bars is a structural statement about institutional conviction.
The flow chart shared by @alicharts covers weekly ETF data from August 3 through September 21, 2026. What it shows is not a flat accumulation trend — it is an accelerating one. Inflows surged to approximately 1.2 million SOL in the week ending August 24, pulled back modestly into August 31, then hit their highest single-week reading of the entire series at the September 21 bar: an estimated 1.35 to 1.4 million SOL — the strongest institutional weekly buy on record for US Spot Solana ETFs.
SOL ETF Net Flows Analysis | Source: @alicharts (X)
The acceleration matters. If institutional buyers were simply holding a position, inflows would flatten. Instead the final data point on this chart is the largest. That is not consolidation — that is demand expanding at the margin.
Why Supply Absorption Changes the Price Equation
At 4.37 million SOL accumulated since July 13, US Spot ETFs have removed a measurable portion of liquid supply from the open market. This is the direct mechanism connecting ETF inflows to price: spot ETFs must hold the underlying asset, meaning every unit of net inflow represents SOL physically purchased and held off exchange.
The math is straightforward. At approximately $103 per SOL (the implied price from $450M across 4.37M SOL), institutional buyers have been averaging in throughout a range and are now sitting on a position that dwarfs typical retail accumulation events. For context, a single on-chain whale trade that attracted significant attention involved a SOL trader sitting on a $23M unrealized gain from a $67.88M 20x long — the ETF accumulation at $450M is an order of magnitude larger.
When supply tightens and a single demand cohort (in this case, regulated US ETF vehicles) is buying consistently without selling, the price required to source additional SOL rises. That is not a prediction — it is an arithmetic consequence of supply and demand.
ETF Inflows as a Leading Signal — And Its Limitations
ETF flow data is a sentiment and demand indicator, not a direct price trigger. The distinction matters. Inflows confirm that institutional buyers have been active — they do not guarantee that price will respond immediately or proportionally.
What the 11-week streak does confirm with certainty:
Sustained demand: No single week of outflows across the entire accumulation period since July 13Accelerating pace: The September 21 weekly bar (~1.35–1.4M SOL) is the highest on the entire chartScale: $450 million in ETF-driven spot buying represents institutional-grade conviction, not retail positioning
What it does not confirm: the exact price level at which the market reprices this demand, or the timing of any breakout move. ETF flows lag price action in some market phases — buyers accumulate through range, and price only responds when the float of available sellers is exhausted.
Analysts tracking the broader Solana ecosystem have separately noted setups that could accompany an institutional-driven leg higher. Among the altcoin layer, pattern watchers have flagged that tokens within the Solana ecosystem are showing pre-explosion patterns — a signal that is historically consistent with late-stage accumulation in the underlying asset before a directional move.
Institutional Infrastructure Deepening Around Solana
The ETF accumulation data does not exist in isolation. Regulated derivatives infrastructure for Solana has been expanding in parallel. The Moscow Exchange launched perpetual futures for Solana alongside Bitcoin, Ethereum, XRP, and Tron — adding another regulated venue where institutional participants can manage SOL exposure. More futures venues mean more hedging capacity, which lowers the friction cost for large spot positions.
When spot ETF accumulation, ecosystem altcoin positioning, and regulated derivatives expansion occur simultaneously, the structural backdrop for a directional move strengthens — not because any single signal guarantees a breakout, but because the conditions that historically precede sustained institutional-driven rallies are present across multiple dimensions.
Bullish Scenario
If ETF inflows stay above 1 million SOL per week through October, supply keeps tightening. @alicharts is watching the next leg higher, with $150 as the level on the board from current prices near $119. With no corresponding outflow pressure, the spot market float tightens and a breakout from the current range opens the next technical leg higher as flagged by @alicharts. The September 21 inflow acceleration — the largest single-week reading on record — would serve as the demand confirmation signal.
Bearish Scenario
If ETF inflows turn negative for even one week — breaking the 11-week streak — it would signal the first institutional demand reversal since July 13. A net outflow week would not immediately invalidate the bullish structure, but two consecutive negative bars would indicate the supply absorption thesis has stalled. The $450M accumulated position would then become overhead supply rather than support.
The 11-week streak is the metric to watch. @alicharts’ call is built on it continuing. DeFiLlama’s daily Solana revenue data and real-time ETF flow trackers will update that picture as October progresses. Eleven consecutive inflow weeks have put the breakout setup on the table — whether week twelve extends or breaks the streak will determine whether it stays there.
Disclaimer: The views and analysis presented in this article are for informational purposes only and reflect the author’s perspective, not financial advice. Technical patterns and indicators discussed are subject to market volatility and may or may not yield anticipated results. Investors are advised to exercise caution, conduct independent research, and make decisions aligned with their individual risk tolerance.
Solana ETF Inflows Hit 11 Straight Weeks — Is a Breakout Incoming?
Key Highlights
US Spot Solana ETFs accumulated 4.37M SOL (~$450M) since July 13 — 11 consecutive weeks of net inflowsSeptember 21 recorded the largest single-week ETF inflow on the chart: ~1.35–1.4M SOL, an accelerating trendAnalyst @alicharts flags 11 straight inflow weeks and is watching the next leg higher toward $150Watch for ETF weekly inflow continuation above 1M SOL — first negative week breaks the 11-streak thesis
Solana is building a case that institutional money is not rotating out — it is accelerating in. US Spot Solana ETFs have absorbed approximately 4.37 million SOL, worth around $450 million, since July 13, marking 11 consecutive weeks of net inflows with no interruption.
Crypto analyst Ali Martinez (@alicharts) flags the streak directly: “US Spot Solana ETFs have accumulated roughly 4.37 million $SOL, worth around $450 million, since July 13. That marks 11 consecutive weeks of net inflows. With institutional demand continuing to absorb Solana, I’m watching for the next leg higher toward $150.”
His framing is unambiguous: this is a supply absorption event, not a sentiment trade.
The ETF Flow Data — What 11 Consecutive Weeks Actually Means
ETF net inflows measure the difference between new capital entering a fund and capital exiting it each week. A single week of inflows can be noise. Three weeks is a trend. Eleven consecutive weeks with zero negative bars is a structural statement about institutional conviction.
The flow chart shared by @alicharts covers weekly ETF data from August 3 through September 21, 2026. What it shows is not a flat accumulation trend — it is an accelerating one. Inflows surged to approximately 1.2 million SOL in the week ending August 24, pulled back modestly into August 31, then hit their highest single-week reading of the entire series at the September 21 bar: an estimated 1.35 to 1.4 million SOL — the strongest institutional weekly buy on record for US Spot Solana ETFs.
SOL ETF Net Flows Analysis | Source: @alicharts (X)
The acceleration matters. If institutional buyers were simply holding a position, inflows would flatten. Instead the final data point on this chart is the largest. That is not consolidation — that is demand expanding at the margin.
Why Supply Absorption Changes the Price Equation
At 4.37 million SOL accumulated since July 13, US Spot ETFs have removed a measurable portion of liquid supply from the open market. This is the direct mechanism connecting ETF inflows to price: spot ETFs must hold the underlying asset, meaning every unit of net inflow represents SOL physically purchased and held off exchange.
The math is straightforward. At approximately $103 per SOL (the implied price from $450M across 4.37M SOL), institutional buyers have been averaging in throughout a range and are now sitting on a position that dwarfs typical retail accumulation events. For context, a single on-chain whale trade that attracted significant attention involved a SOL trader sitting on a $23M unrealized gain from a $67.88M 20x long — the ETF accumulation at $450M is an order of magnitude larger.
When supply tightens and a single demand cohort (in this case, regulated US ETF vehicles) is buying consistently without selling, the price required to source additional SOL rises. That is not a prediction — it is an arithmetic consequence of supply and demand.
ETF Inflows as a Leading Signal — And Its Limitations
ETF flow data is a sentiment and demand indicator, not a direct price trigger. The distinction matters. Inflows confirm that institutional buyers have been active — they do not guarantee that price will respond immediately or proportionally.
What the 11-week streak does confirm with certainty:
Sustained demand: No single week of outflows across the entire accumulation period since July 13Accelerating pace: The September 21 weekly bar (~1.35–1.4M SOL) is the highest on the entire chartScale: $450 million in ETF-driven spot buying represents institutional-grade conviction, not retail positioning
What it does not confirm: the exact price level at which the market reprices this demand, or the timing of any breakout move. ETF flows lag price action in some market phases — buyers accumulate through range, and price only responds when the float of available sellers is exhausted.
Analysts tracking the broader Solana ecosystem have separately noted setups that could accompany an institutional-driven leg higher. Among the altcoin layer, pattern watchers have flagged that tokens within the Solana ecosystem are showing pre-explosion patterns — a signal that is historically consistent with late-stage accumulation in the underlying asset before a directional move.
Institutional Infrastructure Deepening Around Solana
The ETF accumulation data does not exist in isolation. Regulated derivatives infrastructure for Solana has been expanding in parallel. The Moscow Exchange launched perpetual futures for Solana alongside Bitcoin, Ethereum, XRP, and Tron — adding another regulated venue where institutional participants can manage SOL exposure. More futures venues mean more hedging capacity, which lowers the friction cost for large spot positions.
When spot ETF accumulation, ecosystem altcoin positioning, and regulated derivatives expansion occur simultaneously, the structural backdrop for a directional move strengthens — not because any single signal guarantees a breakout, but because the conditions that historically precede sustained institutional-driven rallies are present across multiple dimensions.
Bullish Scenario
If ETF inflows stay above 1 million SOL per week through October, supply keeps tightening. @alicharts is watching the next leg higher, with $150 as the level on the board from current prices near $119. With no corresponding outflow pressure, the spot market float tightens and a breakout from the current range opens the next technical leg higher as flagged by @alicharts. The September 21 inflow acceleration — the largest single-week reading on record — would serve as the demand confirmation signal.
Bearish Scenario
If ETF inflows turn negative for even one week — breaking the 11-week streak — it would signal the first institutional demand reversal since July 13. A net outflow week would not immediately invalidate the bullish structure, but two consecutive negative bars would indicate the supply absorption thesis has stalled. The $450M accumulated position would then become overhead supply rather than support.
The 11-week streak is the metric to watch. @alicharts’ call is built on it continuing. DeFiLlama’s daily Solana revenue data and real-time ETF flow trackers will update that picture as October progresses. Eleven consecutive inflow weeks have put the breakout setup on the table — whether week twelve extends or breaks the streak will determine whether it stays there.
Disclaimer: The views and analysis presented in this article are for informational purposes only and reflect the author’s perspective, not financial advice. Technical patterns and indicators discussed are subject to market volatility and may or may not yield anticipated results. Investors are advised to exercise caution, conduct independent research, and make decisions aligned with their individual risk tolerance.
US Spot Solana ETFs accumulated 4.37M SOL (~$450M) since July 13 — 11 consecutive weeks of net inflowsSeptember 21 recorded the largest single-week ETF inflow on the chart: ~1.35–1.4M SOL, an accelerating trendAnalyst @alicharts flags 11 straight inflow weeks and is watching the next leg higher toward $150Watch for ETF weekly inflow continuation above 1M SOL — first negative week breaks the 11-streak thesis
Solana is building a case that institutional money is not rotating out — it is accelerating in. US Spot Solana ETFs have absorbed approximately 4.37 million SOL, worth around $450 million, since July 13, marking 11 consecutive weeks of net inflows with no interruption.
Crypto analyst Ali Martinez (@alicharts) flags the streak directly: “US Spot Solana ETFs have accumulated roughly 4.37 million $SOL, worth around $450 million, since July 13. That marks 11 consecutive weeks of net inflows. With institutional demand continuing to absorb Solana, I’m watching for the next leg higher toward $150.”
His framing is unambiguous: this is a supply absorption event, not a sentiment trade.
The ETF Flow Data — What 11 Consecutive Weeks Actually Means
ETF net inflows measure the difference between new capital entering a fund and capital exiting it each week. A single week of inflows can be noise. Three weeks is a trend. Eleven consecutive weeks with zero negative bars is a structural statement about institutional conviction.
The flow chart shared by @alicharts covers weekly ETF data from August 3 through September 21, 2026. What it shows is not a flat accumulation trend — it is an accelerating one. Inflows surged to approximately 1.2 million SOL in the week ending August 24, pulled back modestly into August 31, then hit their highest single-week reading of the entire series at the September 21 bar: an estimated 1.35 to 1.4 million SOL — the strongest institutional weekly buy on record for US Spot Solana ETFs.
SOL ETF Net Flows Analysis | Source: @alicharts (X)
The acceleration matters. If institutional buyers were simply holding a position, inflows would flatten. Instead the final data point on this chart is the largest. That is not consolidation — that is demand expanding at the margin.
Why Supply Absorption Changes the Price Equation
At 4.37 million SOL accumulated since July 13, US Spot ETFs have removed a measurable portion of liquid supply from the open market. This is the direct mechanism connecting ETF inflows to price: spot ETFs must hold the underlying asset, meaning every unit of net inflow represents SOL physically purchased and held off exchange.
The math is straightforward. At approximately $103 per SOL (the implied price from $450M across 4.37M SOL), institutional buyers have been averaging in throughout a range and are now sitting on a position that dwarfs typical retail accumulation events. For context, a single on-chain whale trade that attracted significant attention involved a SOL trader sitting on a $23M unrealized gain from a $67.88M 20x long — the ETF accumulation at $450M is an order of magnitude larger.
When supply tightens and a single demand cohort (in this case, regulated US ETF vehicles) is buying consistently without selling, the price required to source additional SOL rises. That is not a prediction — it is an arithmetic consequence of supply and demand.
ETF Inflows as a Leading Signal — And Its Limitations
ETF flow data is a sentiment and demand indicator, not a direct price trigger. The distinction matters. Inflows confirm that institutional buyers have been active — they do not guarantee that price will respond immediately or proportionally.
What the 11-week streak does confirm with certainty:
Sustained demand: No single week of outflows across the entire accumulation period since July 13Accelerating pace: The September 21 weekly bar (~1.35–1.4M SOL) is the highest on the entire chartScale: $450 million in ETF-driven spot buying represents institutional-grade conviction, not retail positioning
What it does not confirm: the exact price level at which the market reprices this demand, or the timing of any breakout move. ETF flows lag price action in some market phases — buyers accumulate through range, and price only responds when the float of available sellers is exhausted.
Analysts tracking the broader Solana ecosystem have separately noted setups that could accompany an institutional-driven leg higher. Among the altcoin layer, pattern watchers have flagged that tokens within the Solana ecosystem are showing pre-explosion patterns — a signal that is historically consistent with late-stage accumulation in the underlying asset before a directional move.
Institutional Infrastructure Deepening Around Solana
The ETF accumulation data does not exist in isolation. Regulated derivatives infrastructure for Solana has been expanding in parallel. The Moscow Exchange launched perpetual futures for Solana alongside Bitcoin, Ethereum, XRP, and Tron — adding another regulated venue where institutional participants can manage SOL exposure. More futures venues mean more hedging capacity, which lowers the friction cost for large spot positions.
When spot ETF accumulation, ecosystem altcoin positioning, and regulated derivatives expansion occur simultaneously, the structural backdrop for a directional move strengthens — not because any single signal guarantees a breakout, but because the conditions that historically precede sustained institutional-driven rallies are present across multiple dimensions.
Bullish Scenario
If ETF inflows stay above 1 million SOL per week through October, supply keeps tightening. @alicharts is watching the next leg higher, with $150 as the level on the board from current prices near $119. With no corresponding outflow pressure, the spot market float tightens and a breakout from the current range opens the next technical leg higher as flagged by @alicharts. The September 21 inflow acceleration — the largest single-week reading on record — would serve as the demand confirmation signal.
Bearish Scenario
If ETF inflows turn negative for even one week — breaking the 11-week streak — it would signal the first institutional demand reversal since July 13. A net outflow week would not immediately invalidate the bullish structure, but two consecutive negative bars would indicate the supply absorption thesis has stalled. The $450M accumulated position would then become overhead supply rather than support.
The 11-week streak is the metric to watch. @alicharts’ call is built on it continuing. DeFiLlama’s daily Solana revenue data and real-time ETF flow trackers will update that picture as October progresses. Eleven consecutive inflow weeks have put the breakout setup on the table — whether week twelve extends or breaks the streak will determine whether it stays there.
Disclaimer: The views and analysis presented in this article are for informational purposes only and reflect the author’s perspective, not financial advice. Technical patterns and indicators discussed are subject to market volatility and may or may not yield anticipated results. Investors are advised to exercise caution, conduct independent research, and make decisions aligned with their individual risk tolerance.
517
·
--
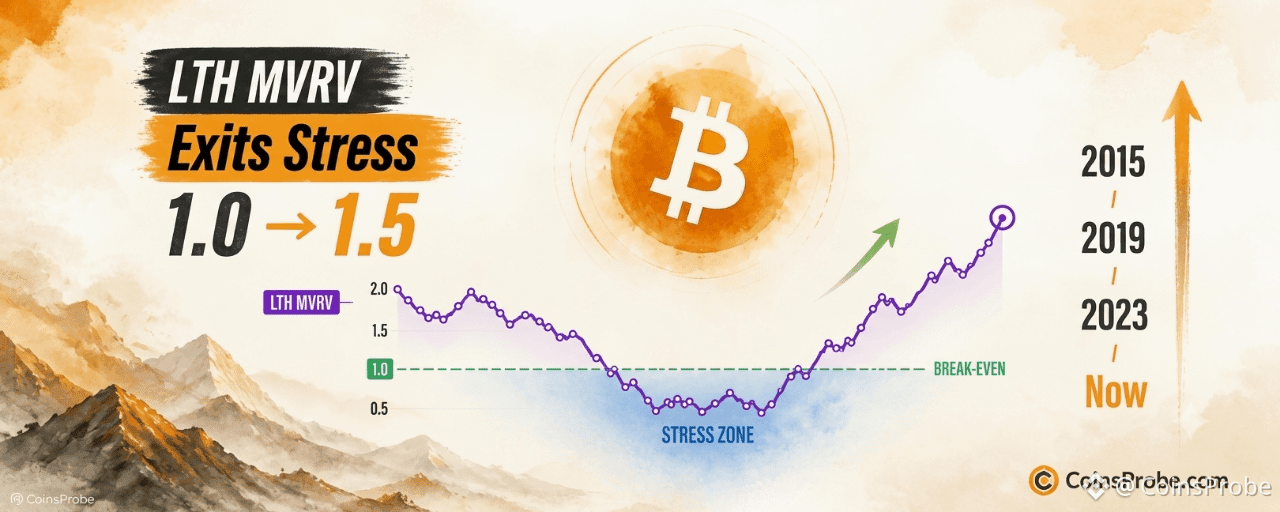
Məqalə
Tərcüməyə bax
Bitcoin LTH MVRV Exits Stress Zone — What History Says Happens NextKey Highlights
Bitcoin's 6M–10Y LTH Adjusted MVRV has crossed back above 1.0, exiting shallow stress — per @_Crypto_glass via CryptoQuantEvery prior sub-1.0 exit in this cohort (2012, 2015, 2019, 2023) preceded a sustained Bitcoin bull runCurrent MVRV reading ~1.2–1.5 vs. historical sell-signal exhaustion zone at 8–10 — significant headroom remainsWatch $85,000–$88,000 as the structural floor; a sustained break below returns cohort to loss territory
Bitcoin is trading at approximately $97,000 — and beneath that price, one of the most consequential on-chain resets of this cycle has just completed. The Adjusted Long-Term Holder MVRV for the 6-month to 10-year cohort has crossed back above 1.0, exiting what CryptoQuant classifies as a shallow stress zone. This is not a speculative signal. It is a documented regime transition that has preceded every major Bitcoin bull run since 2012.
The observation comes from @_Crypto_glass, published through @cryptoquant_com. Their exact framing: “The 6M–10Y cohort has moved out of shallow sub-1.0 stress and back into aggregate profit. This is a constructive reset for this holder group, not a deep or persistent loss phase.” That distinction — constructive reset versus deep capitulation — is the analytical load-bearing point of this entire signal.
What the Adjusted LTH MVRV Actually Measures
The MVRV ratio compares an asset’s market value to its realized value — in simpler terms, it compares what Bitcoin is worth today versus what holders paid for it. A reading below 1.0 means the cohort is, in aggregate, holding at a loss. A reading above 1.0 means they have returned to aggregate profit.
The Adjusted variant applied here strips out coins that are likely lost or permanently dormant, producing a cleaner read of active long-term conviction holders. The 6-month to 10-year cohort filters further — these are not traders. These are investors who have held through multiple cycles, through 80% drawdowns, through protocol crises. Their collective cost basis moving back above market price is structurally meaningful in a way that short-term holder data is not.
When this cohort dips below MVRV 1.0, it enters what the chart defines as an “Extreme Underwater” zone — shaded in blue. These episodes are rare, brief, and historically have resolved in only one direction.
The Historical Pattern — 2012, 2015, 2019, 2023, and Now
The chart shared by @_Crypto_glass spans 2012 through 2026, and the blue stress zones appear clearly at five distinct moments. Each prior resolution — the MVRV crossing back above 1.0 — preceded a sustained multi-month advance in Bitcoin’s price. The 2015 exit preceded Bitcoin’s climb from approximately $250 to $20,000 across the following two years. The 2019 exit preceded the recovery from the $3,200 bear market low. The 2023 exit followed the FTX capitulation low near $15,500 and preceded the rally that eventually carried Bitcoin past $100,000.
The current 2025–2026 stress episode — visible as the most recent blue zone on the chart — is now resolving in identical fashion. MVRV is crossing back above 1.0, with the current reading estimated at approximately 1.2–1.5. This is not near any historical sell-signal territory. Prior cycle peaks saw the Adjusted LTH MVRV reach readings of 8 to 10. The distance between current levels and historical exhaustion zones represents substantial potential upside before this cohort reaches the profit levels that have historically triggered distribution.
@_Crypto_glass’s chart reveals the purple MVRV line exiting the blue shaded zone and returning to positive territory — mirroring the structural recovery patterns of 2012, 2015, 2019, and 2023. The realized price trend (shown in orange) continues moving upward, confirming that the long-term cost basis is expanding in a healthy, non-parabolic fashion.
BTC Adjusted LTH MVRV Analysis | Source: @cryptoquant_com (X)
Why “Constructive Reset” Matters More Than “No Capitulation”
The specific language @_Crypto_glass uses — constructive reset — carries analytical weight. A deep capitulation event, such as what occurred in late 2022, forces long-term holders into realized losses and often triggers forced selling cascades. That is a different market structure than what the data shows today.
The current sub-1.0 episode was shallow and short-lived. Long-term holders did not sell in distress. The cost basis of the 6M–10Y cohort remained close enough to market price that the return to profit required only a modest price recovery — not a new all-time high. That is the definition of healthy consolidation: a reset that restores the cohort to aggregate profit without requiring the kind of violent repricing that shakes out weak hands at scale.
This also matters for what it rules out. A persistent sub-1.0 reading — lasting months with no recovery — would suggest structural selling pressure from even the most committed holders. That is not what the data shows. The stress was temporary. The exit is now confirmed.
For context on how institutional demand is reinforcing this on-chain picture, Crypto Spot ETFs recently logged $2.71B in weekly net inflows with Bitcoin commanding 70.8% of that share — a structural demand signal that complements the LTH MVRV reset. And the short-term picture is similarly constructive: BTC short-term holder selling recently hit multi-year lows while a 2022 reversal fractal aligned — two timeframes now pointing in the same direction.
What This Does Not Confirm
The MVRV exit from stress is a regime signal, not a price prediction. It confirms that the structural condition of the long-term holder base has normalized — it does not specify when Bitcoin will make its next leg higher, nor does it guarantee a specific percentage gain. Prior post-stress recoveries ranged from moderate (2019’s 150% recovery before the COVID crash interrupted) to extreme (the 2015 exit preceding an eventual 8,000%+ advance to the 2017 peak).
The signal also does not rule out short-term price volatility. Bitcoin could retest the $88,000–$90,000 range and the MVRV would still read constructively if that dip remained brief. What would invalidate the signal is a sustained return below MVRV 1.0 — meaning price drops sharply enough, for long enough, that the 6M–10Y cohort re-enters aggregate loss territory.
Bullish Scenario
Bitcoin holds above $90,000 as a floor, MVRV continues rising toward the 2.0–3.0 range — a level consistent with mid-cycle momentum phases in 2016 and 2020 — and the realized price trend continues expanding. Historical precedent from the 2023 equivalent exit suggests a sustained multi-month advance with intermediate targets at $110,000, $130,000, and eventually the MVRV 8–10 exhaustion zone that has historically corresponded with cycle peak pricing.
Bearish Scenario
A decisive break below $85,000 sustained over multiple weeks would push the 6M–10Y cohort back into sub-1.0 MVRV territory, invalidating the constructive reset interpretation and signaling that the stress phase is not yet resolved. That outcome would shift the analytical framework from recovery to potential prolonged consolidation.
The Level Traders Are Watching
The MVRV 1.0 threshold is now the key structural line. As long as Bitcoin’s price sustains the conditions that keep the 6M–10Y cohort in aggregate profit — broadly, price above approximately $85,000–$88,000 based on current cohort cost basis estimates — the reset thesis remains intact. The next meaningful resistance in MVRV terms is not price resistance but ratio resistance: the 3.0 level, which in prior cycles marked the transition from early recovery to full bull market acceleration. At current readings of 1.2–1.5, that zone remains well ahead.
The Adjusted LTH MVRV has exited shallow stress in four prior cycles — 2012, 2015, 2019, and 2023. Each time, the outcome was not a modest bounce. Each time, it was the beginning of a sustained advance. The current exit carries the same structural fingerprint. MVRV at approximately 1.2–1.5 against a historical exhaustion ceiling of 8–10 means the cohort with the strongest hands in the market has just returned to profit, and history says they will not sell until that ratio is a multiple of where it stands today. Watch $85,000 as the level that, if lost on a sustained basis, forces a reassessment of everything above.
Disclaimer: This article is for informational purposes only and does not constitute financial advice. Always conduct your own research before making any investment decisions.
Bitcoin LTH MVRV Exits Stress Zone — What History Says Happens Next
Key Highlights
Bitcoin's 6M–10Y LTH Adjusted MVRV has crossed back above 1.0, exiting shallow stress — per @_Crypto_glass via CryptoQuantEvery prior sub-1.0 exit in this cohort (2012, 2015, 2019, 2023) preceded a sustained Bitcoin bull runCurrent MVRV reading ~1.2–1.5 vs. historical sell-signal exhaustion zone at 8–10 — significant headroom remainsWatch $85,000–$88,000 as the structural floor; a sustained break below returns cohort to loss territory
Bitcoin is trading at approximately $97,000 — and beneath that price, one of the most consequential on-chain resets of this cycle has just completed. The Adjusted Long-Term Holder MVRV for the 6-month to 10-year cohort has crossed back above 1.0, exiting what CryptoQuant classifies as a shallow stress zone. This is not a speculative signal. It is a documented regime transition that has preceded every major Bitcoin bull run since 2012.
The observation comes from @_Crypto_glass, published through @cryptoquant_com. Their exact framing: “The 6M–10Y cohort has moved out of shallow sub-1.0 stress and back into aggregate profit. This is a constructive reset for this holder group, not a deep or persistent loss phase.” That distinction — constructive reset versus deep capitulation — is the analytical load-bearing point of this entire signal.
What the Adjusted LTH MVRV Actually Measures
The MVRV ratio compares an asset’s market value to its realized value — in simpler terms, it compares what Bitcoin is worth today versus what holders paid for it. A reading below 1.0 means the cohort is, in aggregate, holding at a loss. A reading above 1.0 means they have returned to aggregate profit.
The Adjusted variant applied here strips out coins that are likely lost or permanently dormant, producing a cleaner read of active long-term conviction holders. The 6-month to 10-year cohort filters further — these are not traders. These are investors who have held through multiple cycles, through 80% drawdowns, through protocol crises. Their collective cost basis moving back above market price is structurally meaningful in a way that short-term holder data is not.
When this cohort dips below MVRV 1.0, it enters what the chart defines as an “Extreme Underwater” zone — shaded in blue. These episodes are rare, brief, and historically have resolved in only one direction.
The Historical Pattern — 2012, 2015, 2019, 2023, and Now
The chart shared by @_Crypto_glass spans 2012 through 2026, and the blue stress zones appear clearly at five distinct moments. Each prior resolution — the MVRV crossing back above 1.0 — preceded a sustained multi-month advance in Bitcoin’s price. The 2015 exit preceded Bitcoin’s climb from approximately $250 to $20,000 across the following two years. The 2019 exit preceded the recovery from the $3,200 bear market low. The 2023 exit followed the FTX capitulation low near $15,500 and preceded the rally that eventually carried Bitcoin past $100,000.
The current 2025–2026 stress episode — visible as the most recent blue zone on the chart — is now resolving in identical fashion. MVRV is crossing back above 1.0, with the current reading estimated at approximately 1.2–1.5. This is not near any historical sell-signal territory. Prior cycle peaks saw the Adjusted LTH MVRV reach readings of 8 to 10. The distance between current levels and historical exhaustion zones represents substantial potential upside before this cohort reaches the profit levels that have historically triggered distribution.
@_Crypto_glass’s chart reveals the purple MVRV line exiting the blue shaded zone and returning to positive territory — mirroring the structural recovery patterns of 2012, 2015, 2019, and 2023. The realized price trend (shown in orange) continues moving upward, confirming that the long-term cost basis is expanding in a healthy, non-parabolic fashion.
BTC Adjusted LTH MVRV Analysis | Source: @cryptoquant_com (X)
Why “Constructive Reset” Matters More Than “No Capitulation”
The specific language @_Crypto_glass uses — constructive reset — carries analytical weight. A deep capitulation event, such as what occurred in late 2022, forces long-term holders into realized losses and often triggers forced selling cascades. That is a different market structure than what the data shows today.
The current sub-1.0 episode was shallow and short-lived. Long-term holders did not sell in distress. The cost basis of the 6M–10Y cohort remained close enough to market price that the return to profit required only a modest price recovery — not a new all-time high. That is the definition of healthy consolidation: a reset that restores the cohort to aggregate profit without requiring the kind of violent repricing that shakes out weak hands at scale.
This also matters for what it rules out. A persistent sub-1.0 reading — lasting months with no recovery — would suggest structural selling pressure from even the most committed holders. That is not what the data shows. The stress was temporary. The exit is now confirmed.
For context on how institutional demand is reinforcing this on-chain picture, Crypto Spot ETFs recently logged $2.71B in weekly net inflows with Bitcoin commanding 70.8% of that share — a structural demand signal that complements the LTH MVRV reset. And the short-term picture is similarly constructive: BTC short-term holder selling recently hit multi-year lows while a 2022 reversal fractal aligned — two timeframes now pointing in the same direction.
What This Does Not Confirm
The MVRV exit from stress is a regime signal, not a price prediction. It confirms that the structural condition of the long-term holder base has normalized — it does not specify when Bitcoin will make its next leg higher, nor does it guarantee a specific percentage gain. Prior post-stress recoveries ranged from moderate (2019’s 150% recovery before the COVID crash interrupted) to extreme (the 2015 exit preceding an eventual 8,000%+ advance to the 2017 peak).
The signal also does not rule out short-term price volatility. Bitcoin could retest the $88,000–$90,000 range and the MVRV would still read constructively if that dip remained brief. What would invalidate the signal is a sustained return below MVRV 1.0 — meaning price drops sharply enough, for long enough, that the 6M–10Y cohort re-enters aggregate loss territory.
Bullish Scenario
Bitcoin holds above $90,000 as a floor, MVRV continues rising toward the 2.0–3.0 range — a level consistent with mid-cycle momentum phases in 2016 and 2020 — and the realized price trend continues expanding. Historical precedent from the 2023 equivalent exit suggests a sustained multi-month advance with intermediate targets at $110,000, $130,000, and eventually the MVRV 8–10 exhaustion zone that has historically corresponded with cycle peak pricing.
Bearish Scenario
A decisive break below $85,000 sustained over multiple weeks would push the 6M–10Y cohort back into sub-1.0 MVRV territory, invalidating the constructive reset interpretation and signaling that the stress phase is not yet resolved. That outcome would shift the analytical framework from recovery to potential prolonged consolidation.
The Level Traders Are Watching
The MVRV 1.0 threshold is now the key structural line. As long as Bitcoin’s price sustains the conditions that keep the 6M–10Y cohort in aggregate profit — broadly, price above approximately $85,000–$88,000 based on current cohort cost basis estimates — the reset thesis remains intact. The next meaningful resistance in MVRV terms is not price resistance but ratio resistance: the 3.0 level, which in prior cycles marked the transition from early recovery to full bull market acceleration. At current readings of 1.2–1.5, that zone remains well ahead.
The Adjusted LTH MVRV has exited shallow stress in four prior cycles — 2012, 2015, 2019, and 2023. Each time, the outcome was not a modest bounce. Each time, it was the beginning of a sustained advance. The current exit carries the same structural fingerprint. MVRV at approximately 1.2–1.5 against a historical exhaustion ceiling of 8–10 means the cohort with the strongest hands in the market has just returned to profit, and history says they will not sell until that ratio is a multiple of where it stands today. Watch $85,000 as the level that, if lost on a sustained basis, forces a reassessment of everything above.
Disclaimer: This article is for informational purposes only and does not constitute financial advice. Always conduct your own research before making any investment decisions.
Bitcoin's 6M–10Y LTH Adjusted MVRV has crossed back above 1.0, exiting shallow stress — per @_Crypto_glass via CryptoQuantEvery prior sub-1.0 exit in this cohort (2012, 2015, 2019, 2023) preceded a sustained Bitcoin bull runCurrent MVRV reading ~1.2–1.5 vs. historical sell-signal exhaustion zone at 8–10 — significant headroom remainsWatch $85,000–$88,000 as the structural floor; a sustained break below returns cohort to loss territory
Bitcoin is trading at approximately $97,000 — and beneath that price, one of the most consequential on-chain resets of this cycle has just completed. The Adjusted Long-Term Holder MVRV for the 6-month to 10-year cohort has crossed back above 1.0, exiting what CryptoQuant classifies as a shallow stress zone. This is not a speculative signal. It is a documented regime transition that has preceded every major Bitcoin bull run since 2012.
The observation comes from @_Crypto_glass, published through @cryptoquant_com. Their exact framing: “The 6M–10Y cohort has moved out of shallow sub-1.0 stress and back into aggregate profit. This is a constructive reset for this holder group, not a deep or persistent loss phase.” That distinction — constructive reset versus deep capitulation — is the analytical load-bearing point of this entire signal.
What the Adjusted LTH MVRV Actually Measures
The MVRV ratio compares an asset’s market value to its realized value — in simpler terms, it compares what Bitcoin is worth today versus what holders paid for it. A reading below 1.0 means the cohort is, in aggregate, holding at a loss. A reading above 1.0 means they have returned to aggregate profit.
The Adjusted variant applied here strips out coins that are likely lost or permanently dormant, producing a cleaner read of active long-term conviction holders. The 6-month to 10-year cohort filters further — these are not traders. These are investors who have held through multiple cycles, through 80% drawdowns, through protocol crises. Their collective cost basis moving back above market price is structurally meaningful in a way that short-term holder data is not.
When this cohort dips below MVRV 1.0, it enters what the chart defines as an “Extreme Underwater” zone — shaded in blue. These episodes are rare, brief, and historically have resolved in only one direction.
The Historical Pattern — 2012, 2015, 2019, 2023, and Now
The chart shared by @_Crypto_glass spans 2012 through 2026, and the blue stress zones appear clearly at five distinct moments. Each prior resolution — the MVRV crossing back above 1.0 — preceded a sustained multi-month advance in Bitcoin’s price. The 2015 exit preceded Bitcoin’s climb from approximately $250 to $20,000 across the following two years. The 2019 exit preceded the recovery from the $3,200 bear market low. The 2023 exit followed the FTX capitulation low near $15,500 and preceded the rally that eventually carried Bitcoin past $100,000.
The current 2025–2026 stress episode — visible as the most recent blue zone on the chart — is now resolving in identical fashion. MVRV is crossing back above 1.0, with the current reading estimated at approximately 1.2–1.5. This is not near any historical sell-signal territory. Prior cycle peaks saw the Adjusted LTH MVRV reach readings of 8 to 10. The distance between current levels and historical exhaustion zones represents substantial potential upside before this cohort reaches the profit levels that have historically triggered distribution.
@_Crypto_glass’s chart reveals the purple MVRV line exiting the blue shaded zone and returning to positive territory — mirroring the structural recovery patterns of 2012, 2015, 2019, and 2023. The realized price trend (shown in orange) continues moving upward, confirming that the long-term cost basis is expanding in a healthy, non-parabolic fashion.
BTC Adjusted LTH MVRV Analysis | Source: @cryptoquant_com (X)
Why “Constructive Reset” Matters More Than “No Capitulation”
The specific language @_Crypto_glass uses — constructive reset — carries analytical weight. A deep capitulation event, such as what occurred in late 2022, forces long-term holders into realized losses and often triggers forced selling cascades. That is a different market structure than what the data shows today.
The current sub-1.0 episode was shallow and short-lived. Long-term holders did not sell in distress. The cost basis of the 6M–10Y cohort remained close enough to market price that the return to profit required only a modest price recovery — not a new all-time high. That is the definition of healthy consolidation: a reset that restores the cohort to aggregate profit without requiring the kind of violent repricing that shakes out weak hands at scale.
This also matters for what it rules out. A persistent sub-1.0 reading — lasting months with no recovery — would suggest structural selling pressure from even the most committed holders. That is not what the data shows. The stress was temporary. The exit is now confirmed.
For context on how institutional demand is reinforcing this on-chain picture, Crypto Spot ETFs recently logged $2.71B in weekly net inflows with Bitcoin commanding 70.8% of that share — a structural demand signal that complements the LTH MVRV reset. And the short-term picture is similarly constructive: BTC short-term holder selling recently hit multi-year lows while a 2022 reversal fractal aligned — two timeframes now pointing in the same direction.
What This Does Not Confirm
The MVRV exit from stress is a regime signal, not a price prediction. It confirms that the structural condition of the long-term holder base has normalized — it does not specify when Bitcoin will make its next leg higher, nor does it guarantee a specific percentage gain. Prior post-stress recoveries ranged from moderate (2019’s 150% recovery before the COVID crash interrupted) to extreme (the 2015 exit preceding an eventual 8,000%+ advance to the 2017 peak).
The signal also does not rule out short-term price volatility. Bitcoin could retest the $88,000–$90,000 range and the MVRV would still read constructively if that dip remained brief. What would invalidate the signal is a sustained return below MVRV 1.0 — meaning price drops sharply enough, for long enough, that the 6M–10Y cohort re-enters aggregate loss territory.
Bullish Scenario
Bitcoin holds above $90,000 as a floor, MVRV continues rising toward the 2.0–3.0 range — a level consistent with mid-cycle momentum phases in 2016 and 2020 — and the realized price trend continues expanding. Historical precedent from the 2023 equivalent exit suggests a sustained multi-month advance with intermediate targets at $110,000, $130,000, and eventually the MVRV 8–10 exhaustion zone that has historically corresponded with cycle peak pricing.
Bearish Scenario
A decisive break below $85,000 sustained over multiple weeks would push the 6M–10Y cohort back into sub-1.0 MVRV territory, invalidating the constructive reset interpretation and signaling that the stress phase is not yet resolved. That outcome would shift the analytical framework from recovery to potential prolonged consolidation.
The Level Traders Are Watching
The MVRV 1.0 threshold is now the key structural line. As long as Bitcoin’s price sustains the conditions that keep the 6M–10Y cohort in aggregate profit — broadly, price above approximately $85,000–$88,000 based on current cohort cost basis estimates — the reset thesis remains intact. The next meaningful resistance in MVRV terms is not price resistance but ratio resistance: the 3.0 level, which in prior cycles marked the transition from early recovery to full bull market acceleration. At current readings of 1.2–1.5, that zone remains well ahead.
The Adjusted LTH MVRV has exited shallow stress in four prior cycles — 2012, 2015, 2019, and 2023. Each time, the outcome was not a modest bounce. Each time, it was the beginning of a sustained advance. The current exit carries the same structural fingerprint. MVRV at approximately 1.2–1.5 against a historical exhaustion ceiling of 8–10 means the cohort with the strongest hands in the market has just returned to profit, and history says they will not sell until that ratio is a multiple of where it stands today. Watch $85,000 as the level that, if lost on a sustained basis, forces a reassessment of everything above.
Disclaimer: This article is for informational purposes only and does not constitute financial advice. Always conduct your own research before making any investment decisions.
122
·
--
Doğrulanıb

Məqalə
HBAR Niyə Artır? Sibos Stendi, NVIDIA Təhlükəsizlik Platformu Qeydini və IBM CloudƏsas məqamlar
HBAR 35% artaraq 0,1267 ABŞ dollarına çatır, bazar kapitallaşması 5,578 milyard ABŞ dollarıdır; Hedera Sibos 2026 stendindən canlı yayımla çıxış edir DISM03.
Hedera Şurası NVIDIA-nın Open Agent Safety Platformunda adı çəkilib — təmsil, açıqlanmış ödənişli NVIDIA müqaviləsi deyil.
Hashgraph-ın IDTrust-u IBM Cloud Catalog-da listelenib; bu, müəssisə kanalını HashSphere, Asseto və CLPR-in Sibos demo çıxışları ilə birlikdə artırır.
Hedera (HBAR) 0,1267 ABŞ dollarına satılır, son 24 saatda 35% yüksəlib və bazar kapitallaşması 5,578 milyard ABŞ dollarıdır. Bu rəqəmlər dəyişəcək. Amma katalizatorlar dəyişməyəcək: Sibos və NVIDIA-dan rəsmi Hedera paylaşımları bu gün gəldi, IBM Cloud listingi isə artıq ötən həftə lentdə idi.
HBAR Niyə Artır? Sibos Stendi, NVIDIA Təhlükəsizlik Platformu Qeydini və IBM Cloud
Əsas məqamlar
HBAR 35% artaraq 0,1267 ABŞ dollarına çatır, bazar kapitallaşması 5,578 milyard ABŞ dollarıdır; Hedera Sibos 2026 stendindən canlı yayımla çıxış edir DISM03.
Hedera Şurası NVIDIA-nın Open Agent Safety Platformunda adı çəkilib — təmsil, açıqlanmış ödənişli NVIDIA müqaviləsi deyil.
Hashgraph-ın IDTrust-u IBM Cloud Catalog-da listelenib; bu, müəssisə kanalını HashSphere, Asseto və CLPR-in Sibos demo çıxışları ilə birlikdə artırır.
Hedera (HBAR) 0,1267 ABŞ dollarına satılır, son 24 saatda 35% yüksəlib və bazar kapitallaşması 5,578 milyard ABŞ dollarıdır. Bu rəqəmlər dəyişəcək. Amma katalizatorlar dəyişməyəcək: Sibos və NVIDIA-dan rəsmi Hedera paylaşımları bu gün gəldi, IBM Cloud listingi isə artıq ötən həftə lentdə idi.
HBAR 35% artaraq 0,1267 ABŞ dollarına çatır, bazar kapitallaşması 5,578 milyard ABŞ dollarıdır; Hedera Sibos 2026 stendindən canlı yayımla çıxış edir DISM03.
Hedera Şurası NVIDIA-nın Open Agent Safety Platformunda adı çəkilib — təmsil, açıqlanmış ödənişli NVIDIA müqaviləsi deyil.
Hashgraph-ın IDTrust-u IBM Cloud Catalog-da listelenib; bu, müəssisə kanalını HashSphere, Asseto və CLPR-in Sibos demo çıxışları ilə birlikdə artırır.
Hedera (HBAR) 0,1267 ABŞ dollarına satılır, son 24 saatda 35% yüksəlib və bazar kapitallaşması 5,578 milyard ABŞ dollarıdır. Bu rəqəmlər dəyişəcək. Amma katalizatorlar dəyişməyəcək: Sibos və NVIDIA-dan rəsmi Hedera paylaşımları bu gün gəldi, IBM Cloud listingi isə artıq ötən həftə lentdə idi.
1
1.3k
·
--
Doğrulanıb

Məqalə
ALGO Niyə Artır? CEO-nun NYSE Debütü və 5 illik Özünü-ödəmə PlanıƏsas məqamlar
ALGO artım 16% artaraq 0.1359 dollaradək — CEO William Herkelrath-ın 29 sentyabr NYSE/FINTECHTV-də təsdiqlənmiş çıxışı ilə şərtlənir
Herkelrath-ın Community AMA-si 5 il ərzində özünü-ödəmə qabiliyyətinə çatmağı, ödənişlərin artırılmamasını və 2027-ci ilədək çoxzəncirli dəstəyi öhdəsinə götürür
Algorand bu gün on-çeyn (on-chain) post-kvadrat (post-quantum) hesablarına malikdir — 25 sentyabr tarixində Fondasiya tərəfindən təsdiqlənib
Algorand (ALGO) 0.1359 dollar civarında ticarət edir, son 24 saatda təxminən 16% yüksəlib, bazar kapitallaşması isə təxminən 1.2 milyard dollar təşkil edir. Hərəkət iki rəsmi Fondasiya maddəsinə dayanır: CEO William Herkelrath sabah NYSE-dən canlı çıxış edir və Algorand 2.0 üçün tarixləri müəyyən edən bir həftəsonu AMA-si var.
ALGO Niyə Artır? CEO-nun NYSE Debütü və 5 illik Özünü-ödəmə Planı
Əsas məqamlar
ALGO artım 16% artaraq 0.1359 dollaradək — CEO William Herkelrath-ın 29 sentyabr NYSE/FINTECHTV-də təsdiqlənmiş çıxışı ilə şərtlənir
Herkelrath-ın Community AMA-si 5 il ərzində özünü-ödəmə qabiliyyətinə çatmağı, ödənişlərin artırılmamasını və 2027-ci ilədək çoxzəncirli dəstəyi öhdəsinə götürür
Algorand bu gün on-çeyn (on-chain) post-kvadrat (post-quantum) hesablarına malikdir — 25 sentyabr tarixində Fondasiya tərəfindən təsdiqlənib
Algorand (ALGO) 0.1359 dollar civarında ticarət edir, son 24 saatda təxminən 16% yüksəlib, bazar kapitallaşması isə təxminən 1.2 milyard dollar təşkil edir. Hərəkət iki rəsmi Fondasiya maddəsinə dayanır: CEO William Herkelrath sabah NYSE-dən canlı çıxış edir və Algorand 2.0 üçün tarixləri müəyyən edən bir həftəsonu AMA-si var.
ALGO artım 16% artaraq 0.1359 dollaradək — CEO William Herkelrath-ın 29 sentyabr NYSE/FINTECHTV-də təsdiqlənmiş çıxışı ilə şərtlənir
Herkelrath-ın Community AMA-si 5 il ərzində özünü-ödəmə qabiliyyətinə çatmağı, ödənişlərin artırılmamasını və 2027-ci ilədək çoxzəncirli dəstəyi öhdəsinə götürür
Algorand bu gün on-çeyn (on-chain) post-kvadrat (post-quantum) hesablarına malikdir — 25 sentyabr tarixində Fondasiya tərəfindən təsdiqlənib
Algorand (ALGO) 0.1359 dollar civarında ticarət edir, son 24 saatda təxminən 16% yüksəlib, bazar kapitallaşması isə təxminən 1.2 milyard dollar təşkil edir. Hərəkət iki rəsmi Fondasiya maddəsinə dayanır: CEO William Herkelrath sabah NYSE-dən canlı çıxış edir və Algorand 2.0 üçün tarixləri müəyyən edən bir həftəsonu AMA-si var.
2
351
·
--
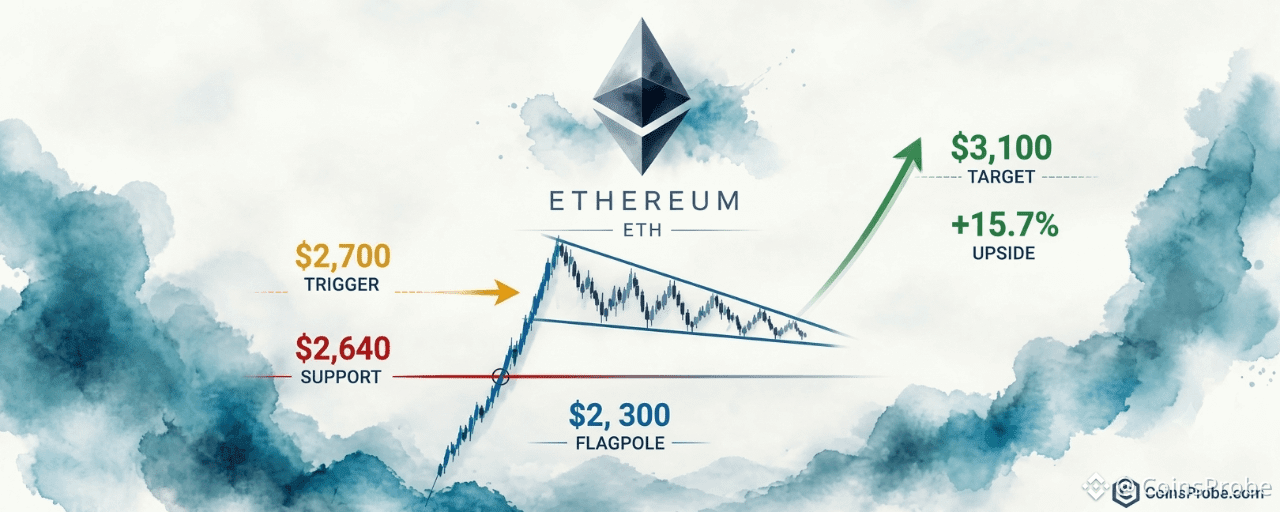
Məqalə
Tərcüməyə bax
Ethereum Bull Flag Forms — $2,700 Hourly Close Is the Breakout TriggerKey Highlights
ETH trading at $2,675.82 (-0.46% 24h) with a 1-hour bull flag tightening near apex per @alicharts$2,700 hourly close is the confirmed breakout trigger — less than 1% from current priceMeasured pattern targets: $2,800 → $2,950 → $3,100 (+15.7% from current price)$2,640 is the invalidation floor — a close below risks flush to $2,450–$2,300
Ethereum is trading at $2,675.82 — down a marginal 0.46% in the past 24 hours against a market cap of $326.7 billion — while its short-term structure is quietly tightening into one of the cleanest continuation setups of the current cycle. The consolidation is not weakness. It is compression before release.
That is the direct read from crypto analyst Ali Martinez (@alicharts), who identifies Ethereum as forming a textbook bull flag on the 1-hour chart. His exact words: “$ETH appears to be forming a bull flag on the lower timeframes. As long as $2,640 continues to hold as support, the setup favors the bulls. Now I’m watching $2,700. An hourly close above that level could confirm the breakout.”
The Setup — A Flagpole, a Wedge, and One Trigger Level
A bull flag is a two-part structure. First, a sharp directional move — the flagpole — driven by genuine buying pressure. Then a controlled, lower-volume consolidation that forms a descending channel or wedge, bleeding off excess momentum without surrendering the structural gain. The pattern resolves when price breaks the upper boundary of the wedge with conviction, resuming the original trend.
On the ETH 1-hour chart shared by @alicharts, the flagpole originated near $2,300, producing the sharp rally leg. From approximately September 23 through October 1, price consolidated into a descending wedge — the flag itself — with the structure now tightening toward its apex. The longer compression holds without breaking support, the more energy accumulates behind the eventual break.
ETH 1HR Chart Analysis — @alicharts | Source: @alicharts (X)
The chart identifies three price levels that define the entire trade structure: $2,640 as active support and the invalidation boundary; $2,700 as the immediate confirmation trigger; and $2,800 as the upper trendline of the flag. Above $2,800, the measured targets extend to $2,950 and then $3,100. From current price of $2,675.82, the move to $3,100 represents +15.7% remaining upside if the pattern completes as measured.
Why $2,700 — The Hourly Close Rule
Martinez is not watching $2,700 as a price touch. He is watching it as a confirmed hourly close above that level. The distinction matters. Intraday wicks above a resistance level are noise — they represent order flow testing liquidity, not structure changing. A closing price above $2,700 on the 1-hour chart means buyers absorbed every attempt to sell the level and held it through the candle’s close. That is a different signal entirely.
At current price of $2,675.82, ETH sits $24.18 — less than 1% below that trigger. The compression is already in its final stage. The wedge apex is near. Volume will confirm or deny the move.
The $2,640 Line — Where the Setup Lives or Dies
Every bull flag has an invalidation. Here it is $2,640. This level is not arbitrary — it represents the lower boundary of the current consolidation range and the structural support that has held throughout the flag formation. As long as it holds, the setup remains intact and bulls retain control of the pattern’s internal logic.
A break below $2,640 on a closing basis does not simply delay the pattern — it negates it. The chart analysis points to $2,450–$2,300 as the flush target if support fails, a range that would erase the bulk of the flagpole’s initial rally. That is a -8.5% to -14% move from current price — the precise reason $2,640 is the level every ETH position holder is watching in real time.
For broader context on Ethereum’s fundamental trajectory, BlackRock’s continued push into the Ethereum ETF market provides the institutional backdrop against which this technical setup is forming.
Bullish and Bearish Scenarios
Bullish Scenario — Hourly Close Above $2,700
An hourly candle closing above $2,700 confirms the bull flag breakout. The immediate target becomes the upper flag resistance at $2,800, followed by the measured move targets at $2,950 and $3,100. From trigger to final target: approximately +14.8%. Volume expansion on the breakout candle is the critical confirmation — a low-volume close above $2,700 would be suspect.
Bearish Scenario — Loss of $2,640
A confirmed hourly close below $2,640 invalidates the bull flag. The wedge structure collapses, and the pattern’s measured risk points to $2,450–$2,300 as the next support cluster — a range representing -8.5% to -14% from current price. In this scenario, the consolidation recharacterizes from a flag to distribution, and the bias flips bearish until $2,640 is reclaimed.
The Structure in Summary
ETH is sitting inside a coiled 1-hour bull flag with less than 1% separating current price from the breakout trigger. The pattern has a clear support floor at $2,640, a defined trigger at $2,700, and a measured target sequence at $2,800 → $2,950 → $3,100. The risk and reward are precisely mapped. What is not mapped is the timing — only a confirmed hourly close above $2,700 opens that door. Until then, $2,640 remains the line that keeps the setup alive. Watch the next few hourly candles closely — the wedge is at its tightest point.
Disclaimer: The views and analysis presented in this article are for informational purposes only and reflect the author’s perspective, not financial advice. Technical patterns and indicators discussed are subject to market volatility and may or may not yield anticipated results. Investors are advised to exercise caution, conduct independent research, and make decisions aligned with their individual risk tolerance.
Ethereum Bull Flag Forms — $2,700 Hourly Close Is the Breakout Trigger
Key Highlights
ETH trading at $2,675.82 (-0.46% 24h) with a 1-hour bull flag tightening near apex per @alicharts$2,700 hourly close is the confirmed breakout trigger — less than 1% from current priceMeasured pattern targets: $2,800 → $2,950 → $3,100 (+15.7% from current price)$2,640 is the invalidation floor — a close below risks flush to $2,450–$2,300
Ethereum is trading at $2,675.82 — down a marginal 0.46% in the past 24 hours against a market cap of $326.7 billion — while its short-term structure is quietly tightening into one of the cleanest continuation setups of the current cycle. The consolidation is not weakness. It is compression before release.
That is the direct read from crypto analyst Ali Martinez (@alicharts), who identifies Ethereum as forming a textbook bull flag on the 1-hour chart. His exact words: “$ETH appears to be forming a bull flag on the lower timeframes. As long as $2,640 continues to hold as support, the setup favors the bulls. Now I’m watching $2,700. An hourly close above that level could confirm the breakout.”
The Setup — A Flagpole, a Wedge, and One Trigger Level
A bull flag is a two-part structure. First, a sharp directional move — the flagpole — driven by genuine buying pressure. Then a controlled, lower-volume consolidation that forms a descending channel or wedge, bleeding off excess momentum without surrendering the structural gain. The pattern resolves when price breaks the upper boundary of the wedge with conviction, resuming the original trend.
On the ETH 1-hour chart shared by @alicharts, the flagpole originated near $2,300, producing the sharp rally leg. From approximately September 23 through October 1, price consolidated into a descending wedge — the flag itself — with the structure now tightening toward its apex. The longer compression holds without breaking support, the more energy accumulates behind the eventual break.
ETH 1HR Chart Analysis — @alicharts | Source: @alicharts (X)
The chart identifies three price levels that define the entire trade structure: $2,640 as active support and the invalidation boundary; $2,700 as the immediate confirmation trigger; and $2,800 as the upper trendline of the flag. Above $2,800, the measured targets extend to $2,950 and then $3,100. From current price of $2,675.82, the move to $3,100 represents +15.7% remaining upside if the pattern completes as measured.
Why $2,700 — The Hourly Close Rule
Martinez is not watching $2,700 as a price touch. He is watching it as a confirmed hourly close above that level. The distinction matters. Intraday wicks above a resistance level are noise — they represent order flow testing liquidity, not structure changing. A closing price above $2,700 on the 1-hour chart means buyers absorbed every attempt to sell the level and held it through the candle’s close. That is a different signal entirely.
At current price of $2,675.82, ETH sits $24.18 — less than 1% below that trigger. The compression is already in its final stage. The wedge apex is near. Volume will confirm or deny the move.
The $2,640 Line — Where the Setup Lives or Dies
Every bull flag has an invalidation. Here it is $2,640. This level is not arbitrary — it represents the lower boundary of the current consolidation range and the structural support that has held throughout the flag formation. As long as it holds, the setup remains intact and bulls retain control of the pattern’s internal logic.
A break below $2,640 on a closing basis does not simply delay the pattern — it negates it. The chart analysis points to $2,450–$2,300 as the flush target if support fails, a range that would erase the bulk of the flagpole’s initial rally. That is a -8.5% to -14% move from current price — the precise reason $2,640 is the level every ETH position holder is watching in real time.
For broader context on Ethereum’s fundamental trajectory, BlackRock’s continued push into the Ethereum ETF market provides the institutional backdrop against which this technical setup is forming.
Bullish and Bearish Scenarios
Bullish Scenario — Hourly Close Above $2,700
An hourly candle closing above $2,700 confirms the bull flag breakout. The immediate target becomes the upper flag resistance at $2,800, followed by the measured move targets at $2,950 and $3,100. From trigger to final target: approximately +14.8%. Volume expansion on the breakout candle is the critical confirmation — a low-volume close above $2,700 would be suspect.
Bearish Scenario — Loss of $2,640
A confirmed hourly close below $2,640 invalidates the bull flag. The wedge structure collapses, and the pattern’s measured risk points to $2,450–$2,300 as the next support cluster — a range representing -8.5% to -14% from current price. In this scenario, the consolidation recharacterizes from a flag to distribution, and the bias flips bearish until $2,640 is reclaimed.
The Structure in Summary
ETH is sitting inside a coiled 1-hour bull flag with less than 1% separating current price from the breakout trigger. The pattern has a clear support floor at $2,640, a defined trigger at $2,700, and a measured target sequence at $2,800 → $2,950 → $3,100. The risk and reward are precisely mapped. What is not mapped is the timing — only a confirmed hourly close above $2,700 opens that door. Until then, $2,640 remains the line that keeps the setup alive. Watch the next few hourly candles closely — the wedge is at its tightest point.
Disclaimer: The views and analysis presented in this article are for informational purposes only and reflect the author’s perspective, not financial advice. Technical patterns and indicators discussed are subject to market volatility and may or may not yield anticipated results. Investors are advised to exercise caution, conduct independent research, and make decisions aligned with their individual risk tolerance.
ETH trading at $2,675.82 (-0.46% 24h) with a 1-hour bull flag tightening near apex per @alicharts$2,700 hourly close is the confirmed breakout trigger — less than 1% from current priceMeasured pattern targets: $2,800 → $2,950 → $3,100 (+15.7% from current price)$2,640 is the invalidation floor — a close below risks flush to $2,450–$2,300
Ethereum is trading at $2,675.82 — down a marginal 0.46% in the past 24 hours against a market cap of $326.7 billion — while its short-term structure is quietly tightening into one of the cleanest continuation setups of the current cycle. The consolidation is not weakness. It is compression before release.
That is the direct read from crypto analyst Ali Martinez (@alicharts), who identifies Ethereum as forming a textbook bull flag on the 1-hour chart. His exact words: “$ETH appears to be forming a bull flag on the lower timeframes. As long as $2,640 continues to hold as support, the setup favors the bulls. Now I’m watching $2,700. An hourly close above that level could confirm the breakout.”
The Setup — A Flagpole, a Wedge, and One Trigger Level
A bull flag is a two-part structure. First, a sharp directional move — the flagpole — driven by genuine buying pressure. Then a controlled, lower-volume consolidation that forms a descending channel or wedge, bleeding off excess momentum without surrendering the structural gain. The pattern resolves when price breaks the upper boundary of the wedge with conviction, resuming the original trend.
On the ETH 1-hour chart shared by @alicharts, the flagpole originated near $2,300, producing the sharp rally leg. From approximately September 23 through October 1, price consolidated into a descending wedge — the flag itself — with the structure now tightening toward its apex. The longer compression holds without breaking support, the more energy accumulates behind the eventual break.
ETH 1HR Chart Analysis — @alicharts | Source: @alicharts (X)
The chart identifies three price levels that define the entire trade structure: $2,640 as active support and the invalidation boundary; $2,700 as the immediate confirmation trigger; and $2,800 as the upper trendline of the flag. Above $2,800, the measured targets extend to $2,950 and then $3,100. From current price of $2,675.82, the move to $3,100 represents +15.7% remaining upside if the pattern completes as measured.
Why $2,700 — The Hourly Close Rule
Martinez is not watching $2,700 as a price touch. He is watching it as a confirmed hourly close above that level. The distinction matters. Intraday wicks above a resistance level are noise — they represent order flow testing liquidity, not structure changing. A closing price above $2,700 on the 1-hour chart means buyers absorbed every attempt to sell the level and held it through the candle’s close. That is a different signal entirely.
At current price of $2,675.82, ETH sits $24.18 — less than 1% below that trigger. The compression is already in its final stage. The wedge apex is near. Volume will confirm or deny the move.
The $2,640 Line — Where the Setup Lives or Dies
Every bull flag has an invalidation. Here it is $2,640. This level is not arbitrary — it represents the lower boundary of the current consolidation range and the structural support that has held throughout the flag formation. As long as it holds, the setup remains intact and bulls retain control of the pattern’s internal logic.
A break below $2,640 on a closing basis does not simply delay the pattern — it negates it. The chart analysis points to $2,450–$2,300 as the flush target if support fails, a range that would erase the bulk of the flagpole’s initial rally. That is a -8.5% to -14% move from current price — the precise reason $2,640 is the level every ETH position holder is watching in real time.
For broader context on Ethereum’s fundamental trajectory, BlackRock’s continued push into the Ethereum ETF market provides the institutional backdrop against which this technical setup is forming.
Bullish and Bearish Scenarios
Bullish Scenario — Hourly Close Above $2,700
An hourly candle closing above $2,700 confirms the bull flag breakout. The immediate target becomes the upper flag resistance at $2,800, followed by the measured move targets at $2,950 and $3,100. From trigger to final target: approximately +14.8%. Volume expansion on the breakout candle is the critical confirmation — a low-volume close above $2,700 would be suspect.
Bearish Scenario — Loss of $2,640
A confirmed hourly close below $2,640 invalidates the bull flag. The wedge structure collapses, and the pattern’s measured risk points to $2,450–$2,300 as the next support cluster — a range representing -8.5% to -14% from current price. In this scenario, the consolidation recharacterizes from a flag to distribution, and the bias flips bearish until $2,640 is reclaimed.
The Structure in Summary
ETH is sitting inside a coiled 1-hour bull flag with less than 1% separating current price from the breakout trigger. The pattern has a clear support floor at $2,640, a defined trigger at $2,700, and a measured target sequence at $2,800 → $2,950 → $3,100. The risk and reward are precisely mapped. What is not mapped is the timing — only a confirmed hourly close above $2,700 opens that door. Until then, $2,640 remains the line that keeps the setup alive. Watch the next few hourly candles closely — the wedge is at its tightest point.
Disclaimer: The views and analysis presented in this article are for informational purposes only and reflect the author’s perspective, not financial advice. Technical patterns and indicators discussed are subject to market volatility and may or may not yield anticipated results. Investors are advised to exercise caution, conduct independent research, and make decisions aligned with their individual risk tolerance.
1
1
181
·
--
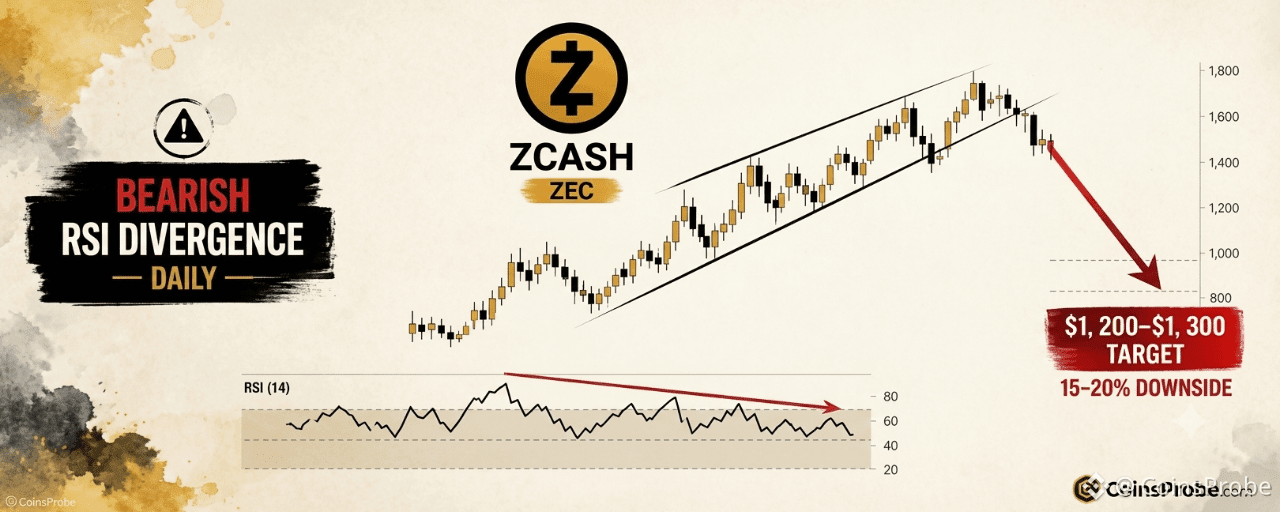
Məqalə
Zcash (ZEC) Ayı RSI Divergensiyası — 15–20% Düşüş Artıq Başlayıbmı?Əsas Mqamlar
ZEC gündəlik qrafiki ayı RSI divergensiyası göstərir — qiymət ~$1,700-da pik edib, momentum isə @CryptoBullet1-ə görə daha aşağı yüksəlişlər (lower highs) çap edib
Divergensiya siqnalını gücləndirən yüksələn kama — ~$1,500-də aşağı kama sərhədi parçalanmanın təsdiq tetikidir
Analitikin hədəf zonası: $1,200–$1,300, hazırkı $1,535 yaxın səviyyələrdən 15–20% enişi ifadə edir
Divergensiya yalnız ZEC RSI eyni anda higher high çap etməklə $1,700-dən yuxarı bağlanarsa ləğv olunur
Zcash (ZEC) gündəlik qrafikdə klassik tükənmə siqnalı nümayiş etdirir — və struktur qeyri-müəyyən deyil. Qiymət yaxınlarda təxminən $1,700-dəki pikə qalxıb, eyni vaxtda Nisbətən Güc İndeksi (RSI) daha aşağı maksimum çap edərək momentumda enən trend xətti formalaşdırıb. Bu ayrışma — yüksək qiymət, aşağı momentum — ayı divergensiyanın klassik tərifidir və artıq gündəlik timeframe-də təsdiqlənib.
Zcash (ZEC) Ayı RSI Divergensiyası — 15–20% Düşüş Artıq Başlayıbmı?
Əsas Mqamlar
ZEC gündəlik qrafiki ayı RSI divergensiyası göstərir — qiymət ~$1,700-da pik edib, momentum isə @CryptoBullet1-ə görə daha aşağı yüksəlişlər (lower highs) çap edib
Divergensiya siqnalını gücləndirən yüksələn kama — ~$1,500-də aşağı kama sərhədi parçalanmanın təsdiq tetikidir
Analitikin hədəf zonası: $1,200–$1,300, hazırkı $1,535 yaxın səviyyələrdən 15–20% enişi ifadə edir
Divergensiya yalnız ZEC RSI eyni anda higher high çap etməklə $1,700-dən yuxarı bağlanarsa ləğv olunur
Zcash (ZEC) gündəlik qrafikdə klassik tükənmə siqnalı nümayiş etdirir — və struktur qeyri-müəyyən deyil. Qiymət yaxınlarda təxminən $1,700-dəki pikə qalxıb, eyni vaxtda Nisbətən Güc İndeksi (RSI) daha aşağı maksimum çap edərək momentumda enən trend xətti formalaşdırıb. Bu ayrışma — yüksək qiymət, aşağı momentum — ayı divergensiyanın klassik tərifidir və artıq gündəlik timeframe-də təsdiqlənib.
ZEC gündəlik qrafiki ayı RSI divergensiyası göstərir — qiymət ~$1,700-da pik edib, momentum isə @CryptoBullet1-ə görə daha aşağı yüksəlişlər (lower highs) çap edib
Divergensiya siqnalını gücləndirən yüksələn kama — ~$1,500-də aşağı kama sərhədi parçalanmanın təsdiq tetikidir
Analitikin hədəf zonası: $1,200–$1,300, hazırkı $1,535 yaxın səviyyələrdən 15–20% enişi ifadə edir
Divergensiya yalnız ZEC RSI eyni anda higher high çap etməklə $1,700-dən yuxarı bağlanarsa ləğv olunur
Zcash (ZEC) gündəlik qrafikdə klassik tükənmə siqnalı nümayiş etdirir — və struktur qeyri-müəyyən deyil. Qiymət yaxınlarda təxminən $1,700-dəki pikə qalxıb, eyni vaxtda Nisbətən Güc İndeksi (RSI) daha aşağı maksimum çap edərək momentumda enən trend xətti formalaşdırıb. Bu ayrışma — yüksək qiymət, aşağı momentum — ayı divergensiyanın klassik tərifidir və artıq gündəlik timeframe-də təsdiqlənib.
746
·
--
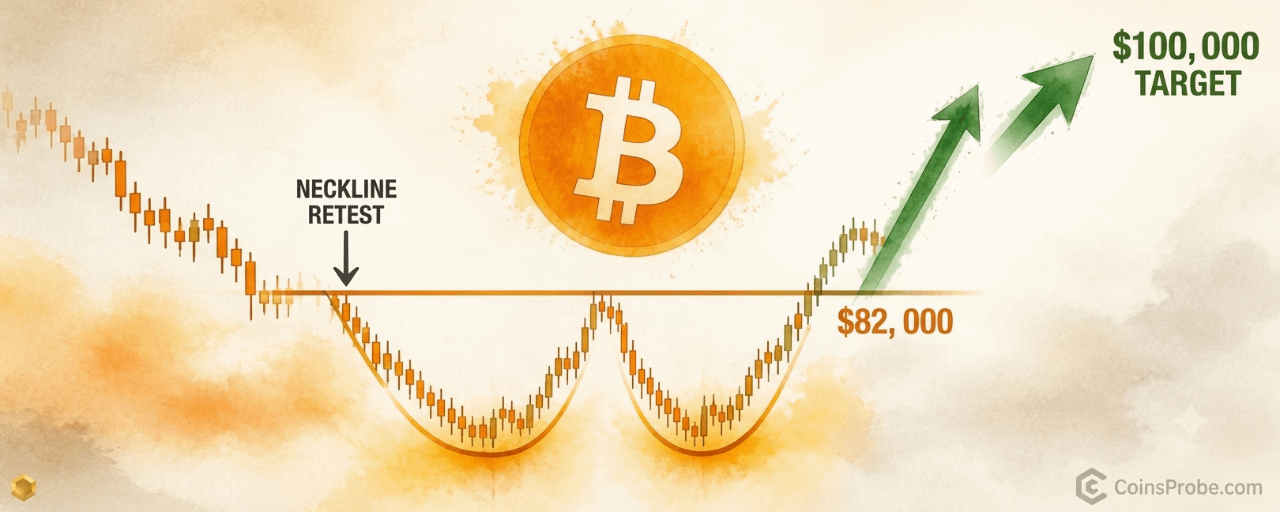
Məqalə
Tərcüməyə bax
Bitcoin Double Bottom Retest at $82K — Pattern Eyes $100,000 TargetKey Highlights
Bitcoin trading at $82,779 (−2.50% 24h) — retesting the $82,000 double bottom neckline as supportAnalyst Ali Martinez (@alicharts) flags $82K retest as a buying opportunity before rally resumesDouble bottom measured move projects a $100,000 target — a +21% move from current levelsDaily close below $82,000 invalidates the pattern and reopens $78,000–$80,000 range
Bitcoin is trading at $82,779 — down 2.50% in the last 24 hours — with a market cap of $1.66 trillion. The pullback is not noise. It is the mechanism a double bottom pattern requires: break the neckline, retest it from above, then resume the rally. That sequence is now unfolding in real time.
Crypto analyst Ali Martinez (@alicharts) flagged the setup on September 28, 2026, identifying Bitcoin as having “broken out of a double bottom pattern and now moving back toward the $82,000 neckline.” His conclusion is direct: “If this level holds as support, the retest could offer a buying opportunity before the rally resumes toward the pattern’s $100,000 target.”
The Double Bottom — What It Is and Why the Retest Matters
A double bottom is a reversal pattern formed when price finds the same floor on two separate occasions, separated by a recovery peak. The line connecting that recovery peak — the neckline — becomes the critical battleground. A confirmed breakout above the neckline is not the trade. The retest of that neckline from above, where former resistance flips to support, is where high-probability entries are structured.
The measured move target for a double bottom is calculated by taking the depth of the pattern — the distance from the two lows to the neckline — and projecting it upward from the breakout point. In Bitcoin’s current setup, that projection lands at $100,000.
At $82,779, Bitcoin is sitting directly at that neckline retest zone. The current 2.50% daily decline is the market performing the structural function the pattern demands. The question is whether $82,000 absorbs the selling or yields to it.
$82,000 — The Neckline That Defines the Trade
The $82,000 level carries specific technical significance here. It is not a round number picked arbitrarily — it is the neckline formed by the recovery high between Bitcoin’s two lows in the double bottom formation. A confirmed hold at this level transforms it from prior resistance into active support, completing the classic breakout-retest-resume sequence.
What makes the current test meaningful is context. Bitcoin has already crossed through this level once on the way up — establishing that buyers were willing to pay above $82,000. A retest now, with price returning to that same zone on lighter momentum, is precisely the structure that pattern traders assign probability to. It is worth noting that Bitcoin has navigated multiple macroeconomic disruptions in recent months, as covered in our analysis of Bitcoin dropping below $62K during geopolitical tensions — making the current recovery structure more significant against that backdrop.
The invalidation is equally well-defined. A daily close below $82,000 would signal the neckline failed to hold as support, negating the breakout and forcing a reassessment of the broader structure. Pattern traders will not wait for ambiguity — that level is the line.
BTC Daily Chart | Source: @alicharts (X)
$100,000 — The Measured Move Target
The $100,000 target is not a sentiment call. It is the arithmetic output of the double bottom’s measured move calculation. From the current neckline at $82,000, that represents a required move of approximately +21% from current levels.
Bitcoin’s recent history shows it is capable of moves of this magnitude within a single cycle leg. The asset has undergone dramatic purchasing-power appreciation over the past decade, and $100,000 — a level it has traded near before — represents a psychologically significant reclaim rather than uncharted territory.
The path from neckline retest to measured move target, however, requires sequential confirmation. The neckline hold must come first. Without it, the $100,000 target has no structural basis.
Bull and Bear Scenarios
Bullish Scenario — $82,000 Holds as Support
A daily close at or above $82,000 following this retest would confirm the neckline-to-support flip. That opens the initial recovery leg toward $90,000 as the first intermediate target, with the full measured move at $100,000 as the pattern’s primary objective. The trigger is a sustained close, not an intraday touch.
Bearish Scenario — $82,000 Fails
A daily close below $82,000 invalidates the double bottom breakout. In that scenario, the pattern resets and price would likely revisit the range between $78,000 and $80,000 — the prior consolidation zone. The broader consequences of a failed breakout retest were examined in our earlier piece on Bitcoin’s $738M liquidation event and 2022-style consolidation risk.
Volume and Confirmation — What to Watch
A neckline retest on declining volume is constructive — it signals the selling pressure driving the pullback is exhausting rather than accelerating. Traders monitoring this setup should watch for volume contraction during the current dip and a volume expansion on the next upside move. That combination — low-volume retest, high-volume resume — is the textbook confirmation of a valid double bottom resolution.
On-chain data platforms including Glassnode and CryptoQuant provide real-time spot demand metrics that can corroborate whether buyer absorption at $82,000 is genuine or temporary. Those readings update continuously and should be monitored alongside the price action.
At $82,779, Bitcoin is at the exact level where the trade either confirms or collapses. Ali Martinez has defined the structure with precision: $82,000 is the line, and $100,000 is the destination if that line holds. Watch for a sustained daily close above $82,000 — that is the one data point that determines whether the double bottom delivers its measured move or the pattern fails and resets.
Disclaimer: The views and analysis presented in this article are for informational purposes only and reflect the author’s perspective, not financial advice. Technical patterns and indicators discussed are subject to market volatility and may or may not yield anticipated results. Investors are advised to exercise caution, conduct independent research, and make decisions aligned with their individual risk tolerance.
Bitcoin Double Bottom Retest at $82K — Pattern Eyes $100,000 Target
Key Highlights
Bitcoin trading at $82,779 (−2.50% 24h) — retesting the $82,000 double bottom neckline as supportAnalyst Ali Martinez (@alicharts) flags $82K retest as a buying opportunity before rally resumesDouble bottom measured move projects a $100,000 target — a +21% move from current levelsDaily close below $82,000 invalidates the pattern and reopens $78,000–$80,000 range
Bitcoin is trading at $82,779 — down 2.50% in the last 24 hours — with a market cap of $1.66 trillion. The pullback is not noise. It is the mechanism a double bottom pattern requires: break the neckline, retest it from above, then resume the rally. That sequence is now unfolding in real time.
Crypto analyst Ali Martinez (@alicharts) flagged the setup on September 28, 2026, identifying Bitcoin as having “broken out of a double bottom pattern and now moving back toward the $82,000 neckline.” His conclusion is direct: “If this level holds as support, the retest could offer a buying opportunity before the rally resumes toward the pattern’s $100,000 target.”
The Double Bottom — What It Is and Why the Retest Matters
A double bottom is a reversal pattern formed when price finds the same floor on two separate occasions, separated by a recovery peak. The line connecting that recovery peak — the neckline — becomes the critical battleground. A confirmed breakout above the neckline is not the trade. The retest of that neckline from above, where former resistance flips to support, is where high-probability entries are structured.
The measured move target for a double bottom is calculated by taking the depth of the pattern — the distance from the two lows to the neckline — and projecting it upward from the breakout point. In Bitcoin’s current setup, that projection lands at $100,000.
At $82,779, Bitcoin is sitting directly at that neckline retest zone. The current 2.50% daily decline is the market performing the structural function the pattern demands. The question is whether $82,000 absorbs the selling or yields to it.
$82,000 — The Neckline That Defines the Trade
The $82,000 level carries specific technical significance here. It is not a round number picked arbitrarily — it is the neckline formed by the recovery high between Bitcoin’s two lows in the double bottom formation. A confirmed hold at this level transforms it from prior resistance into active support, completing the classic breakout-retest-resume sequence.
What makes the current test meaningful is context. Bitcoin has already crossed through this level once on the way up — establishing that buyers were willing to pay above $82,000. A retest now, with price returning to that same zone on lighter momentum, is precisely the structure that pattern traders assign probability to. It is worth noting that Bitcoin has navigated multiple macroeconomic disruptions in recent months, as covered in our analysis of Bitcoin dropping below $62K during geopolitical tensions — making the current recovery structure more significant against that backdrop.
The invalidation is equally well-defined. A daily close below $82,000 would signal the neckline failed to hold as support, negating the breakout and forcing a reassessment of the broader structure. Pattern traders will not wait for ambiguity — that level is the line.
BTC Daily Chart | Source: @alicharts (X)
$100,000 — The Measured Move Target
The $100,000 target is not a sentiment call. It is the arithmetic output of the double bottom’s measured move calculation. From the current neckline at $82,000, that represents a required move of approximately +21% from current levels.
Bitcoin’s recent history shows it is capable of moves of this magnitude within a single cycle leg. The asset has undergone dramatic purchasing-power appreciation over the past decade, and $100,000 — a level it has traded near before — represents a psychologically significant reclaim rather than uncharted territory.
The path from neckline retest to measured move target, however, requires sequential confirmation. The neckline hold must come first. Without it, the $100,000 target has no structural basis.
Bull and Bear Scenarios
Bullish Scenario — $82,000 Holds as Support
A daily close at or above $82,000 following this retest would confirm the neckline-to-support flip. That opens the initial recovery leg toward $90,000 as the first intermediate target, with the full measured move at $100,000 as the pattern’s primary objective. The trigger is a sustained close, not an intraday touch.
Bearish Scenario — $82,000 Fails
A daily close below $82,000 invalidates the double bottom breakout. In that scenario, the pattern resets and price would likely revisit the range between $78,000 and $80,000 — the prior consolidation zone. The broader consequences of a failed breakout retest were examined in our earlier piece on Bitcoin’s $738M liquidation event and 2022-style consolidation risk.
Volume and Confirmation — What to Watch
A neckline retest on declining volume is constructive — it signals the selling pressure driving the pullback is exhausting rather than accelerating. Traders monitoring this setup should watch for volume contraction during the current dip and a volume expansion on the next upside move. That combination — low-volume retest, high-volume resume — is the textbook confirmation of a valid double bottom resolution.
On-chain data platforms including Glassnode and CryptoQuant provide real-time spot demand metrics that can corroborate whether buyer absorption at $82,000 is genuine or temporary. Those readings update continuously and should be monitored alongside the price action.
At $82,779, Bitcoin is at the exact level where the trade either confirms or collapses. Ali Martinez has defined the structure with precision: $82,000 is the line, and $100,000 is the destination if that line holds. Watch for a sustained daily close above $82,000 — that is the one data point that determines whether the double bottom delivers its measured move or the pattern fails and resets.
Disclaimer: The views and analysis presented in this article are for informational purposes only and reflect the author’s perspective, not financial advice. Technical patterns and indicators discussed are subject to market volatility and may or may not yield anticipated results. Investors are advised to exercise caution, conduct independent research, and make decisions aligned with their individual risk tolerance.
Bitcoin trading at $82,779 (−2.50% 24h) — retesting the $82,000 double bottom neckline as supportAnalyst Ali Martinez (@alicharts) flags $82K retest as a buying opportunity before rally resumesDouble bottom measured move projects a $100,000 target — a +21% move from current levelsDaily close below $82,000 invalidates the pattern and reopens $78,000–$80,000 range
Bitcoin is trading at $82,779 — down 2.50% in the last 24 hours — with a market cap of $1.66 trillion. The pullback is not noise. It is the mechanism a double bottom pattern requires: break the neckline, retest it from above, then resume the rally. That sequence is now unfolding in real time.
Crypto analyst Ali Martinez (@alicharts) flagged the setup on September 28, 2026, identifying Bitcoin as having “broken out of a double bottom pattern and now moving back toward the $82,000 neckline.” His conclusion is direct: “If this level holds as support, the retest could offer a buying opportunity before the rally resumes toward the pattern’s $100,000 target.”
The Double Bottom — What It Is and Why the Retest Matters
A double bottom is a reversal pattern formed when price finds the same floor on two separate occasions, separated by a recovery peak. The line connecting that recovery peak — the neckline — becomes the critical battleground. A confirmed breakout above the neckline is not the trade. The retest of that neckline from above, where former resistance flips to support, is where high-probability entries are structured.
The measured move target for a double bottom is calculated by taking the depth of the pattern — the distance from the two lows to the neckline — and projecting it upward from the breakout point. In Bitcoin’s current setup, that projection lands at $100,000.
At $82,779, Bitcoin is sitting directly at that neckline retest zone. The current 2.50% daily decline is the market performing the structural function the pattern demands. The question is whether $82,000 absorbs the selling or yields to it.
$82,000 — The Neckline That Defines the Trade
The $82,000 level carries specific technical significance here. It is not a round number picked arbitrarily — it is the neckline formed by the recovery high between Bitcoin’s two lows in the double bottom formation. A confirmed hold at this level transforms it from prior resistance into active support, completing the classic breakout-retest-resume sequence.
What makes the current test meaningful is context. Bitcoin has already crossed through this level once on the way up — establishing that buyers were willing to pay above $82,000. A retest now, with price returning to that same zone on lighter momentum, is precisely the structure that pattern traders assign probability to. It is worth noting that Bitcoin has navigated multiple macroeconomic disruptions in recent months, as covered in our analysis of Bitcoin dropping below $62K during geopolitical tensions — making the current recovery structure more significant against that backdrop.
The invalidation is equally well-defined. A daily close below $82,000 would signal the neckline failed to hold as support, negating the breakout and forcing a reassessment of the broader structure. Pattern traders will not wait for ambiguity — that level is the line.
BTC Daily Chart | Source: @alicharts (X)
$100,000 — The Measured Move Target
The $100,000 target is not a sentiment call. It is the arithmetic output of the double bottom’s measured move calculation. From the current neckline at $82,000, that represents a required move of approximately +21% from current levels.
Bitcoin’s recent history shows it is capable of moves of this magnitude within a single cycle leg. The asset has undergone dramatic purchasing-power appreciation over the past decade, and $100,000 — a level it has traded near before — represents a psychologically significant reclaim rather than uncharted territory.
The path from neckline retest to measured move target, however, requires sequential confirmation. The neckline hold must come first. Without it, the $100,000 target has no structural basis.
Bull and Bear Scenarios
Bullish Scenario — $82,000 Holds as Support
A daily close at or above $82,000 following this retest would confirm the neckline-to-support flip. That opens the initial recovery leg toward $90,000 as the first intermediate target, with the full measured move at $100,000 as the pattern’s primary objective. The trigger is a sustained close, not an intraday touch.
Bearish Scenario — $82,000 Fails
A daily close below $82,000 invalidates the double bottom breakout. In that scenario, the pattern resets and price would likely revisit the range between $78,000 and $80,000 — the prior consolidation zone. The broader consequences of a failed breakout retest were examined in our earlier piece on Bitcoin’s $738M liquidation event and 2022-style consolidation risk.
Volume and Confirmation — What to Watch
A neckline retest on declining volume is constructive — it signals the selling pressure driving the pullback is exhausting rather than accelerating. Traders monitoring this setup should watch for volume contraction during the current dip and a volume expansion on the next upside move. That combination — low-volume retest, high-volume resume — is the textbook confirmation of a valid double bottom resolution.
On-chain data platforms including Glassnode and CryptoQuant provide real-time spot demand metrics that can corroborate whether buyer absorption at $82,000 is genuine or temporary. Those readings update continuously and should be monitored alongside the price action.
At $82,779, Bitcoin is at the exact level where the trade either confirms or collapses. Ali Martinez has defined the structure with precision: $82,000 is the line, and $100,000 is the destination if that line holds. Watch for a sustained daily close above $82,000 — that is the one data point that determines whether the double bottom delivers its measured move or the pattern fails and resets.
Disclaimer: The views and analysis presented in this article are for informational purposes only and reflect the author’s perspective, not financial advice. Technical patterns and indicators discussed are subject to market volatility and may or may not yield anticipated results. Investors are advised to exercise caution, conduct independent research, and make decisions aligned with their individual risk tolerance.
1
1
180
·
--
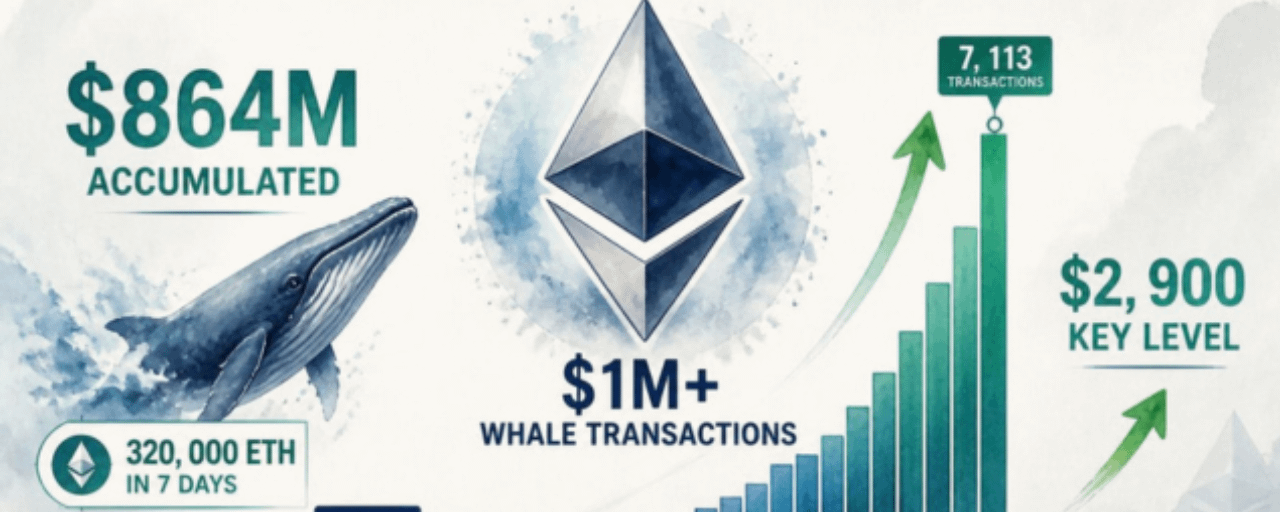
Məqalə
Ethereum Whale Əməliyyatları 500% Sıçradı — 864M Yığılma Siqnalları Son ManeəniƏsas məqamlar
ETH 2,702.83 dollar səviyyəsində ticarət edir (+0.59% 24 saat) — bir həftədə 500% artım göstərən 1M+ dəyərində whale (böyük) əməliyyatlar səngərlənib
Böyük həmlə sahibləri 7 gün ərzində 320,000 ETH əlavə etdi — 864 milyon dollar dəyərində — @alicharts Santiment məlumatlarına istinadən qeyd edir
Gündəlik 1M+ məbləğli əməliyyatların sayı 1,202-dən 7,113-ə yüksəldi; 3,000-dən yuxarı davamlı oxunuş yığılma (accumulation) tezisini bütöv saxlayır
Diqqət ediləcək əsas səviyyə: 2,900 dollar — günlük bağlanış; whale yığılma siqnalının təsdiqi və ya rədd edilməsi
Ethereum 2,702.83 dollar səviyyəsində ticarət edir — son 24 saatda 0.59% artımla — 329.97 milyard dollarlıq bazar kapitalla. Nisbətən sakit görünən qiymət hərəkətinin altında isə bu dövrün ən aqressiv whale yığılma hadisələrindən biri artıq özünü göstərib.
Ethereum Whale Əməliyyatları 500% Sıçradı — 864M Yığılma Siqnalları Son Maneəni
Əsas məqamlar
ETH 2,702.83 dollar səviyyəsində ticarət edir (+0.59% 24 saat) — bir həftədə 500% artım göstərən 1M+ dəyərində whale (böyük) əməliyyatlar səngərlənib
Böyük həmlə sahibləri 7 gün ərzində 320,000 ETH əlavə etdi — 864 milyon dollar dəyərində — @alicharts Santiment məlumatlarına istinadən qeyd edir
Gündəlik 1M+ məbləğli əməliyyatların sayı 1,202-dən 7,113-ə yüksəldi; 3,000-dən yuxarı davamlı oxunuş yığılma (accumulation) tezisini bütöv saxlayır
Diqqət ediləcək əsas səviyyə: 2,900 dollar — günlük bağlanış; whale yığılma siqnalının təsdiqi və ya rədd edilməsi
Ethereum 2,702.83 dollar səviyyəsində ticarət edir — son 24 saatda 0.59% artımla — 329.97 milyard dollarlıq bazar kapitalla. Nisbətən sakit görünən qiymət hərəkətinin altında isə bu dövrün ən aqressiv whale yığılma hadisələrindən biri artıq özünü göstərib.
ETH 2,702.83 dollar səviyyəsində ticarət edir (+0.59% 24 saat) — bir həftədə 500% artım göstərən 1M+ dəyərində whale (böyük) əməliyyatlar səngərlənib
Böyük həmlə sahibləri 7 gün ərzində 320,000 ETH əlavə etdi — 864 milyon dollar dəyərində — @alicharts Santiment məlumatlarına istinadən qeyd edir
Gündəlik 1M+ məbləğli əməliyyatların sayı 1,202-dən 7,113-ə yüksəldi; 3,000-dən yuxarı davamlı oxunuş yığılma (accumulation) tezisini bütöv saxlayır
Diqqət ediləcək əsas səviyyə: 2,900 dollar — günlük bağlanış; whale yığılma siqnalının təsdiqi və ya rədd edilməsi
Ethereum 2,702.83 dollar səviyyəsində ticarət edir — son 24 saatda 0.59% artımla — 329.97 milyard dollarlıq bazar kapitalla. Nisbətən sakit görünən qiymət hərəkətinin altında isə bu dövrün ən aqressiv whale yığılma hadisələrindən biri artıq özünü göstərib.
1
167
·
--
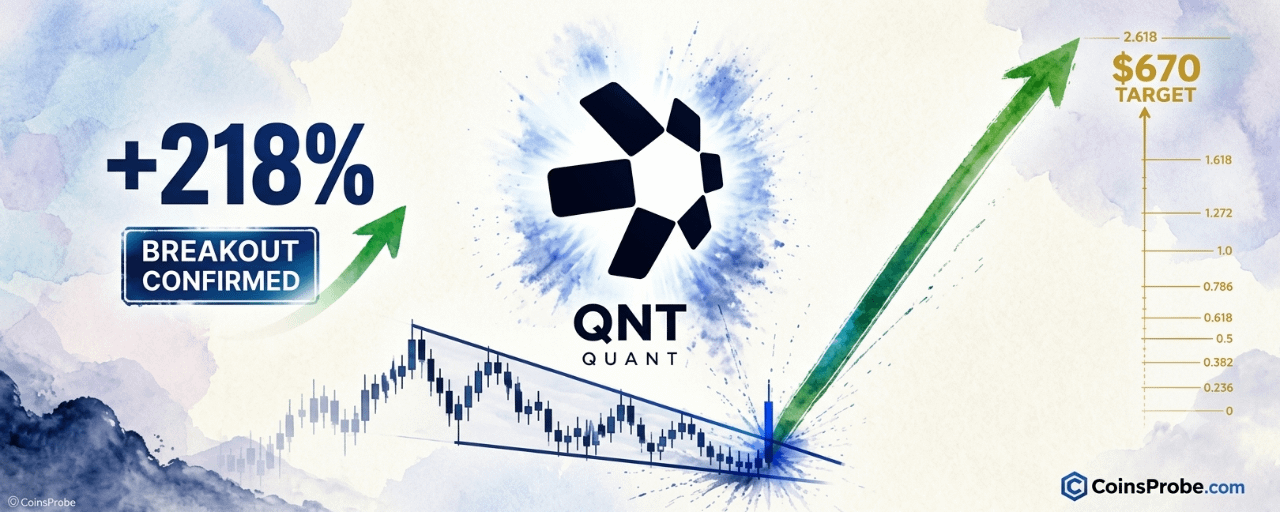
Məqalə
Kvant (QNT) Çoxillik Pazı Yarıb — +218% Artıqdır, Növbəti $670 HədəfiƏsas məqamlar
QNT $165 yaxınlığında ticarət edir — $52–$63 yaxınlığındakı çoxillik pazın dəstək aşağısından +218,62% artımla reyd.
Analitik @CryptoBullet1 həftəlik enən pazın qırılmasını və proqnozlaşdırılan $670 hədəfini (1.618 Fibonacci ekstensiyası) qeyd edir.
$670 hədəfi hazırkı təxminən $165 qiymətindən daha ~305% yüksəlişi ifadə edir.
Kritik ləğvetmə səviyyəsi: həftəlik bağlanış $100-dən aşağı olarsa, bu, yalançı qırılma olduğunu göstərəcək və strukturu ayı (bearish) istiqamətə çevirəcək.
Kvant (QNT) $52–$63 yaxınlığındakı trend xətti aşağısından +218,62% yüksəlişi başa vurduqdan sonra təxminən $165 yaxınlığında ticarət edir — bu, artıq 2022-ci ilin ortalarından 2024-cü ilin sonlarınadək formalaşmış çoxillik enən pazın sıxılma (compression) modelindən tam çıxıb. Bu, erkən mərhələdə spekulyativ qırılma deyil. Qırılma artıq baş verib, ölçülüb və həftəlik qrafikdə təsdiqlənib.
Kvant (QNT) Çoxillik Pazı Yarıb — +218% Artıqdır, Növbəti $670 Hədəfi
Əsas məqamlar
QNT $165 yaxınlığında ticarət edir — $52–$63 yaxınlığındakı çoxillik pazın dəstək aşağısından +218,62% artımla reyd.
Analitik @CryptoBullet1 həftəlik enən pazın qırılmasını və proqnozlaşdırılan $670 hədəfini (1.618 Fibonacci ekstensiyası) qeyd edir.
$670 hədəfi hazırkı təxminən $165 qiymətindən daha ~305% yüksəlişi ifadə edir.
Kritik ləğvetmə səviyyəsi: həftəlik bağlanış $100-dən aşağı olarsa, bu, yalançı qırılma olduğunu göstərəcək və strukturu ayı (bearish) istiqamətə çevirəcək.
Kvant (QNT) $52–$63 yaxınlığındakı trend xətti aşağısından +218,62% yüksəlişi başa vurduqdan sonra təxminən $165 yaxınlığında ticarət edir — bu, artıq 2022-ci ilin ortalarından 2024-cü ilin sonlarınadək formalaşmış çoxillik enən pazın sıxılma (compression) modelindən tam çıxıb. Bu, erkən mərhələdə spekulyativ qırılma deyil. Qırılma artıq baş verib, ölçülüb və həftəlik qrafikdə təsdiqlənib.
QNT $165 yaxınlığında ticarət edir — $52–$63 yaxınlığındakı çoxillik pazın dəstək aşağısından +218,62% artımla reyd.
Analitik @CryptoBullet1 həftəlik enən pazın qırılmasını və proqnozlaşdırılan $670 hədəfini (1.618 Fibonacci ekstensiyası) qeyd edir.
$670 hədəfi hazırkı təxminən $165 qiymətindən daha ~305% yüksəlişi ifadə edir.
Kritik ləğvetmə səviyyəsi: həftəlik bağlanış $100-dən aşağı olarsa, bu, yalançı qırılma olduğunu göstərəcək və strukturu ayı (bearish) istiqamətə çevirəcək.
Kvant (QNT) $52–$63 yaxınlığındakı trend xətti aşağısından +218,62% yüksəlişi başa vurduqdan sonra təxminən $165 yaxınlığında ticarət edir — bu, artıq 2022-ci ilin ortalarından 2024-cü ilin sonlarınadək formalaşmış çoxillik enən pazın sıxılma (compression) modelindən tam çıxıb. Bu, erkən mərhələdə spekulyativ qırılma deyil. Qırılma artıq baş verib, ölçülüb və həftəlik qrafikdə təsdiqlənib.
855
·
--
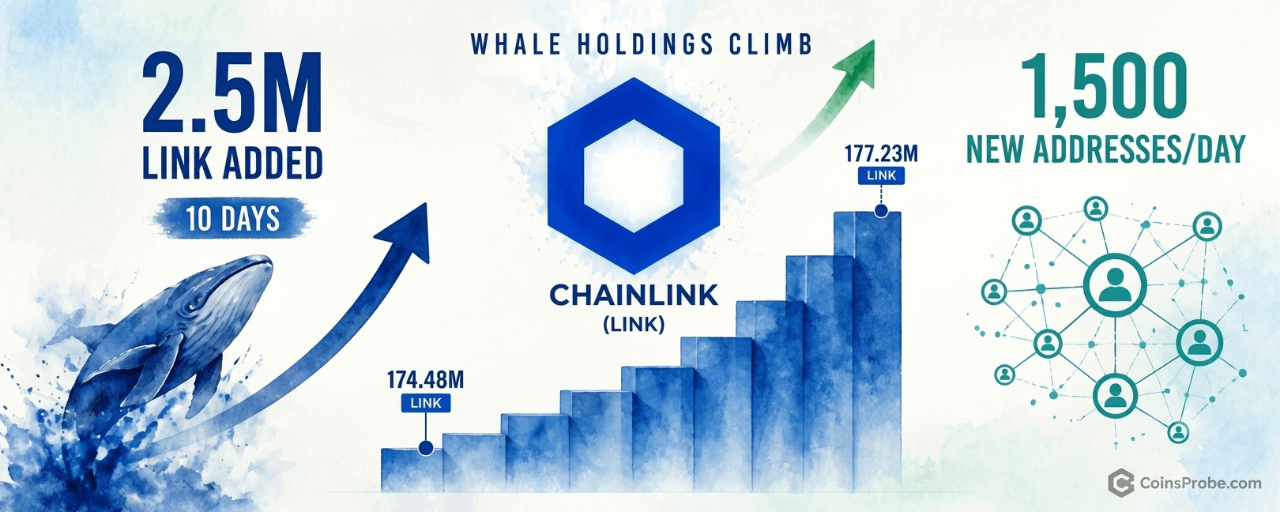
Məqalə
Şəbəkə artımı sürətlənərkən 10 gün ərzində 2.5M LINK əlavə edən Chainlink whalesƏsas məqamlar
LINK ticarəti 14.30$-dır (+1.82% 24s), bazar kapitalı 10.70 milyard$, real vaxt qiymət məlumatına görə
10 gün ərzində 2.50M LINK əlavə edildi — ümumi həcmlər 177.23M LINK-ə çatdı, @alicharts-a görə 10 günlük maksimum
Gündə ~1,500 yeni LINK ünvanı yaradılır; bu, filin yığımı ilə yanaşı şəbəkə qəbulunun artım tempini siqnal edir
Strukturun ayı oxunuşuna çevrilməsi üçün o səviyyənin altında — 13.00$-a diqqət yetirin; fil paylanmasının bu həddin altında qalması bearish dönüş verəcək
Chainlink (LINK) 14.30$-da ticarət edir — son 24 saatda 1.82% artımla — bazar kapitalləşməsi 10.70 milyard$ və gündəlik həcmi 535.8 milyon$. Bu səthi qiymət dinamikasının altında eyni anda iki on-çeyn siqnalı görünür: davamlı iri sahib yığımı və sürətlənən şəbəkə artımı — tarixi olaraq böyük LINK yüksəlişlərindən əvvəl gələn bir kombinasiyadır.
Şəbəkə artımı sürətlənərkən 10 gün ərzində 2.5M LINK əlavə edən Chainlink whales
Əsas məqamlar
LINK ticarəti 14.30$-dır (+1.82% 24s), bazar kapitalı 10.70 milyard$, real vaxt qiymət məlumatına görə
10 gün ərzində 2.50M LINK əlavə edildi — ümumi həcmlər 177.23M LINK-ə çatdı, @alicharts-a görə 10 günlük maksimum
Gündə ~1,500 yeni LINK ünvanı yaradılır; bu, filin yığımı ilə yanaşı şəbəkə qəbulunun artım tempini siqnal edir
Strukturun ayı oxunuşuna çevrilməsi üçün o səviyyənin altında — 13.00$-a diqqət yetirin; fil paylanmasının bu həddin altında qalması bearish dönüş verəcək
Chainlink (LINK) 14.30$-da ticarət edir — son 24 saatda 1.82% artımla — bazar kapitalləşməsi 10.70 milyard$ və gündəlik həcmi 535.8 milyon$. Bu səthi qiymət dinamikasının altında eyni anda iki on-çeyn siqnalı görünür: davamlı iri sahib yığımı və sürətlənən şəbəkə artımı — tarixi olaraq böyük LINK yüksəlişlərindən əvvəl gələn bir kombinasiyadır.
LINK ticarəti 14.30$-dır (+1.82% 24s), bazar kapitalı 10.70 milyard$, real vaxt qiymət məlumatına görə
10 gün ərzində 2.50M LINK əlavə edildi — ümumi həcmlər 177.23M LINK-ə çatdı, @alicharts-a görə 10 günlük maksimum
Gündə ~1,500 yeni LINK ünvanı yaradılır; bu, filin yığımı ilə yanaşı şəbəkə qəbulunun artım tempini siqnal edir
Strukturun ayı oxunuşuna çevrilməsi üçün o səviyyənin altında — 13.00$-a diqqət yetirin; fil paylanmasının bu həddin altında qalması bearish dönüş verəcək
Chainlink (LINK) 14.30$-da ticarət edir — son 24 saatda 1.82% artımla — bazar kapitalləşməsi 10.70 milyard$ və gündəlik həcmi 535.8 milyon$. Bu səthi qiymət dinamikasının altında eyni anda iki on-çeyn siqnalı görünür: davamlı iri sahib yığımı və sürətlənən şəbəkə artımı — tarixi olaraq böyük LINK yüksəlişlərindən əvvəl gələn bir kombinasiyadır.
289
·
--
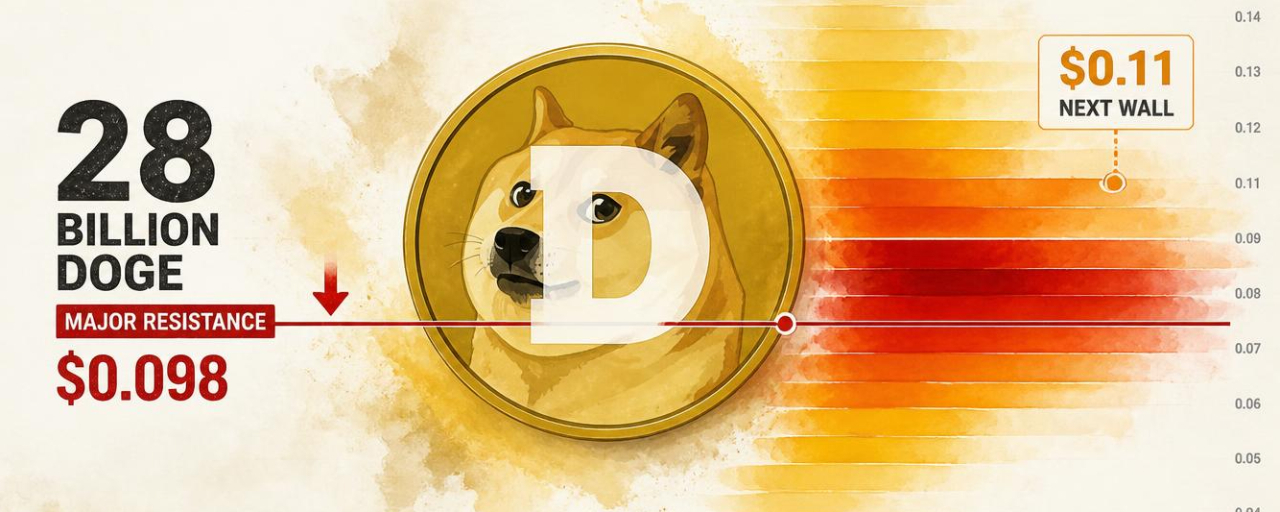
Məqalə
Tərcüməyə bax
Dogecoin Faces 28 Billion DOGE Resistance at $0.098 — Next Wall at $0.11Key Highlights
Glassnode's Cost Basis Distribution heatmap shows ~28 billion DOGE concentrated at $0.098 — flagged by analyst @alicharts as major resistanceA clean break above $0.098 exposes the next supply wall at $0.11, where 4.98 billion DOGE is concentrated — ~82% lighter than the first wallThe $0.18–$0.22 zone holds the heaviest historical accumulation, representing the structural ceiling for any sustained DOGE recoveryCurrent price near $0.08–$0.09 means the majority of mapped DOGE holders remain underwater
Dogecoin is trading just below a densely packed supply wall — and the on-chain data quantifies exactly how large that wall is. According to Glassnode’s Cost Basis Distribution heatmap, approximately 28 billion DOGE changed hands at $0.098, creating the single most concentrated overhead resistance zone in DOGE’s current price structure.
Analyst Ali Martinez (@alicharts) flagged this cluster on September 27, 2026, identifying $0.098 as the first level bulls must absorb before any meaningful upside continuation becomes structurally possible. The data is sourced directly from Glassnode’s cost basis heatmap, which maps where coins last moved — not where they traded, but where they settled.
What the Cost Basis Distribution Heatmap Actually Measures
The Cost Basis Distribution (CBD) heatmap is not a price chart. It tracks the realized price of each coin in circulation — the exact price at which each unit of DOGE last changed wallets. Warmer colors (yellow, orange, red) represent zones where a high volume of coins are concentrated. When price approaches one of these zones from below, those holders are approaching breakeven — and statistical behavior shows a predictable wave of sell pressure as they exit positions taken at a loss.
This is not sentiment. It is mechanics. The heatmap is one of the most direct tools available for identifying where supply-side friction will emerge, independent of order book depth or derivatives positioning.
The $0.098 Wall — 28 Billion DOGE in the Way
The heatmap shared by @alicharts covers the March–September 2024 period sourced from Glassnode, and the reading is unambiguous. The $0.098 level holds approximately 28 billion DOGE — a warm-to-hot concentration band representing holders who accumulated during a prior price run and are currently sitting at or near their cost basis.
With DOGE’s current price near $0.08–$0.09 (the black line on the heatmap sits near the red horizontal reference at ~$0.09), the majority of holders in the mapped range are underwater. That matters because underwater holders typically do one of two things when price returns to their entry: sell to break even, or hold hoping for more. The 28 billion DOGE concentration at $0.098 suggests a large cohort chose the second option — and they are now the primary obstacle to any breakout.
DOGE Cost Basis Distribution Analysis | Source: @alicharts (X)
Clear the Wall — What Opens Above $0.098
A sustained break above $0.098 does not immediately deliver open air. @alicharts identifies the next supply wall at approximately $0.11, where roughly 4.98 billion DOGE is concentrated. That is materially lighter — approximately 82% less supply than the $0.098 cluster — which means price could move through it with less friction if momentum from the first breakout carries through.
Above $0.11, the heatmap reveals a significantly larger structural challenge: a bright, dense band between $0.18 and $0.22 representing heavy historical accumulation from early-to-mid 2024 buyers who remain underwater. This zone would represent the next major test for any sustained DOGE recovery. Bulls need sustained volume at each level to absorb sell pressure — not just intraday spikes.
The Structural Picture — Most Holders at a Loss
The heatmap’s broader message is stark. With current price near $0.08–$0.09, the majority of DOGE’s cost basis clusters sit above current price. That means most holders who accumulated in the tracked period are in the red. This is not inherently bearish — bottoms are formed when all weak hands have exhausted their selling — but it does mean every recovery attempt faces successive waves of breakeven-exit sellers at $0.098, $0.11, and $0.18–$0.22.
For context on broader altcoin market dynamics, the NEAR Protocol Inverse Head & Shoulders breakout analysis highlights how pattern-based signals interact with on-chain supply data — the two frameworks complement each other.
Bullish Scenario — Reclaim of $0.098
A sustained close above $0.098 with volume sufficient to absorb the 28 billion DOGE concentration would shift the short-term structure from bearish to neutral-to-bullish. The immediate target following that reclaim is $0.11 (4.98 billion DOGE resistance). A close above $0.11 opens a path toward the heavier $0.18–$0.22 supply band. The move from $0.098 to $0.11 represents a ~12.2% advance. From $0.098 to the midpoint of the upper band ($0.20) represents approximately +104% — but that requires clearing two successive supply walls with conviction.
Bearish Scenario — Rejection at $0.098
Failure to absorb the $0.098 supply wall — defined as a rejection that pushes price back below $0.085 — keeps the majority of DOGE holders underwater with no near-term catalyst for sentiment recovery. In this scenario, the cost basis heatmap offers no meaningful support level until price revisits the sparse zone near $0.06–$0.07, where coin concentration thins. A return there from current levels would represent a ~20–25% drawdown from the $0.08–$0.09 range.
The Metric to Track
The Cost Basis Distribution heatmap updates as coins move on-chain. If DOGE approaches $0.098 and the 28 billion DOGE cluster begins to thin — meaning those coins are being moved and absorbed rather than held in place — Glassnode’s live data will reflect that shift before it appears in price. That thinning is the signal that the wall is being consumed, not just touched.
Volume is the other variable. Heatmap clusters quantify supply, not demand. A 28 billion DOGE wall can be absorbed quickly if buy-side pressure is sustained — or it can act as a ceiling for weeks if demand is tepid. Neither the heatmap nor any single indicator predicts which scenario plays out. It maps the obstacle; the market decides whether to clear it.
Watch $0.098 — a sustained close above it is the first structural confirmation that DOGE’s recovery has traction. Loss of $0.085 keeps the overhead supply problem intact and opens the path toward $0.06–$0.07.
Disclaimer: This article is for informational purposes only and does not constitute financial advice. Always conduct your own research before making any investment decisions.
Dogecoin Faces 28 Billion DOGE Resistance at $0.098 — Next Wall at $0.11
Key Highlights
Glassnode's Cost Basis Distribution heatmap shows ~28 billion DOGE concentrated at $0.098 — flagged by analyst @alicharts as major resistanceA clean break above $0.098 exposes the next supply wall at $0.11, where 4.98 billion DOGE is concentrated — ~82% lighter than the first wallThe $0.18–$0.22 zone holds the heaviest historical accumulation, representing the structural ceiling for any sustained DOGE recoveryCurrent price near $0.08–$0.09 means the majority of mapped DOGE holders remain underwater
Dogecoin is trading just below a densely packed supply wall — and the on-chain data quantifies exactly how large that wall is. According to Glassnode’s Cost Basis Distribution heatmap, approximately 28 billion DOGE changed hands at $0.098, creating the single most concentrated overhead resistance zone in DOGE’s current price structure.
Analyst Ali Martinez (@alicharts) flagged this cluster on September 27, 2026, identifying $0.098 as the first level bulls must absorb before any meaningful upside continuation becomes structurally possible. The data is sourced directly from Glassnode’s cost basis heatmap, which maps where coins last moved — not where they traded, but where they settled.
What the Cost Basis Distribution Heatmap Actually Measures
The Cost Basis Distribution (CBD) heatmap is not a price chart. It tracks the realized price of each coin in circulation — the exact price at which each unit of DOGE last changed wallets. Warmer colors (yellow, orange, red) represent zones where a high volume of coins are concentrated. When price approaches one of these zones from below, those holders are approaching breakeven — and statistical behavior shows a predictable wave of sell pressure as they exit positions taken at a loss.
This is not sentiment. It is mechanics. The heatmap is one of the most direct tools available for identifying where supply-side friction will emerge, independent of order book depth or derivatives positioning.
The $0.098 Wall — 28 Billion DOGE in the Way
The heatmap shared by @alicharts covers the March–September 2024 period sourced from Glassnode, and the reading is unambiguous. The $0.098 level holds approximately 28 billion DOGE — a warm-to-hot concentration band representing holders who accumulated during a prior price run and are currently sitting at or near their cost basis.
With DOGE’s current price near $0.08–$0.09 (the black line on the heatmap sits near the red horizontal reference at ~$0.09), the majority of holders in the mapped range are underwater. That matters because underwater holders typically do one of two things when price returns to their entry: sell to break even, or hold hoping for more. The 28 billion DOGE concentration at $0.098 suggests a large cohort chose the second option — and they are now the primary obstacle to any breakout.
DOGE Cost Basis Distribution Analysis | Source: @alicharts (X)
Clear the Wall — What Opens Above $0.098
A sustained break above $0.098 does not immediately deliver open air. @alicharts identifies the next supply wall at approximately $0.11, where roughly 4.98 billion DOGE is concentrated. That is materially lighter — approximately 82% less supply than the $0.098 cluster — which means price could move through it with less friction if momentum from the first breakout carries through.
Above $0.11, the heatmap reveals a significantly larger structural challenge: a bright, dense band between $0.18 and $0.22 representing heavy historical accumulation from early-to-mid 2024 buyers who remain underwater. This zone would represent the next major test for any sustained DOGE recovery. Bulls need sustained volume at each level to absorb sell pressure — not just intraday spikes.
The Structural Picture — Most Holders at a Loss
The heatmap’s broader message is stark. With current price near $0.08–$0.09, the majority of DOGE’s cost basis clusters sit above current price. That means most holders who accumulated in the tracked period are in the red. This is not inherently bearish — bottoms are formed when all weak hands have exhausted their selling — but it does mean every recovery attempt faces successive waves of breakeven-exit sellers at $0.098, $0.11, and $0.18–$0.22.
For context on broader altcoin market dynamics, the NEAR Protocol Inverse Head & Shoulders breakout analysis highlights how pattern-based signals interact with on-chain supply data — the two frameworks complement each other.
Bullish Scenario — Reclaim of $0.098
A sustained close above $0.098 with volume sufficient to absorb the 28 billion DOGE concentration would shift the short-term structure from bearish to neutral-to-bullish. The immediate target following that reclaim is $0.11 (4.98 billion DOGE resistance). A close above $0.11 opens a path toward the heavier $0.18–$0.22 supply band. The move from $0.098 to $0.11 represents a ~12.2% advance. From $0.098 to the midpoint of the upper band ($0.20) represents approximately +104% — but that requires clearing two successive supply walls with conviction.
Bearish Scenario — Rejection at $0.098
Failure to absorb the $0.098 supply wall — defined as a rejection that pushes price back below $0.085 — keeps the majority of DOGE holders underwater with no near-term catalyst for sentiment recovery. In this scenario, the cost basis heatmap offers no meaningful support level until price revisits the sparse zone near $0.06–$0.07, where coin concentration thins. A return there from current levels would represent a ~20–25% drawdown from the $0.08–$0.09 range.
The Metric to Track
The Cost Basis Distribution heatmap updates as coins move on-chain. If DOGE approaches $0.098 and the 28 billion DOGE cluster begins to thin — meaning those coins are being moved and absorbed rather than held in place — Glassnode’s live data will reflect that shift before it appears in price. That thinning is the signal that the wall is being consumed, not just touched.
Volume is the other variable. Heatmap clusters quantify supply, not demand. A 28 billion DOGE wall can be absorbed quickly if buy-side pressure is sustained — or it can act as a ceiling for weeks if demand is tepid. Neither the heatmap nor any single indicator predicts which scenario plays out. It maps the obstacle; the market decides whether to clear it.
Watch $0.098 — a sustained close above it is the first structural confirmation that DOGE’s recovery has traction. Loss of $0.085 keeps the overhead supply problem intact and opens the path toward $0.06–$0.07.
Disclaimer: This article is for informational purposes only and does not constitute financial advice. Always conduct your own research before making any investment decisions.
Glassnode's Cost Basis Distribution heatmap shows ~28 billion DOGE concentrated at $0.098 — flagged by analyst @alicharts as major resistanceA clean break above $0.098 exposes the next supply wall at $0.11, where 4.98 billion DOGE is concentrated — ~82% lighter than the first wallThe $0.18–$0.22 zone holds the heaviest historical accumulation, representing the structural ceiling for any sustained DOGE recoveryCurrent price near $0.08–$0.09 means the majority of mapped DOGE holders remain underwater
Dogecoin is trading just below a densely packed supply wall — and the on-chain data quantifies exactly how large that wall is. According to Glassnode’s Cost Basis Distribution heatmap, approximately 28 billion DOGE changed hands at $0.098, creating the single most concentrated overhead resistance zone in DOGE’s current price structure.
Analyst Ali Martinez (@alicharts) flagged this cluster on September 27, 2026, identifying $0.098 as the first level bulls must absorb before any meaningful upside continuation becomes structurally possible. The data is sourced directly from Glassnode’s cost basis heatmap, which maps where coins last moved — not where they traded, but where they settled.
What the Cost Basis Distribution Heatmap Actually Measures
The Cost Basis Distribution (CBD) heatmap is not a price chart. It tracks the realized price of each coin in circulation — the exact price at which each unit of DOGE last changed wallets. Warmer colors (yellow, orange, red) represent zones where a high volume of coins are concentrated. When price approaches one of these zones from below, those holders are approaching breakeven — and statistical behavior shows a predictable wave of sell pressure as they exit positions taken at a loss.
This is not sentiment. It is mechanics. The heatmap is one of the most direct tools available for identifying where supply-side friction will emerge, independent of order book depth or derivatives positioning.
The $0.098 Wall — 28 Billion DOGE in the Way
The heatmap shared by @alicharts covers the March–September 2024 period sourced from Glassnode, and the reading is unambiguous. The $0.098 level holds approximately 28 billion DOGE — a warm-to-hot concentration band representing holders who accumulated during a prior price run and are currently sitting at or near their cost basis.
With DOGE’s current price near $0.08–$0.09 (the black line on the heatmap sits near the red horizontal reference at ~$0.09), the majority of holders in the mapped range are underwater. That matters because underwater holders typically do one of two things when price returns to their entry: sell to break even, or hold hoping for more. The 28 billion DOGE concentration at $0.098 suggests a large cohort chose the second option — and they are now the primary obstacle to any breakout.
DOGE Cost Basis Distribution Analysis | Source: @alicharts (X)
Clear the Wall — What Opens Above $0.098
A sustained break above $0.098 does not immediately deliver open air. @alicharts identifies the next supply wall at approximately $0.11, where roughly 4.98 billion DOGE is concentrated. That is materially lighter — approximately 82% less supply than the $0.098 cluster — which means price could move through it with less friction if momentum from the first breakout carries through.
Above $0.11, the heatmap reveals a significantly larger structural challenge: a bright, dense band between $0.18 and $0.22 representing heavy historical accumulation from early-to-mid 2024 buyers who remain underwater. This zone would represent the next major test for any sustained DOGE recovery. Bulls need sustained volume at each level to absorb sell pressure — not just intraday spikes.
The Structural Picture — Most Holders at a Loss
The heatmap’s broader message is stark. With current price near $0.08–$0.09, the majority of DOGE’s cost basis clusters sit above current price. That means most holders who accumulated in the tracked period are in the red. This is not inherently bearish — bottoms are formed when all weak hands have exhausted their selling — but it does mean every recovery attempt faces successive waves of breakeven-exit sellers at $0.098, $0.11, and $0.18–$0.22.
For context on broader altcoin market dynamics, the NEAR Protocol Inverse Head & Shoulders breakout analysis highlights how pattern-based signals interact with on-chain supply data — the two frameworks complement each other.
Bullish Scenario — Reclaim of $0.098
A sustained close above $0.098 with volume sufficient to absorb the 28 billion DOGE concentration would shift the short-term structure from bearish to neutral-to-bullish. The immediate target following that reclaim is $0.11 (4.98 billion DOGE resistance). A close above $0.11 opens a path toward the heavier $0.18–$0.22 supply band. The move from $0.098 to $0.11 represents a ~12.2% advance. From $0.098 to the midpoint of the upper band ($0.20) represents approximately +104% — but that requires clearing two successive supply walls with conviction.
Bearish Scenario — Rejection at $0.098
Failure to absorb the $0.098 supply wall — defined as a rejection that pushes price back below $0.085 — keeps the majority of DOGE holders underwater with no near-term catalyst for sentiment recovery. In this scenario, the cost basis heatmap offers no meaningful support level until price revisits the sparse zone near $0.06–$0.07, where coin concentration thins. A return there from current levels would represent a ~20–25% drawdown from the $0.08–$0.09 range.
The Metric to Track
The Cost Basis Distribution heatmap updates as coins move on-chain. If DOGE approaches $0.098 and the 28 billion DOGE cluster begins to thin — meaning those coins are being moved and absorbed rather than held in place — Glassnode’s live data will reflect that shift before it appears in price. That thinning is the signal that the wall is being consumed, not just touched.
Volume is the other variable. Heatmap clusters quantify supply, not demand. A 28 billion DOGE wall can be absorbed quickly if buy-side pressure is sustained — or it can act as a ceiling for weeks if demand is tepid. Neither the heatmap nor any single indicator predicts which scenario plays out. It maps the obstacle; the market decides whether to clear it.
Watch $0.098 — a sustained close above it is the first structural confirmation that DOGE’s recovery has traction. Loss of $0.085 keeps the overhead supply problem intact and opens the path toward $0.06–$0.07.
Disclaimer: This article is for informational purposes only and does not constitute financial advice. Always conduct your own research before making any investment decisions.
1
103
·
--
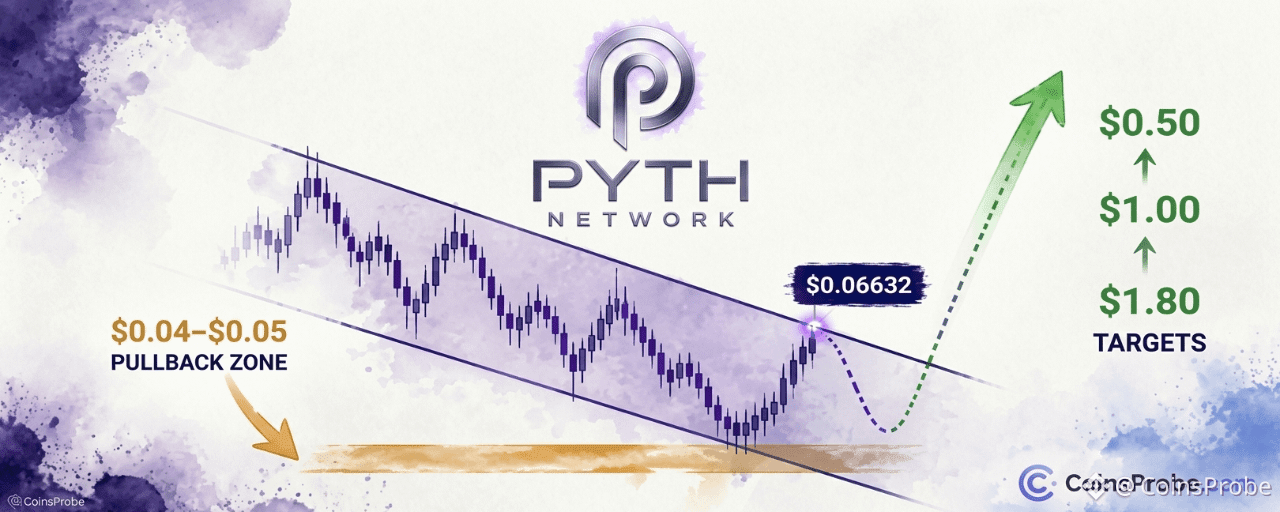
Məqalə
PYTH Kanal Müqaviməti ilə Üzləşir — Analitik $1.8 Hədəfindən Öncə $0.04 Geri Çəkilməyə BaxırƏsas məqamlar
PYTH $0.06632-də ticarət edir — həftəlik 7.49% artım — təsdiqlənmiş enən kanal müqavimətini @CryptoBullet1-ə uyğun şəkildə yenidən sınağa çıxarır
Analitik proyektlər $0.04–$0.05-ə doğru geri çəkilmə arxasından qırılma cəhdini gözləyir; əsas hədəflər $0.50, $1.00 və $1.80-dir
Qırılma təsdiqi kanal sərhədi yaxınlığında $0.09–$0.10-dan yuxarı həftəlik bağlanma tələb edir; $0.04 itkisi setup-u etibarsız edir
Pyth Network (PYTH) hazırda $0.06632 səviyyəsindədir — həftə ərzində 7.49% artım — amma çoxaylıq enən kanalın müqavimət zonasının birbaşa içindədir; qiymət indiyə qədərki hər sınaqda bu zəmmi rədd edib. Geri dönüş gerçəkdir. Qırılma isə hələ təsdiqlənməyib.
PYTH Kanal Müqaviməti ilə Üzləşir — Analitik $1.8 Hədəfindən Öncə $0.04 Geri Çəkilməyə Baxır
Əsas məqamlar
PYTH $0.06632-də ticarət edir — həftəlik 7.49% artım — təsdiqlənmiş enən kanal müqavimətini @CryptoBullet1-ə uyğun şəkildə yenidən sınağa çıxarır
Analitik proyektlər $0.04–$0.05-ə doğru geri çəkilmə arxasından qırılma cəhdini gözləyir; əsas hədəflər $0.50, $1.00 və $1.80-dir
Qırılma təsdiqi kanal sərhədi yaxınlığında $0.09–$0.10-dan yuxarı həftəlik bağlanma tələb edir; $0.04 itkisi setup-u etibarsız edir
Pyth Network (PYTH) hazırda $0.06632 səviyyəsindədir — həftə ərzində 7.49% artım — amma çoxaylıq enən kanalın müqavimət zonasının birbaşa içindədir; qiymət indiyə qədərki hər sınaqda bu zəmmi rədd edib. Geri dönüş gerçəkdir. Qırılma isə hələ təsdiqlənməyib.
PYTH $0.06632-də ticarət edir — həftəlik 7.49% artım — təsdiqlənmiş enən kanal müqavimətini @CryptoBullet1-ə uyğun şəkildə yenidən sınağa çıxarır
Analitik proyektlər $0.04–$0.05-ə doğru geri çəkilmə arxasından qırılma cəhdini gözləyir; əsas hədəflər $0.50, $1.00 və $1.80-dir
Qırılma təsdiqi kanal sərhədi yaxınlığında $0.09–$0.10-dan yuxarı həftəlik bağlanma tələb edir; $0.04 itkisi setup-u etibarsız edir
Pyth Network (PYTH) hazırda $0.06632 səviyyəsindədir — həftə ərzində 7.49% artım — amma çoxaylıq enən kanalın müqavimət zonasının birbaşa içindədir; qiymət indiyə qədərki hər sınaqda bu zəmmi rədd edib. Geri dönüş gerçəkdir. Qırılma isə hələ təsdiqlənməyib.
1
2
684
Daha çox kontent araşdırmaq üçün daxil olun
Binance Square-də qlobal kriptovalyuta istifadəçilərinə qoşulun
⚡️ Kriptovalyuta haqqında ən son və faydalı məlumatları əldə edin.
💬 Dünyanın ən böyük kriptovalyuta birjası tərəfindən etibar edilir.
👍 Doğrulanmış yaradıcılardan gələn real məlumatları kəşf edin.
E-poçt/Telefon nömrəsi
Trenddə olan mövzular
BitcoinClears$85200
9,866 baxış
Müzakirə edir: 202
Biz hərəkəti ələ keçirdik və $BTC məlumatın gəldiyi andakı yerimizdə dəqiq olaraq dayanır. Ticarət üçün əsl səbir belə görünür.
Məlumatlar qarışıq gəldi, amma bəzi vacib rəqəmlər var idi. ADP Non-Farm Employment Change 90K oldu, proqnoz isə 73K idi. Core PCE isə 0.2% çıxdı, gözlənti 0.3% idi. Yekun ÜDM (Final GDP) də 2.2% ilə daha güclü oldu — proqnoz 1.5% idi. Personal Spending isə 0.9% ilə 0.8% gözləniləndən yüksək çıxdı. Eyni zamanda, Personal Income 0.2% ilə — 0.5% proqnozunu əldən verdi.
BTC əvvəlcə 85,600$-a qədər sürətlə yüksəldi və indi lazım olduğu yerə qayıdıb. Mən hələ də aşağı diapazonlara baxıram: 82,759$ və 80,000$ likvidliyi. Çünki yuxarıdakı likvidlik işi bitdi, nöqtəsi qoyulub.
Məlumat çıxan zaman canlı sessiya keçirdik və həmin sessiyada bazarı 83,800$-da gördük, sonra 85,600$-ə qədər yüksəldi, daha sonra isə 83,000$ tərəfə qayıtdı — amma biz yenə də ticarətə daxil olmadıq.
Səbir budur.
Bazarın aydın istiqaməti yoxdursa, biz girişə məcbur edə bilmərik. Eyni diapazon hələ də diqqətdədir və bazar bizə setup-u verənə qədər gözləyəcəyik.
Baxın, uşaqlar, sessiya necə keçdi? Hörmətli üzvlərimizlə daha müntəzəm sessiyalar keçirməliyik ki, bazar barədə düzgün müzakirələr apara bilək?
#BitcoinClears$85200 #AltcoinSeasonIndexHoldsAbove60For5Days #USADPAdds90000JobsInSeptember #BitcoinSlipsBelow$84000 #SECToClarifyOnChainFundraisingRules
Crypto_LUX
·24 bəyənmə
·16.8k baxış
AltcoinSeasonIndexHoldsAbove60For5Days
49,985 baxış
Müzakirə edir: 1,115
USADPAdds90000JobsInSeptember
23,401 baxış
Müzakirə edir: 626